| Param | Original file | Final file |
|---|---|---|
| Filename | modeM0/AS1A07_046T01_9000003498_23676cztM0_level2.evt | modeM0/AS1A07_046T01_9000003498_23676cztM0_level2_quad_clean.evt |
| Size (bytes) | 596,594,880 | 101,494,080 |
| Size | 569.0 MB | 96.8 MB |
| Events in quadrant A | 3,957,804 | 635,529 |
| Events in quadrant B | 4,163,220 | 649,059 |
| Events in quadrant C | 4,090,415 | 627,307 |
| Events in quadrant D | 5,315,431 | 607,031 |
| Mode M0 | |||
|---|---|---|---|
| Quadrant | BADHDUFLAG | Total packets | Discarded packets |
| A | 0 | 16898 | 3 |
| B | 0 | 17501 | 3 |
| C | 0 | 17261 | 3 |
| D | 0 | 21065 | 7 |
| Mode SS | |||
|---|---|---|---|
| Quadrant | BADHDUFLAG | Total packets | Discarded packets |
| A | 0 | 166 | 0 |
| B | 0 | 166 | 0 |
| C | 0 | 166 | 0 |
| D | 0 | 166 | 0 |
| Mode M9 | |||
|---|---|---|---|
| Quadrant | BADHDUFLAG | Total packets | Discarded packets |
| A | 0 | 24 | 0 |
| B | 0 | 24 | 0 |
| C | 0 | 24 | 0 |
| D | 0 | 24 | 0 |
| Quadrant | Total seconds | Saturated seconds | Saturation percentage |
|---|---|---|---|
| A | 7978 | 118 | 1.479067% |
| B | 7978 | 158 | 1.980446% |
| C | 7978 | 201 | 2.519428% |
| D | 7977 | 387 | 4.851448% |
Noise dominated data is calculated using 1-second bins in cleaned event files. If a bin has >2000 counts, and if more than 50% of those come from <1% of pixels, then it is considered to be noise-dominated and hence unusable.
| Quadrant | # 1 sec bins | Bins with >0 counts | Bins with >2000 counts | High rate bins dominated by noise | Noise dominated (total time) | Noise dominated (detector-on time) | Marked lightcurve |
|---|---|---|---|---|---|---|---|
| A | 27475 | 7979 | 0 | 0 | 0.00% | 0.00% | 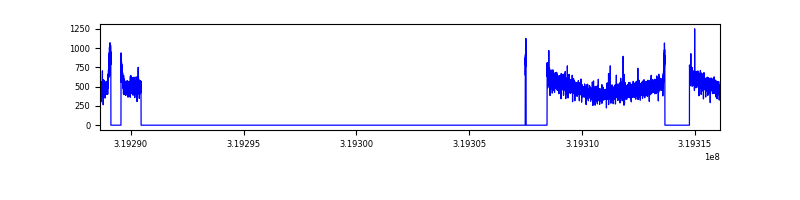 |
| B | 27475 | 7979 | 8 | 8 | 0.03% | 0.10% | 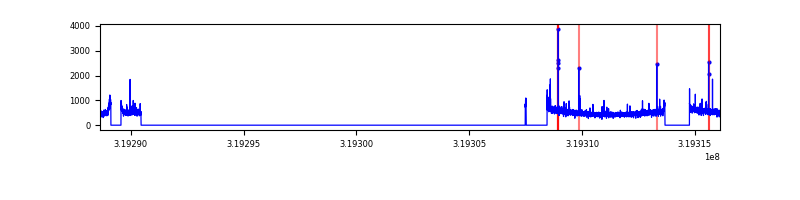 |
| C | 27475 | 7979 | 1 | 1 | 0.00% | 0.01% | 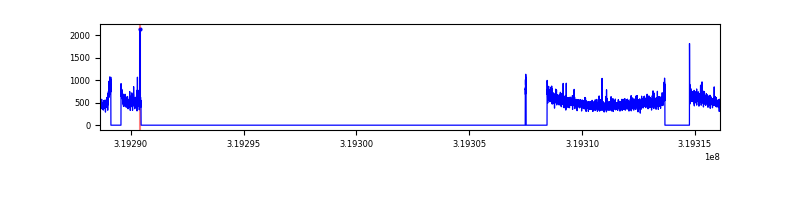 |
| D | 27475 | 7978 | 204 | 204 | 0.74% | 2.56% | 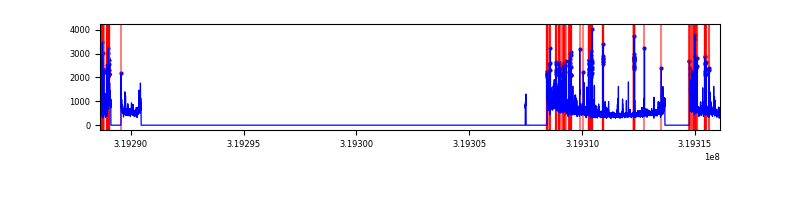 |
Top three noisy pixels from each quadrant. If the there are fewer than three noisy pixels in the level2.evt file, extra rows are filled as -1
| Pixel properties | Quadrant properties | ||||||
|---|---|---|---|---|---|---|---|
| Quadrant | DetID | PixID | Counts | Sigma | Mean | Median | Sigma |
| A | 13 | 254 | 14167 | 63.51 | 1026 | 1005 | 207.2 |
| A | 3 | 137 | 9115 | 39.13 | 1026 | 1005 | 207.2 |
| A | 0 | 226 | 8797 | 37.6 | 1026 | 1005 | 207.2 |
| B | 0 | 230 | 50221 | 249.6 | 1021 | 996 | 197.2 |
| B | 0 | 189 | 33379 | 164.2 | 1021 | 996 | 197.2 |
| B | 15 | 33 | 27201 | 132.87 | 1021 | 996 | 197.2 |
| C | 14 | 238 | 155660 | 662.48 | 993 | 999 | 233.5 |
| C | 7 | 247 | 30202 | 125.09 | 993 | 999 | 233.5 |
| C | 10 | 9 | 20181 | 82.16 | 993 | 999 | 233.5 |
| D | 1 | 52 | 792951 | 3276.87 | 993 | 966 | 241.7 |
| D | 12 | 233 | 522210 | 2156.67 | 993 | 966 | 241.7 |
| D | 12 | 235 | 89317 | 365.56 | 993 | 966 | 241.7 |
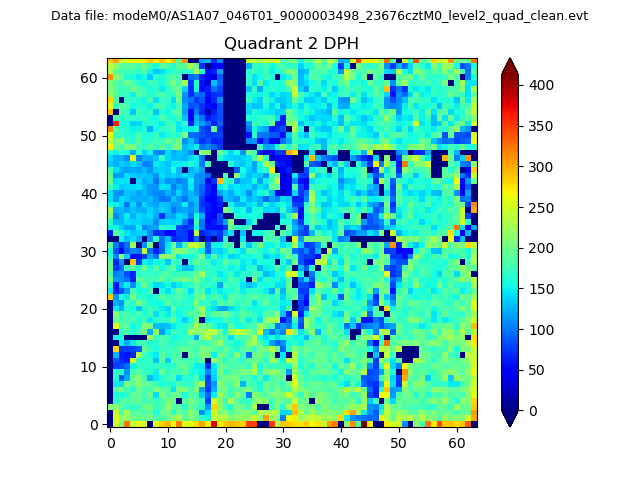
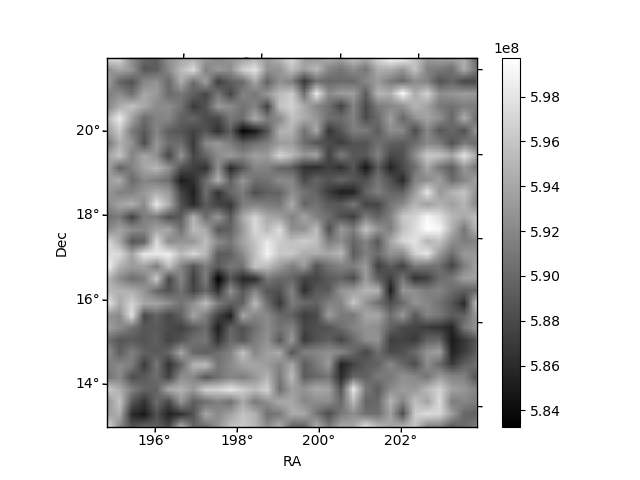
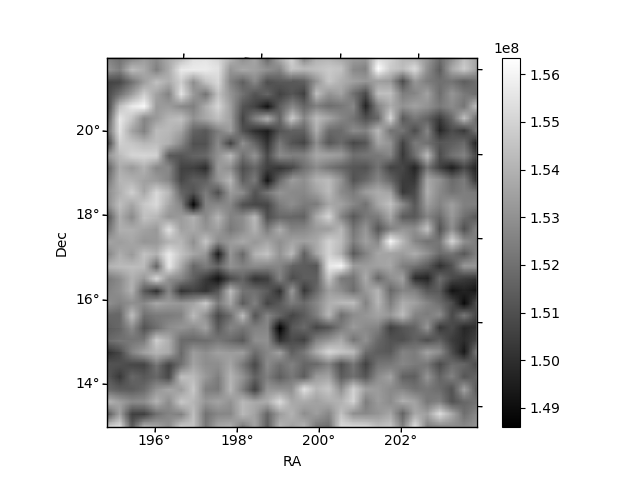
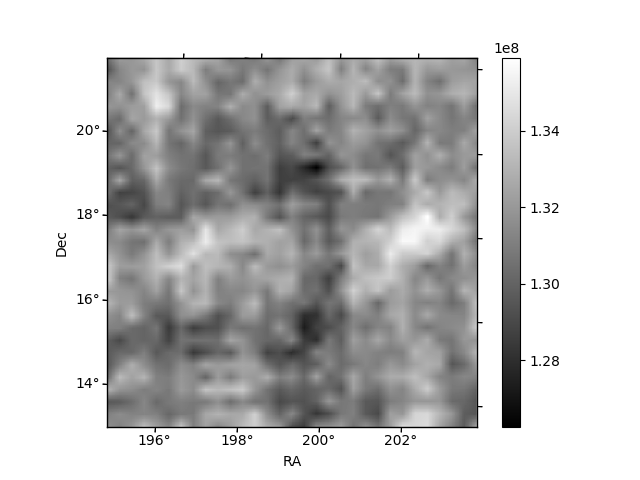
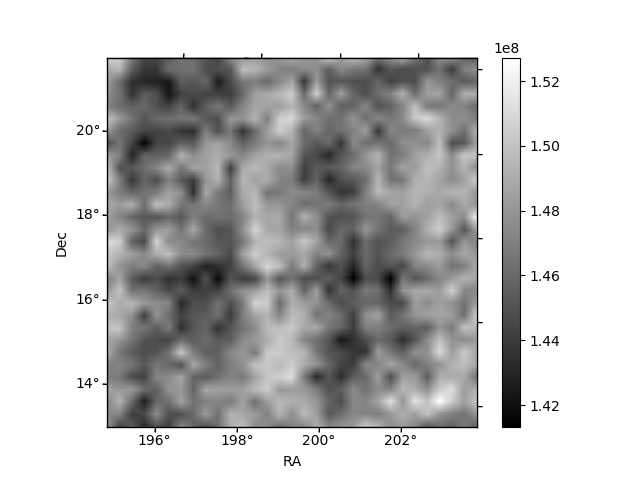
Histogram calculated using DETX and DETY for each event in the final _common_clean file
| Quadrant A | 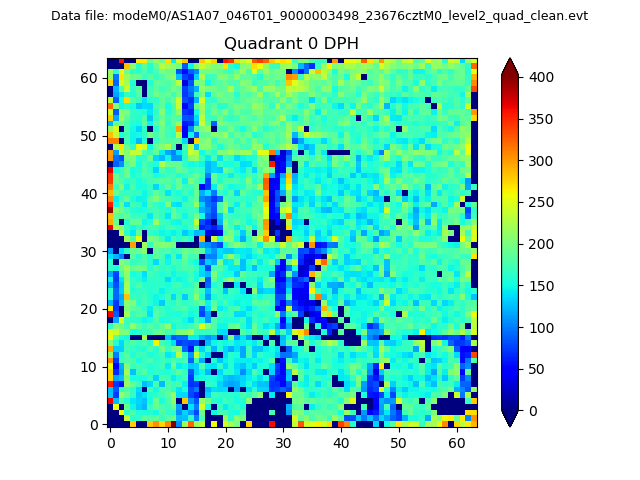 |
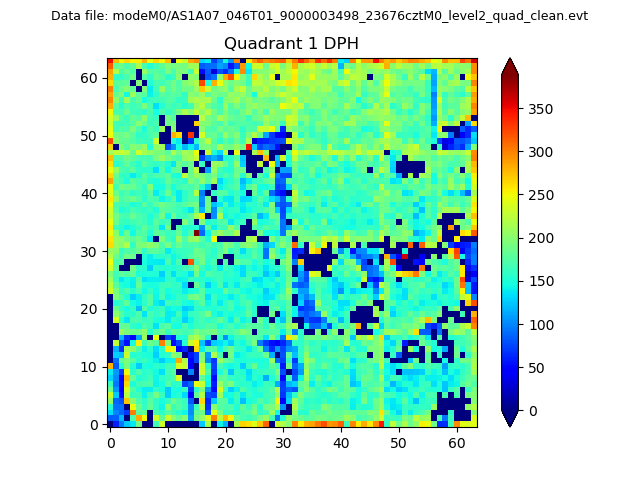 |
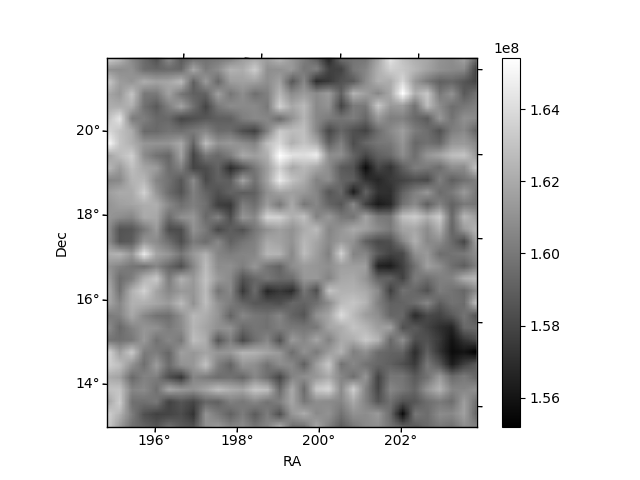
Quadrant B |
|---|---|---|---|
| Quadrant D | 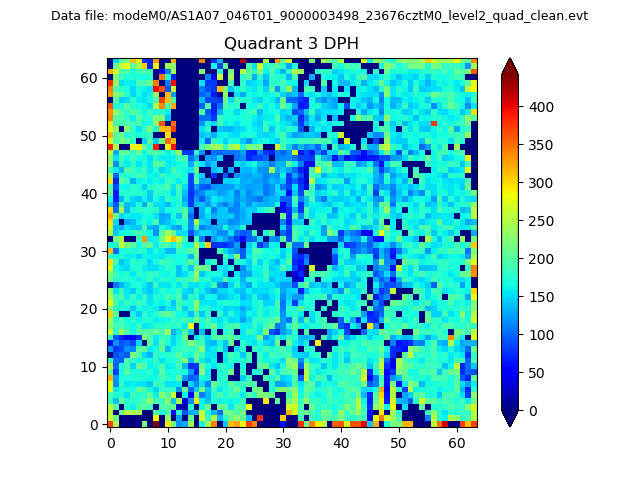 |
 |
Quadrant C |
| Plot type | Count rate plots | Images |
|---|---|---|
| Comparison with Poisson distribution Blue bars denote a histogram of data divided into 1 sec bins. Red curve is a Poisson curve with rate = median count rate of data. |
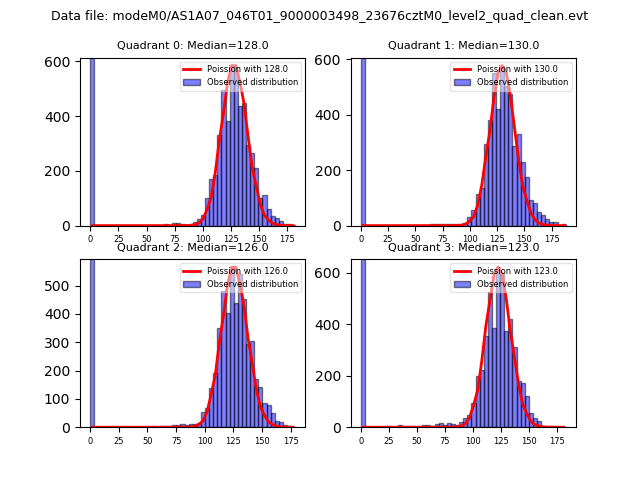 |
 |
| Quadrant-wise count rates Data is divided into 100 sec bins |
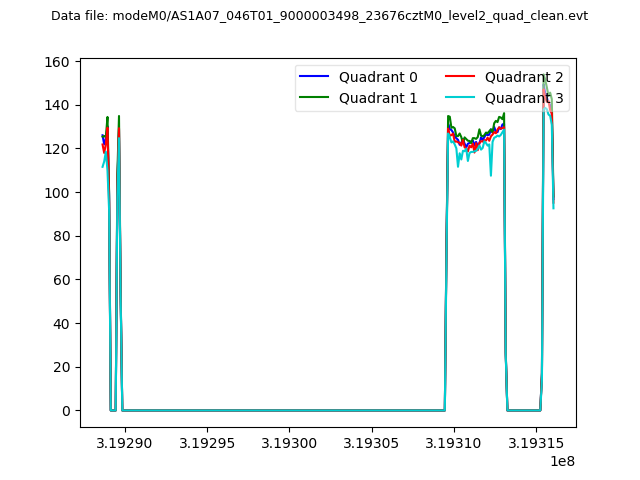 |
|
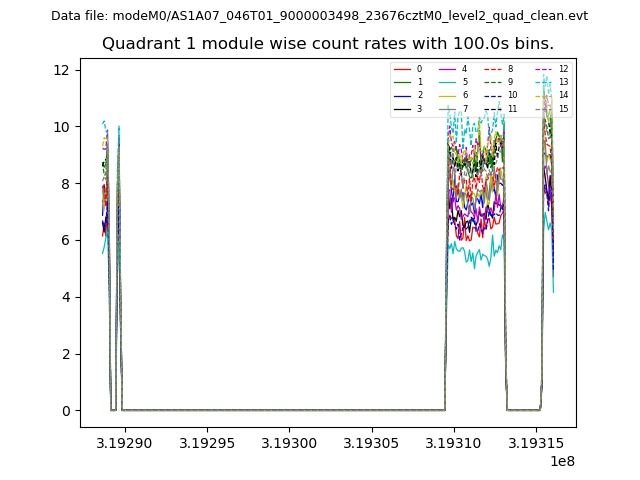
| Module-wise count rates for Quadrant A Data is divided into 100 sec bins |
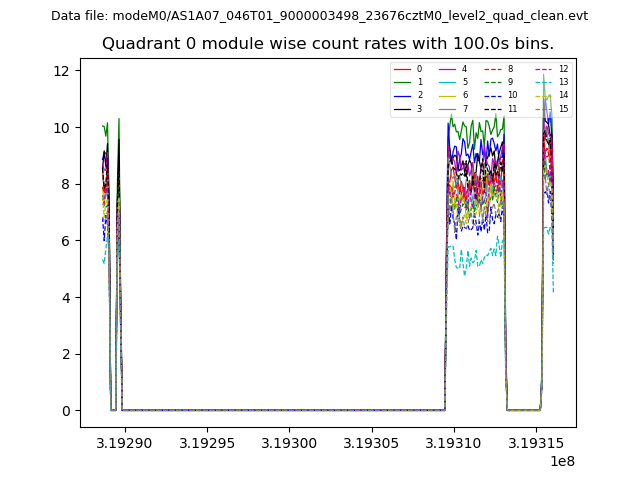 |
 |
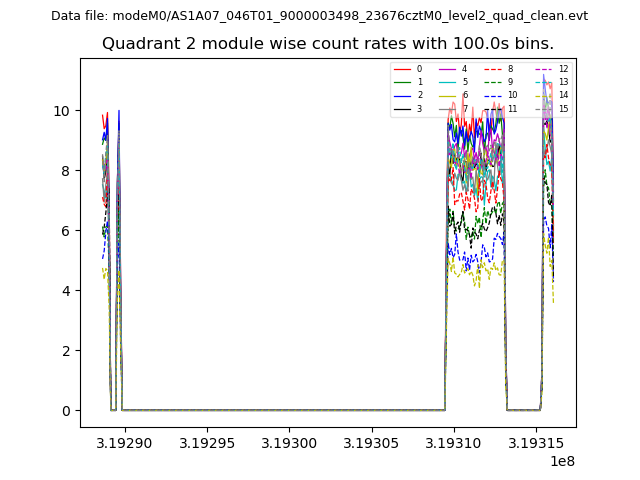
| Module-wise count rates for Quadrant B Data is divided into 100 sec bins |
 |
 |
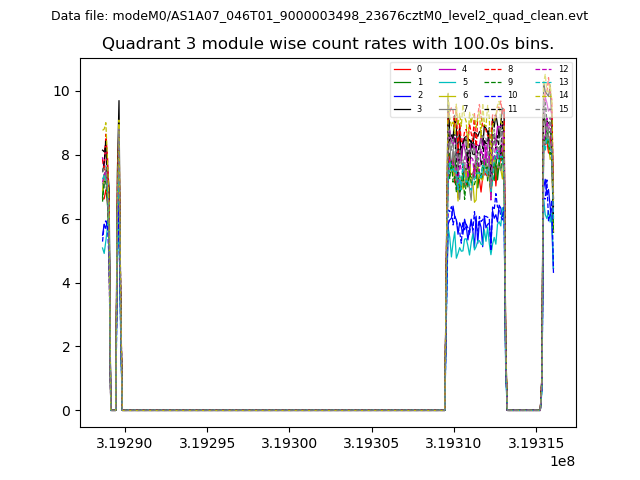
| Module-wise count rates for Quadrant C Data is divided into 100 sec bins |
 |
 |
| Module-wise count rates for Quadrant D Data is divided into 100 sec bins |
 |
 |
| Parameter | Plot |
|---|---|
| CZT HV Monitor | 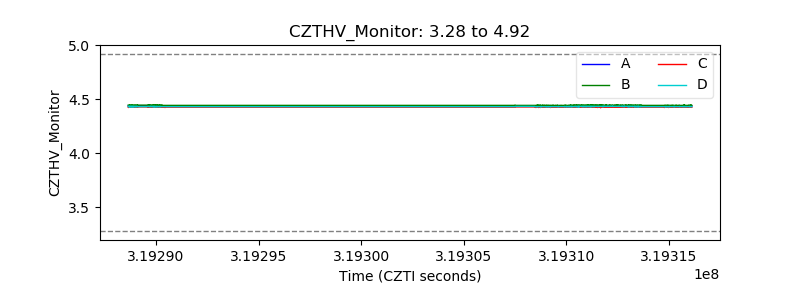 |
| D_VDD |  |
| Temperature 1 | 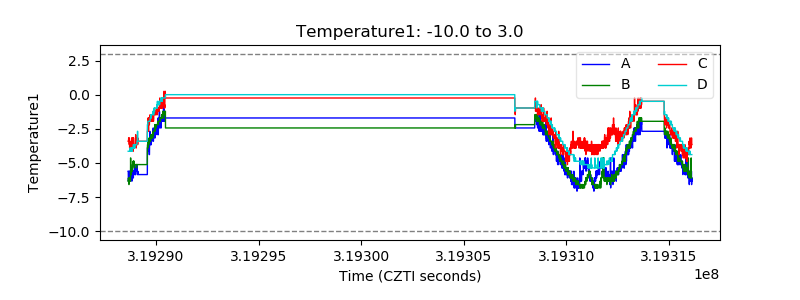 |
| Veto HV Monitor | 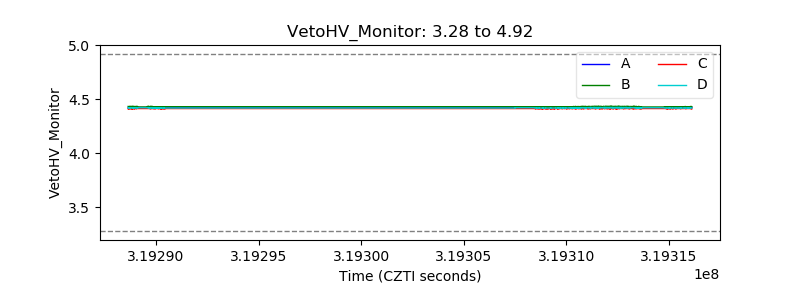 |
| Veto LLD | 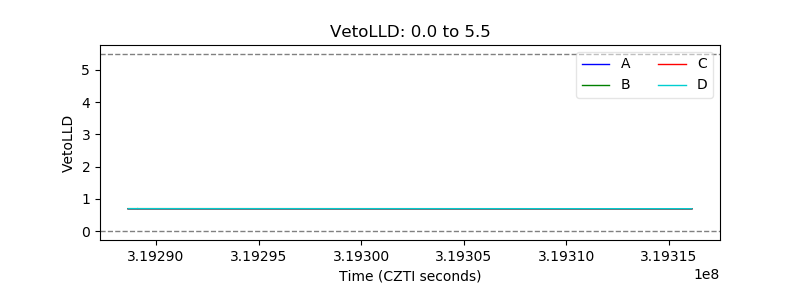 |
| Alpha Counter | 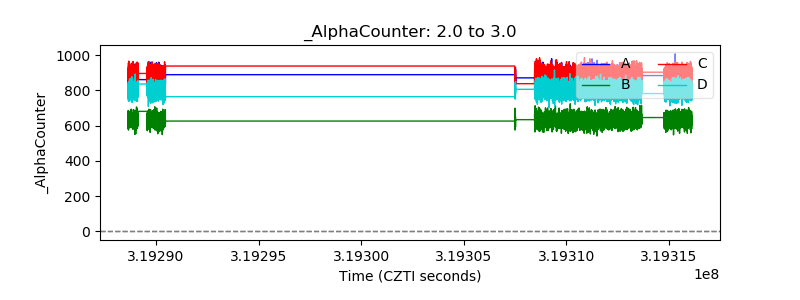 |
| _CPM_Rate |  |
| CZT Counter | 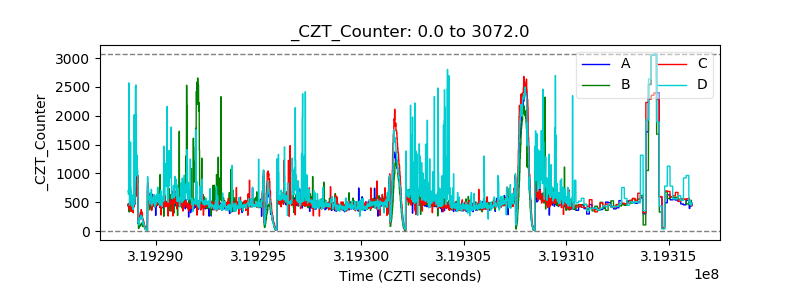 |
| +2.5 Volts monitor |  |
| +5 Volts monitor |  |
| _ROLL_ROT | 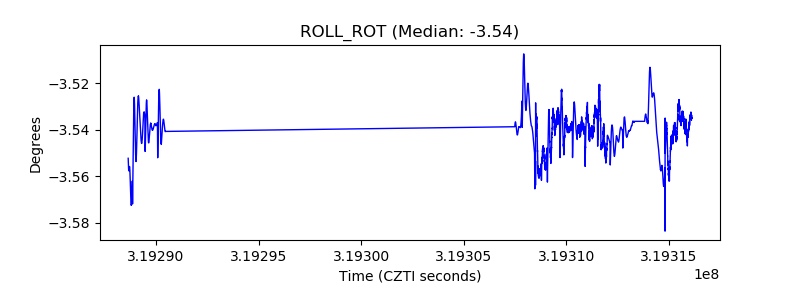 |
| _Roll_DEC | 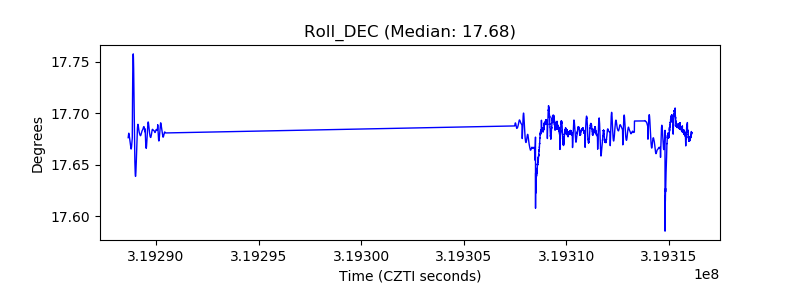 |
| _Roll_RA | 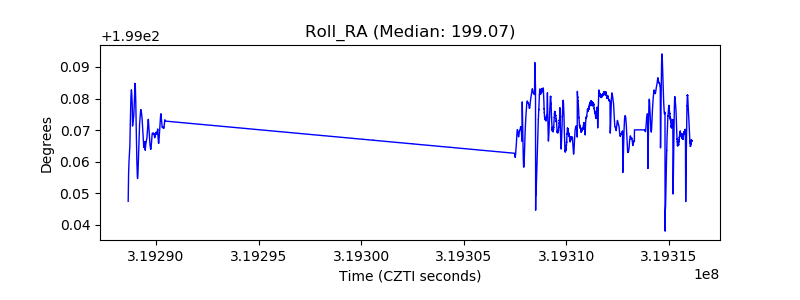 |
| Veto Counter | 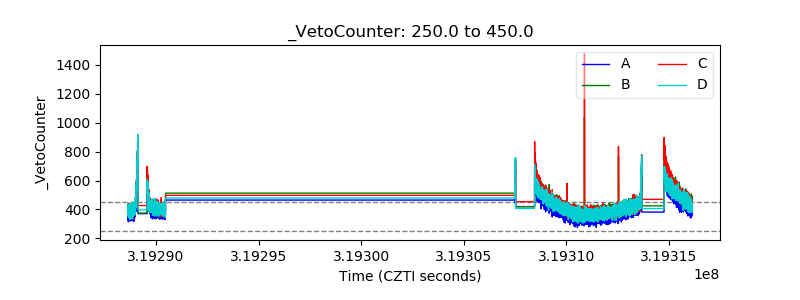 |