| Param | Original file | Final file |
|---|---|---|
| Filename | modeM0/AS1A07_046T01_9000003498_23680cztM0_level2.evt | modeM0/AS1A07_046T01_9000003498_23680cztM0_level2_quad_clean.evt |
| Size (bytes) | 384,451,200 | 85,078,080 |
| Size | 366.6 MB | 81.1 MB |
| Events in quadrant A | 2,477,783 | 562,376 |
| Events in quadrant B | 2,597,115 | 585,657 |
| Events in quadrant C | 2,557,599 | 553,769 |
| Events in quadrant D | 3,667,427 | 521,075 |
| Mode M0 | |||
|---|---|---|---|
| Quadrant | BADHDUFLAG | Total packets | Discarded packets |
| A | 0 | 10568 | 1 |
| B | 0 | 10887 | 1 |
| C | 0 | 10722 | 1 |
| D | 0 | 14443 | 1 |
| Mode SS | |||
|---|---|---|---|
| Quadrant | BADHDUFLAG | Total packets | Discarded packets |
| A | 0 | 104 | 0 |
| B | 0 | 104 | 0 |
| C | 0 | 104 | 0 |
| D | 0 | 104 | 0 |
| Mode M9 | |||
|---|---|---|---|
| Quadrant | BADHDUFLAG | Total packets | Discarded packets |
| A | 0 | 13 | 0 |
| B | 0 | 13 | 0 |
| C | 0 | 13 | 0 |
| D | 0 | 13 | 0 |
| Quadrant | Total seconds | Saturated seconds | Saturation percentage |
|---|---|---|---|
| A | 5040 | 27 | 0.535714% |
| B | 5040 | 40 | 0.793651% |
| C | 5040 | 51 | 1.011905% |
| D | 5040 | 355 | 7.043651% |
Noise dominated data is calculated using 1-second bins in cleaned event files. If a bin has >2000 counts, and if more than 50% of those come from <1% of pixels, then it is considered to be noise-dominated and hence unusable.
| Quadrant | # 1 sec bins | Bins with >0 counts | Bins with >2000 counts | High rate bins dominated by noise | Noise dominated (total time) | Noise dominated (detector-on time) | Marked lightcurve |
|---|---|---|---|---|---|---|---|
| A | 6330 | 5041 | 0 | 0 | 0.00% | 0.00% | 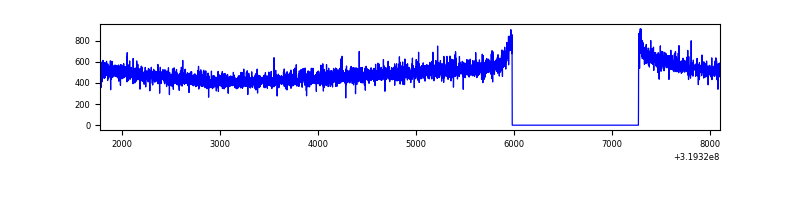 |
| B | 6330 | 5040 | 1 | 1 | 0.02% | 0.02% | 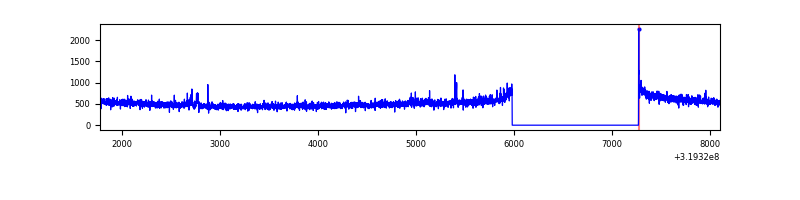 |
| C | 6330 | 5041 | 1 | 1 | 0.02% | 0.02% | 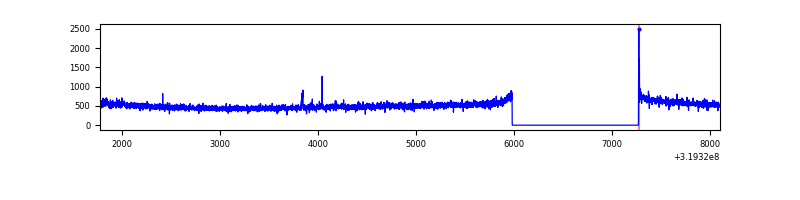 |
| D | 6330 | 5040 | 312 | 312 | 4.93% | 6.19% | 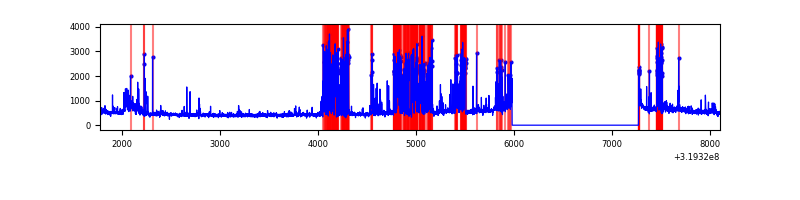 |
Top three noisy pixels from each quadrant. If the there are fewer than three noisy pixels in the level2.evt file, extra rows are filled as -1
| Pixel properties | Quadrant properties | ||||||
|---|---|---|---|---|---|---|---|
| Quadrant | DetID | PixID | Counts | Sigma | Mean | Median | Sigma |
| A | 13 | 254 | 8245 | 58.84 | 642 | 630 | 129.4 |
| A | 0 | 226 | 5597 | 38.38 | 642 | 630 | 129.4 |
| A | 3 | 137 | 5363 | 36.57 | 642 | 630 | 129.4 |
| B | 0 | 230 | 19771 | 155.68 | 649 | 635 | 122.9 |
| B | 12 | 111 | 14453 | 112.42 | 649 | 635 | 122.9 |
| B | 11 | 111 | 12790 | 98.89 | 649 | 635 | 122.9 |
| C | 14 | 238 | 98492 | 674.77 | 620 | 626 | 145.0 |
| C | 7 | 247 | 32734 | 221.38 | 620 | 626 | 145.0 |
| C | 0 | 10 | 6223 | 38.59 | 620 | 626 | 145.0 |
| D | 1 | 52 | 1257800 | 8392.32 | 608 | 590 | 149.8 |
| D | 12 | 235 | 29180 | 190.85 | 608 | 590 | 149.8 |
| D | 7 | 238 | 27561 | 180.04 | 608 | 590 | 149.8 |
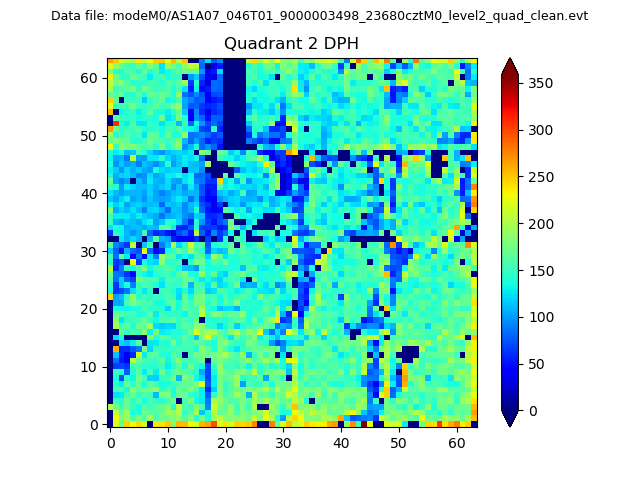
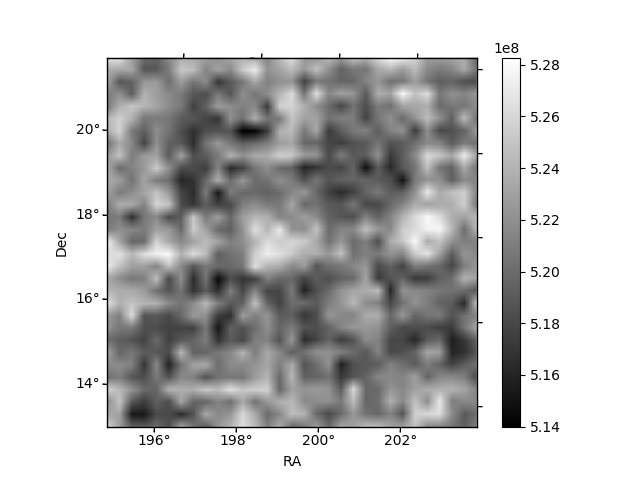
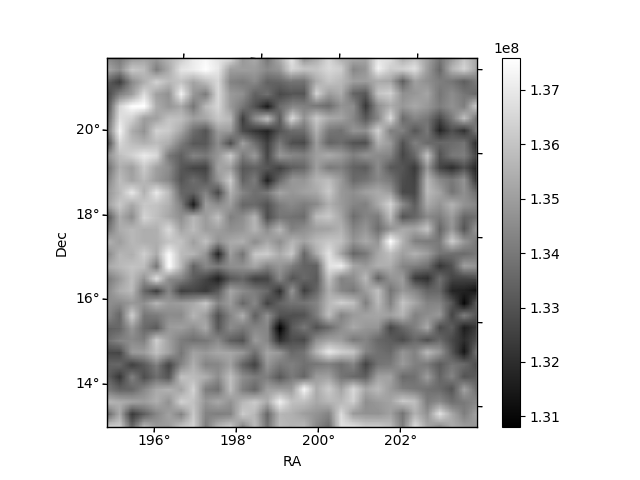
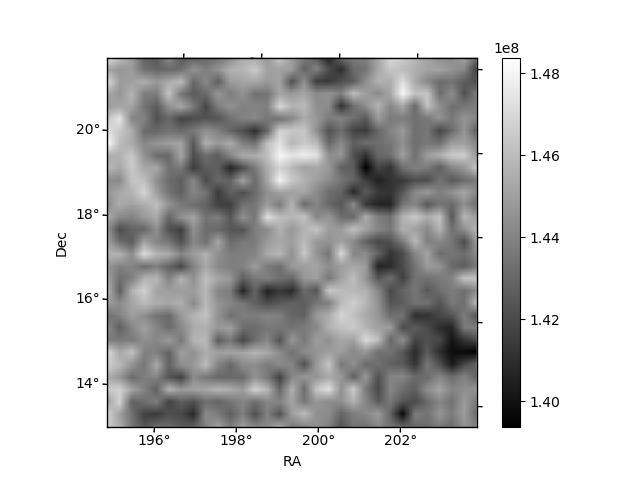
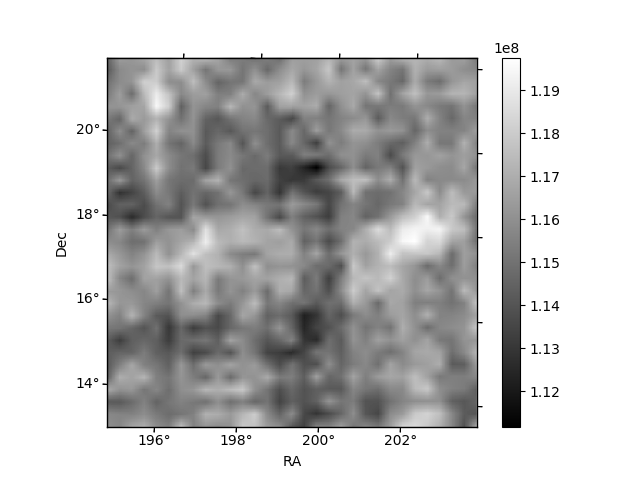
Histogram calculated using DETX and DETY for each event in the final _common_clean file
| Quadrant A | 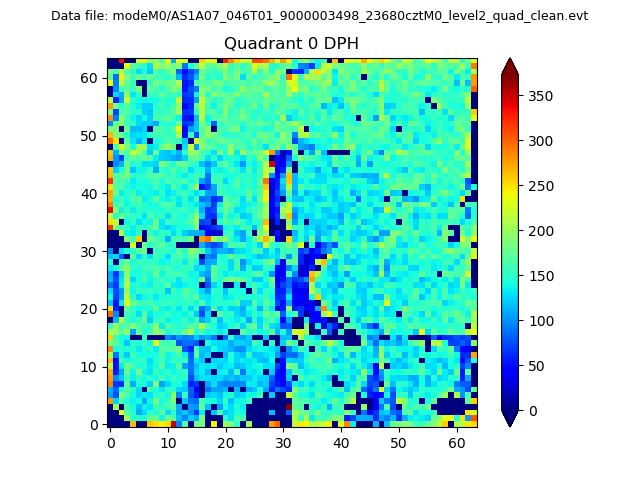 |
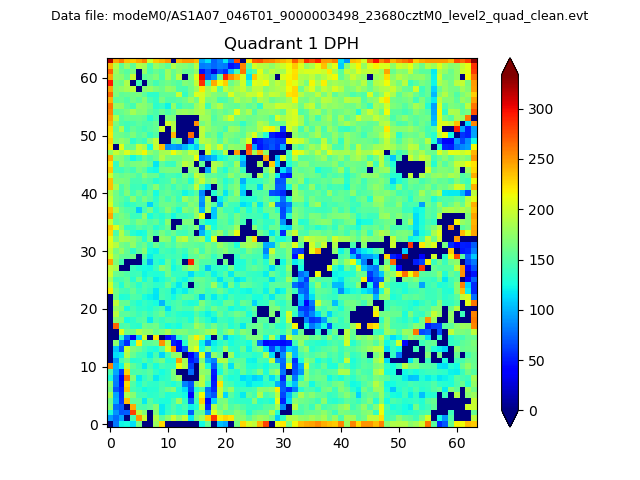 |
Quadrant B |
|---|---|---|---|
| Quadrant D | 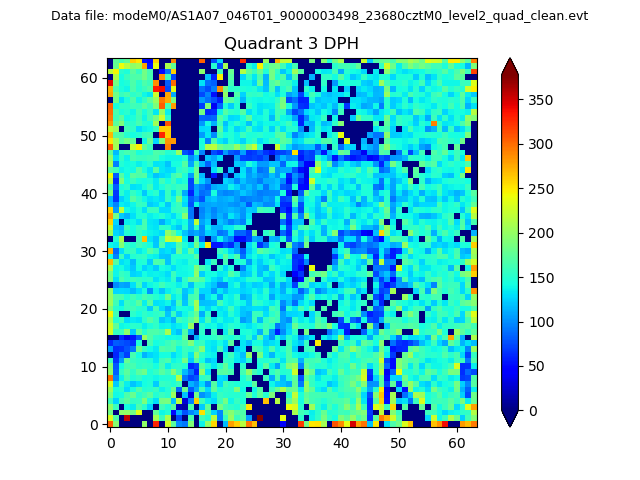 |
 |
Quadrant C |
| Plot type | Count rate plots | Images |
|---|---|---|
| Comparison with Poisson distribution Blue bars denote a histogram of data divided into 1 sec bins. Red curve is a Poisson curve with rate = median count rate of data. |
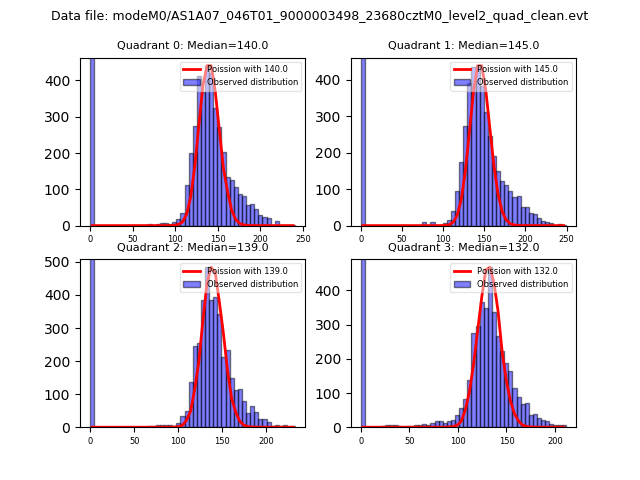 |
 |
| Quadrant-wise count rates Data is divided into 100 sec bins |
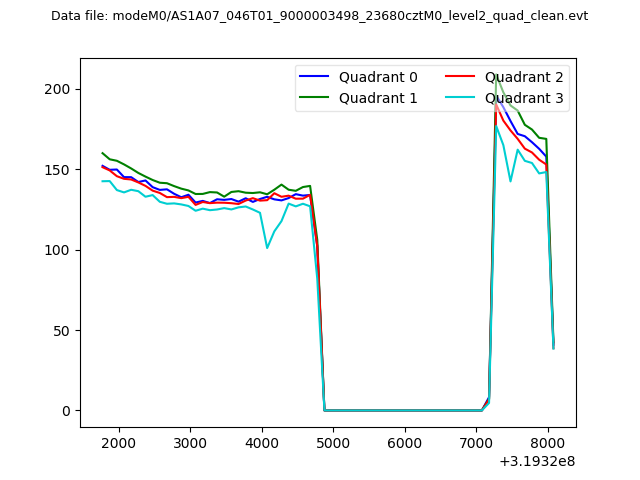 |
|
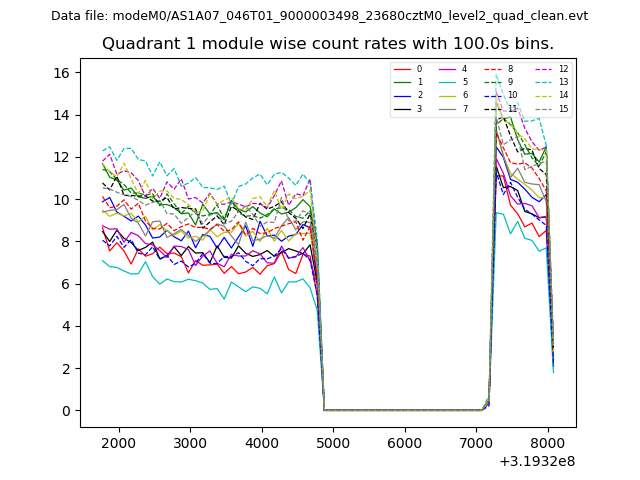
| Module-wise count rates for Quadrant A Data is divided into 100 sec bins |
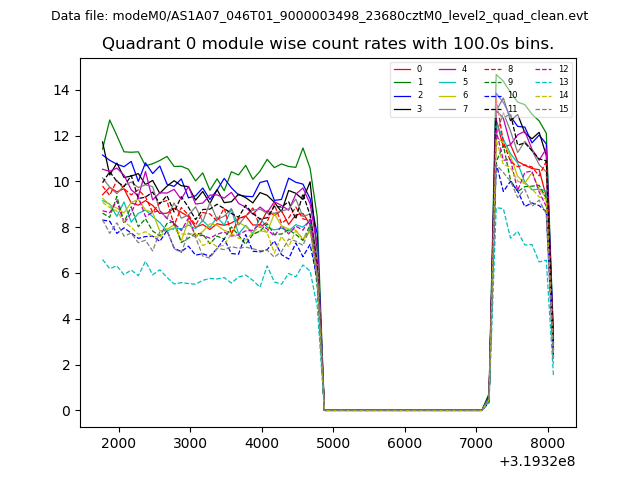 |
 |
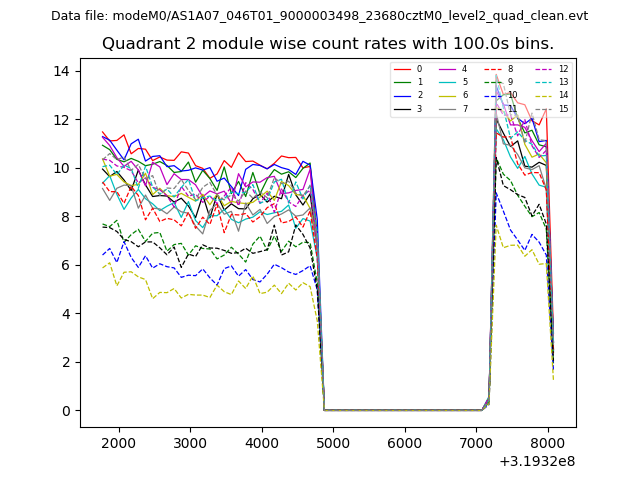
| Module-wise count rates for Quadrant B Data is divided into 100 sec bins |
 |
 |
| Module-wise count rates for Quadrant C Data is divided into 100 sec bins |
 |
 |
| Module-wise count rates for Quadrant D Data is divided into 100 sec bins |
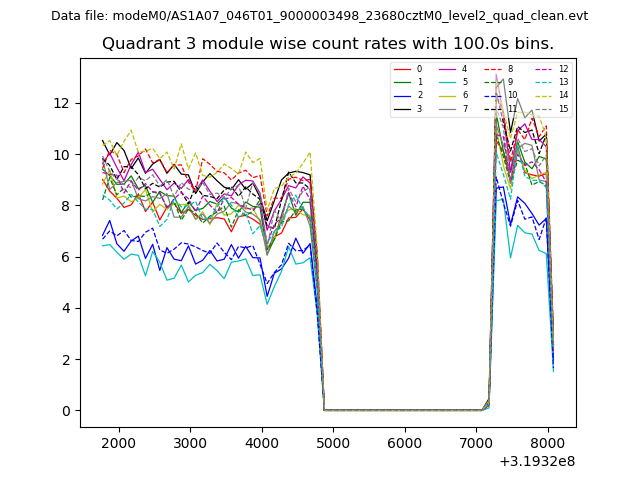 |
 |
| Parameter | Plot |
|---|---|
| CZT HV Monitor | 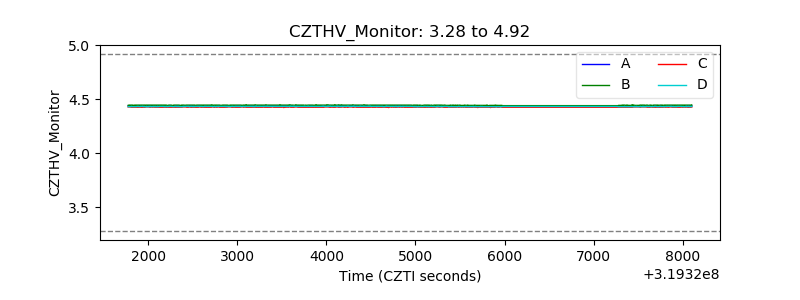 |
| D_VDD | 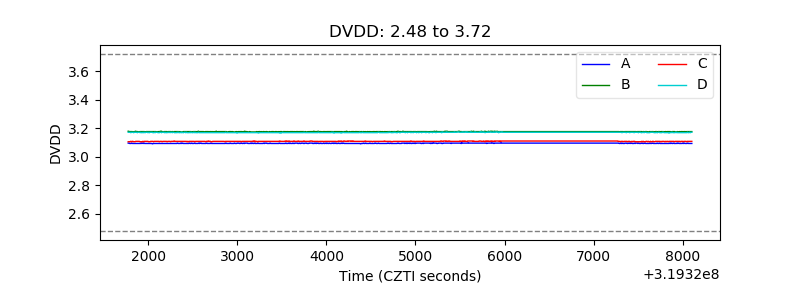 |
| Temperature 1 | 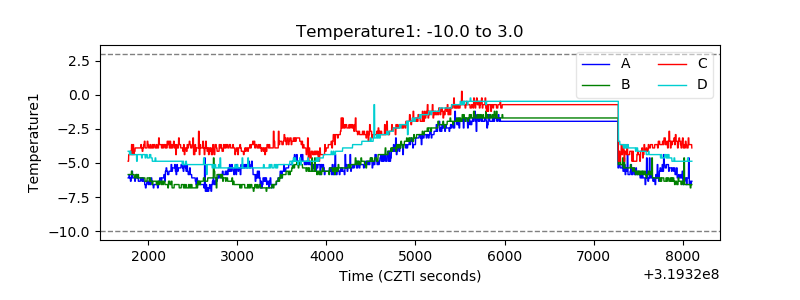 |
| Veto HV Monitor | 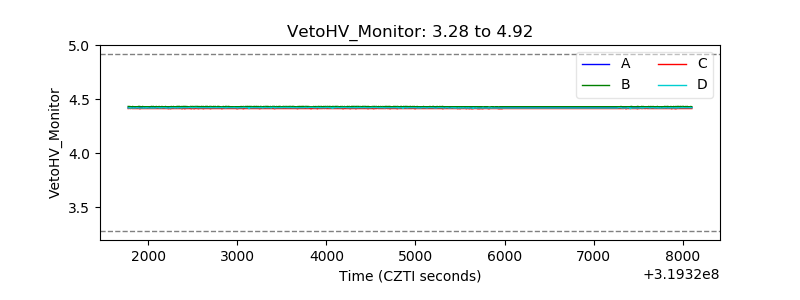 |
| Veto LLD | 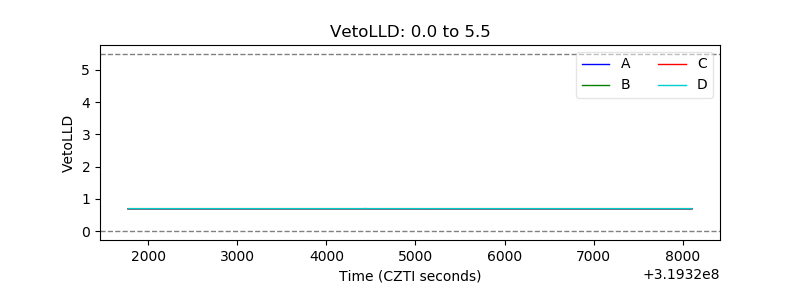 |
| Alpha Counter |  |
| _CPM_Rate | 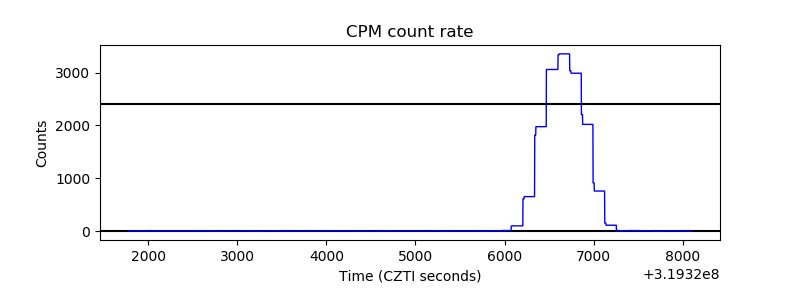 |
| CZT Counter | 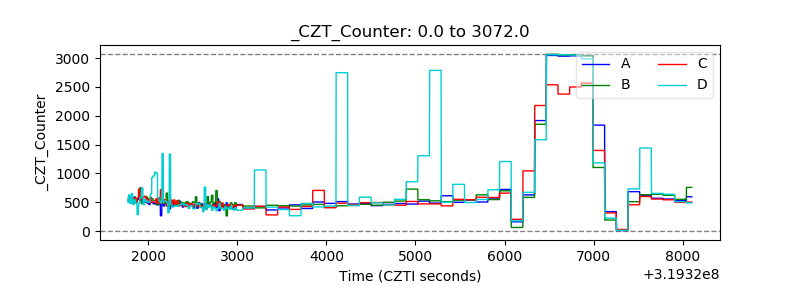 |
| +2.5 Volts monitor |  |
| +5 Volts monitor |  |
| _ROLL_ROT | 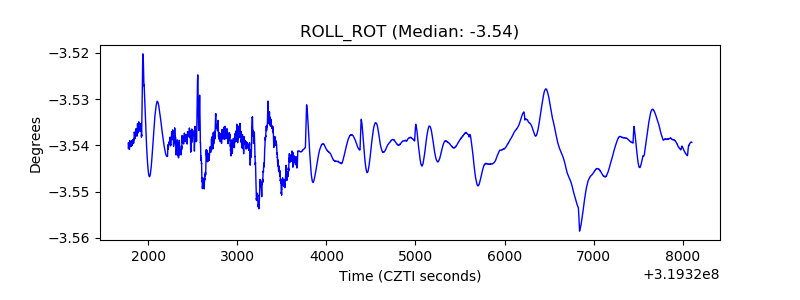 |
| _Roll_DEC | 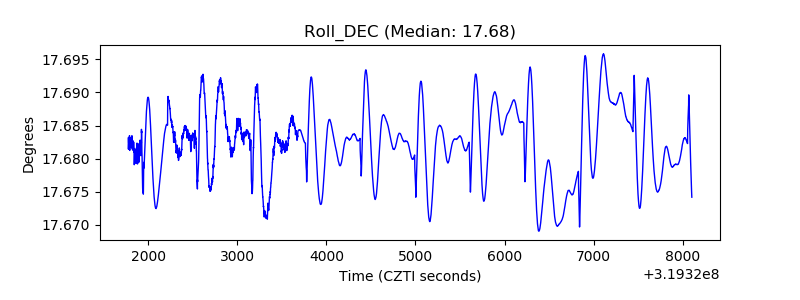 |
| _Roll_RA | 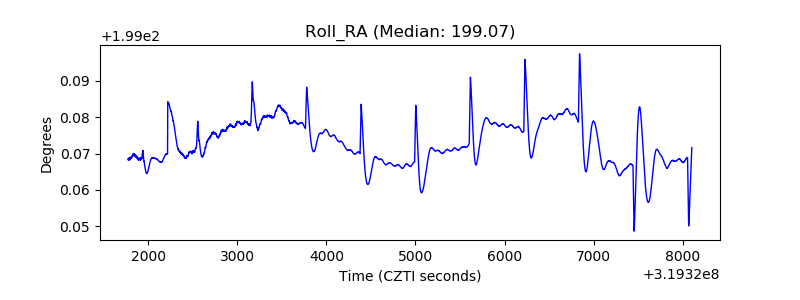 |
| Veto Counter | 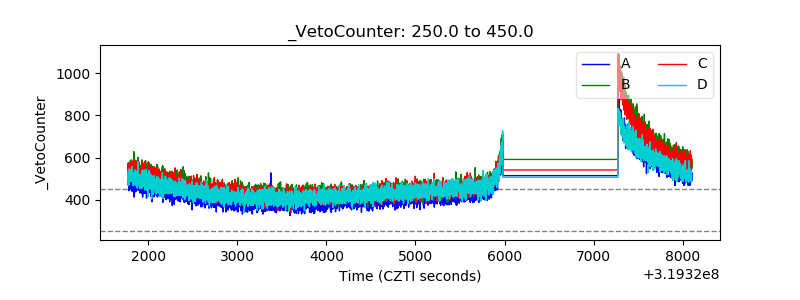 |