| Param | Original file | Final file |
|---|---|---|
| Filename | modeM0/AS1C05_012T03_9000003500_23686cztM0_level2.evt | modeM0/AS1C05_012T03_9000003500_23686cztM0_level2_quad_clean.evt |
| Size (bytes) | 458,352,000 | 105,399,360 |
| Size | 437.1 MB | 100.5 MB |
| Events in quadrant A | 3,104,609 | 686,588 |
| Events in quadrant B | 3,248,733 | 704,897 |
| Events in quadrant C | 3,126,451 | 674,285 |
| Events in quadrant D | 3,934,013 | 647,256 |
| Mode SS | |||
|---|---|---|---|
| Quadrant | BADHDUFLAG | Total packets | Discarded packets |
| A | 0 | 140 | 2 |
| B | 0 | 140 | 0 |
| C | 0 | 140 | 2 |
| D | 0 | 140 | 0 |
| Mode M9 | |||
|---|---|---|---|
| Quadrant | BADHDUFLAG | Total packets | Discarded packets |
| A | 0 | 3 | 0 |
| B | 0 | 3 | 0 |
| C | 0 | 3 | 0 |
| D | 0 | 3 | 0 |
| Mode M0 | |||
|---|---|---|---|
| Quadrant | BADHDUFLAG | Total packets | Discarded packets |
| A | 0 | 13956 | 9 |
| B | 0 | 14143 | 18 |
| C | 0 | 13977 | 23 |
| D | 0 | 16405 | 29 |
| Quadrant | Total seconds | Saturated seconds | Saturation percentage |
|---|---|---|---|
| A | 6880 | 100 | 1.453488% |
| B | 6876 | 94 | 1.367074% |
| C | 6874 | 104 | 1.512947% |
| D | 6875 | 239 | 3.476364% |
Noise dominated data is calculated using 1-second bins in cleaned event files. If a bin has >2000 counts, and if more than 50% of those come from <1% of pixels, then it is considered to be noise-dominated and hence unusable.
| Quadrant | # 1 sec bins | Bins with >0 counts | Bins with >2000 counts | High rate bins dominated by noise | Noise dominated (total time) | Noise dominated (detector-on time) | Marked lightcurve |
|---|---|---|---|---|---|---|---|
| A | 7203 | 6883 | 0 | 0 | 0.00% | 0.00% | 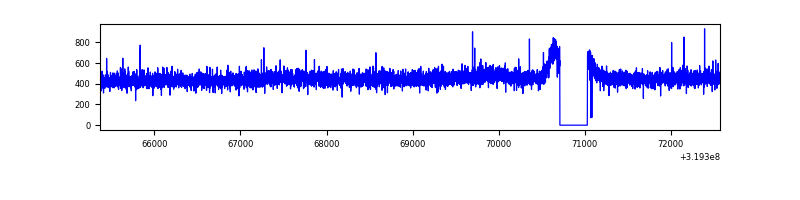 |
| B | 7203 | 6880 | 2 | 2 | 0.03% | 0.03% | 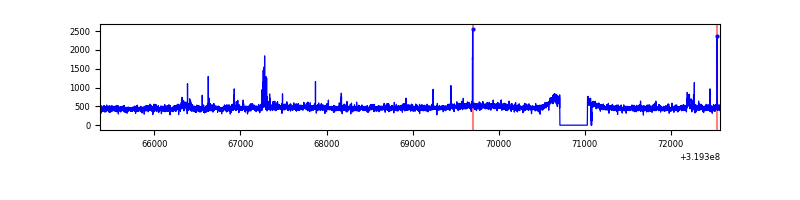 |
| C | 7203 | 6879 | 0 | 0 | 0.00% | 0.00% | 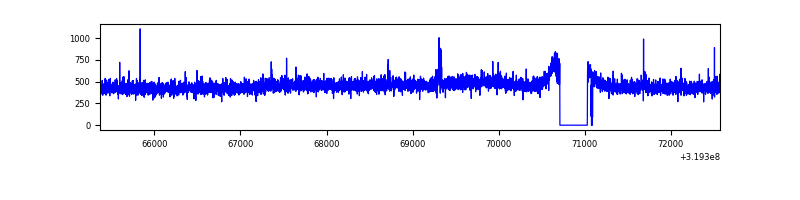 |
| D | 7204 | 6880 | 155 | 155 | 2.15% | 2.25% | 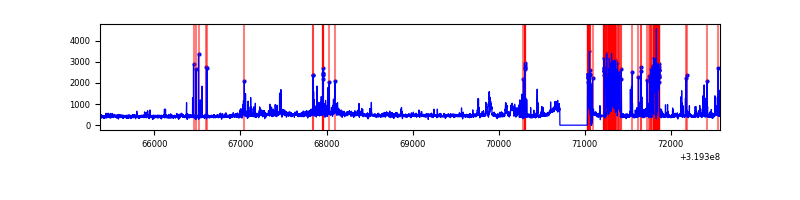 |
Top three noisy pixels from each quadrant. If the there are fewer than three noisy pixels in the level2.evt file, extra rows are filled as -1
| Pixel properties | Quadrant properties | ||||||
|---|---|---|---|---|---|---|---|
| Quadrant | DetID | PixID | Counts | Sigma | Mean | Median | Sigma |
| A | 13 | 254 | 12337 | 70.34 | 804 | 786 | 164.2 |
| A | 3 | 137 | 7321 | 39.79 | 804 | 786 | 164.2 |
| A | 0 | 226 | 7061 | 38.21 | 804 | 786 | 164.2 |
| B | 15 | 33 | 29531 | 188.3 | 800 | 778 | 152.7 |
| B | 0 | 189 | 26486 | 168.36 | 800 | 778 | 152.7 |
| B | 0 | 229 | 18690 | 117.31 | 800 | 778 | 152.7 |
| C | 14 | 238 | 122968 | 681.28 | 764 | 767 | 179.4 |
| C | 9 | 54 | 8111 | 40.94 | 764 | 767 | 179.4 |
| C | 3 | 233 | 7518 | 37.64 | 764 | 767 | 179.4 |
| D | 1 | 52 | 843953 | 4480.98 | 767 | 744 | 188.2 |
| D | 12 | 233 | 84894 | 447.19 | 767 | 744 | 188.2 |
| D | 8 | 195 | 53847 | 282.2 | 767 | 744 | 188.2 |
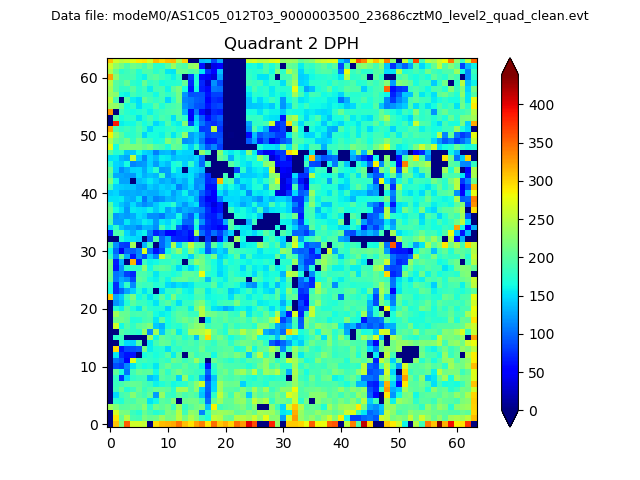
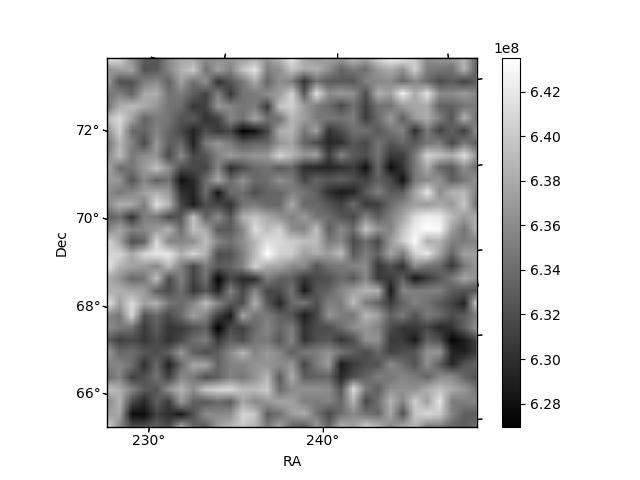
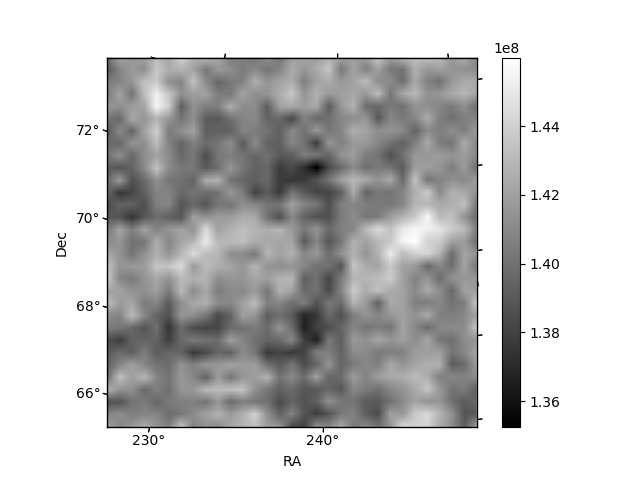
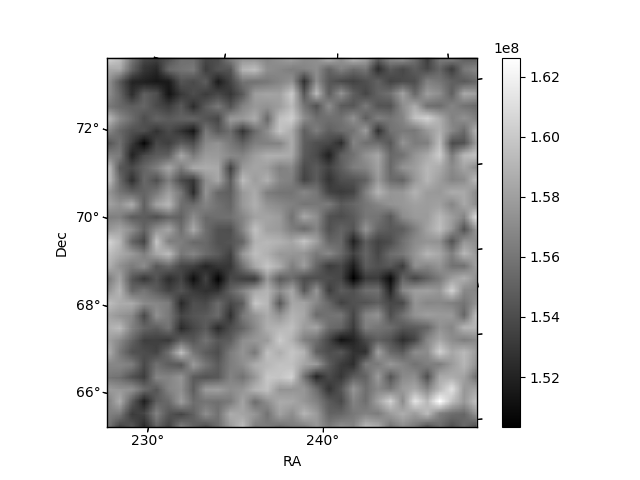
Histogram calculated using DETX and DETY for each event in the final _common_clean file
| Quadrant A | 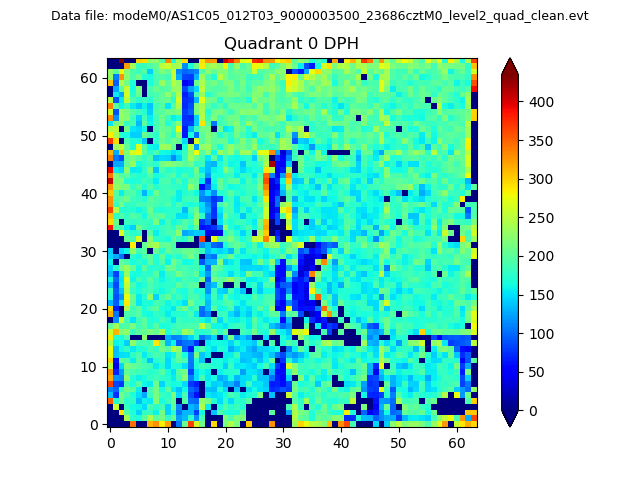 |
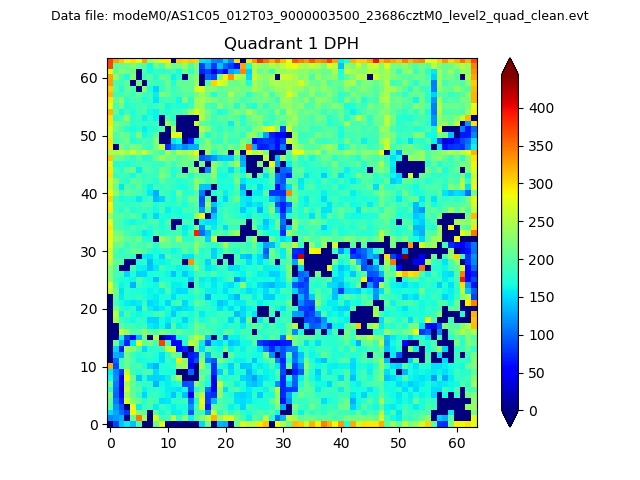 |
Quadrant B |
|---|---|---|---|
| Quadrant D | 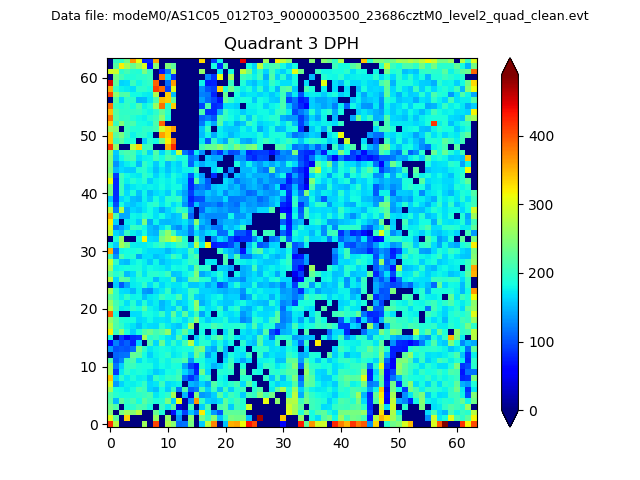 |
 |
Quadrant C |
| Plot type | Count rate plots | Images |
|---|---|---|
| Comparison with Poisson distribution Blue bars denote a histogram of data divided into 1 sec bins. Red curve is a Poisson curve with rate = median count rate of data. |
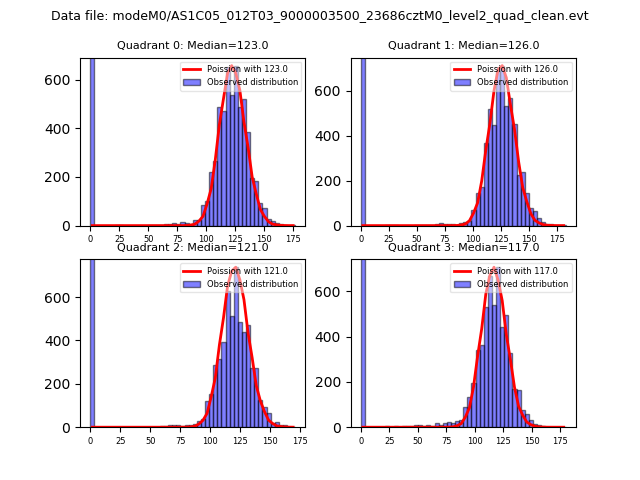 |
 |
| Quadrant-wise count rates Data is divided into 100 sec bins |
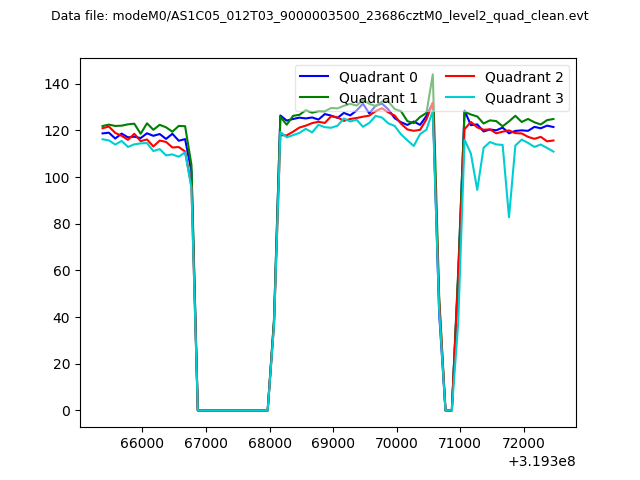 |
|
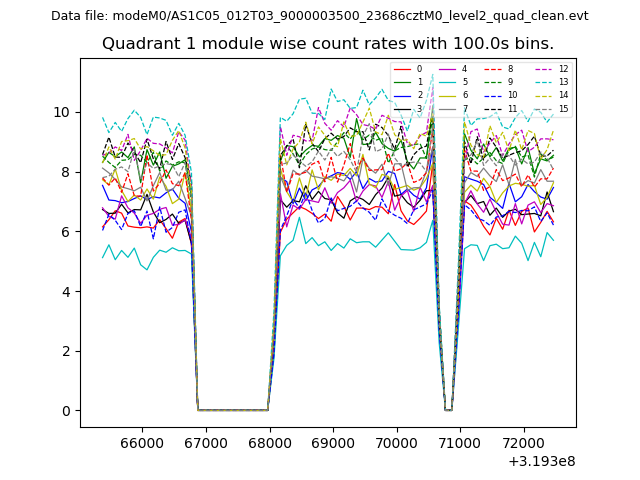
| Module-wise count rates for Quadrant A Data is divided into 100 sec bins |
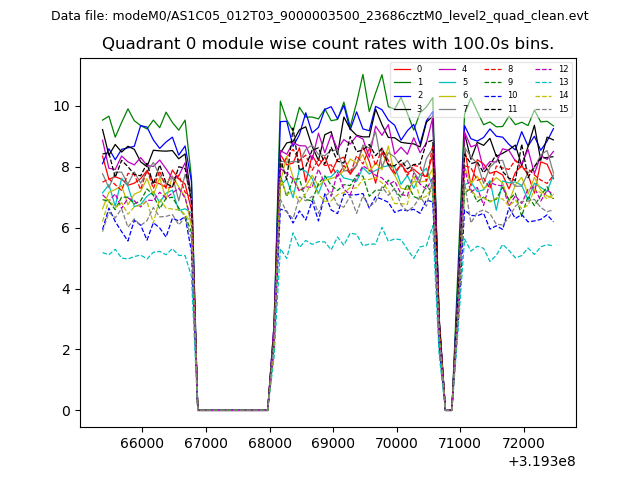 |
 |
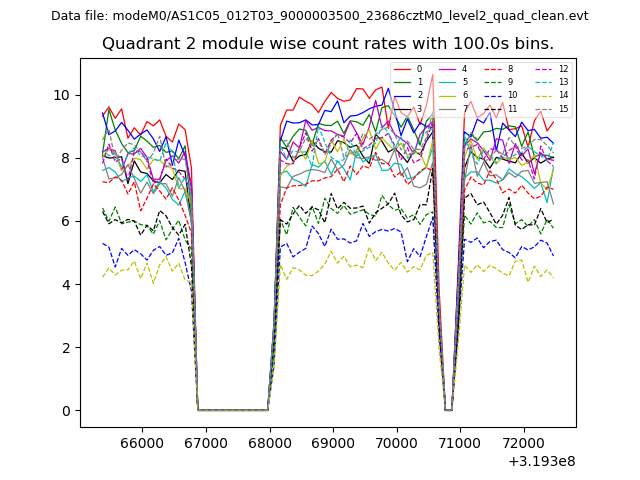
| Module-wise count rates for Quadrant B Data is divided into 100 sec bins |
 |
 |
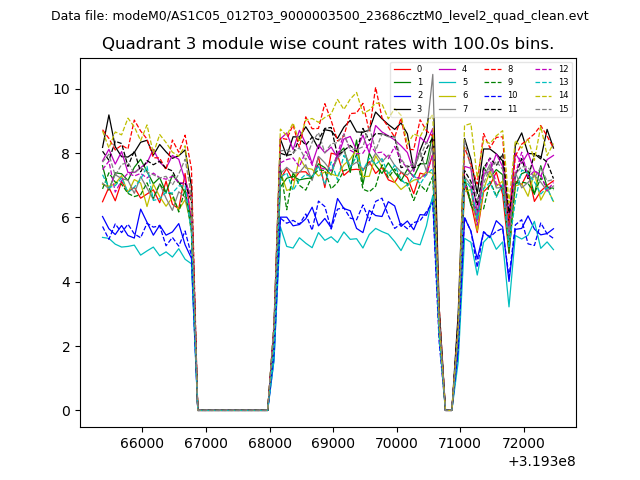
| Module-wise count rates for Quadrant C Data is divided into 100 sec bins |
 |
 |
| Module-wise count rates for Quadrant D Data is divided into 100 sec bins |
 |
 |
| Parameter | Plot |
|---|---|
| CZT HV Monitor | 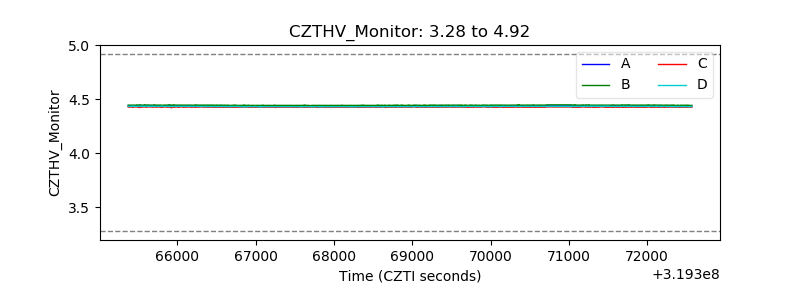 |
| D_VDD | 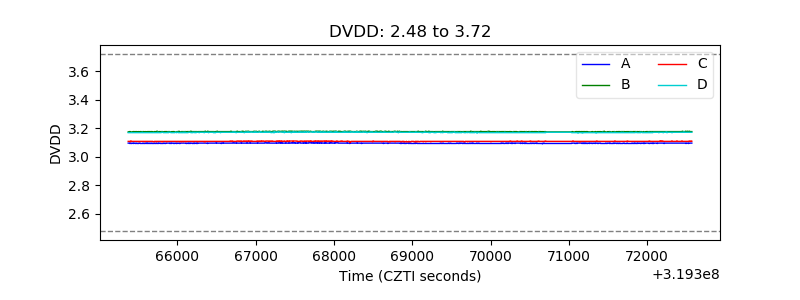 |
| Temperature 1 | 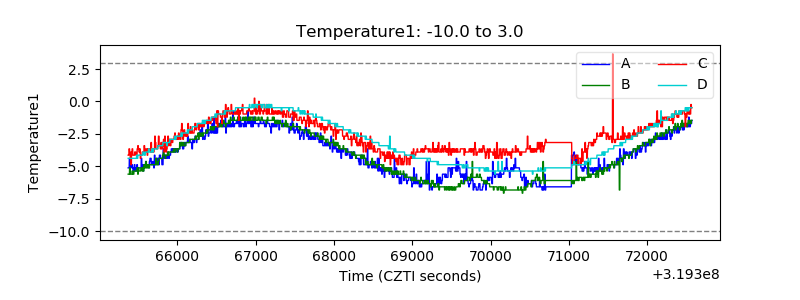 |
| Veto HV Monitor | 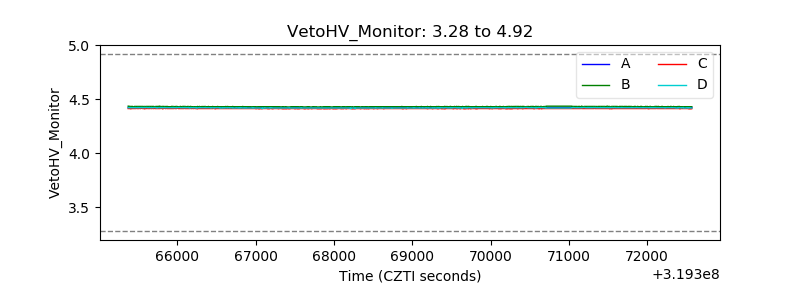 |
| Veto LLD | 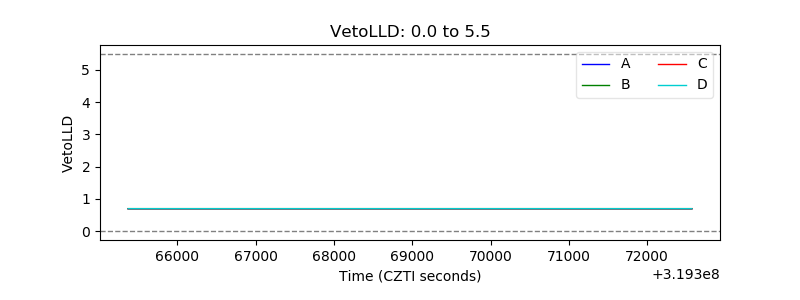 |
| Alpha Counter | 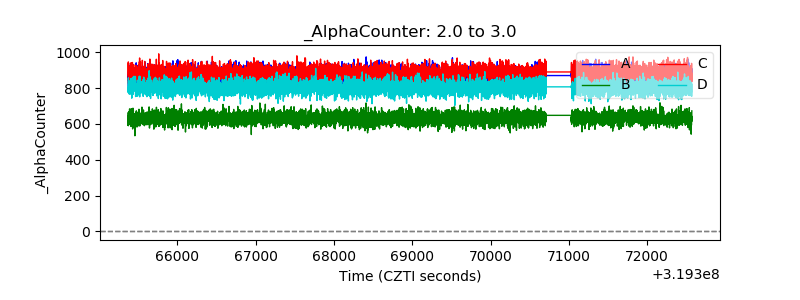 |
| _CPM_Rate | 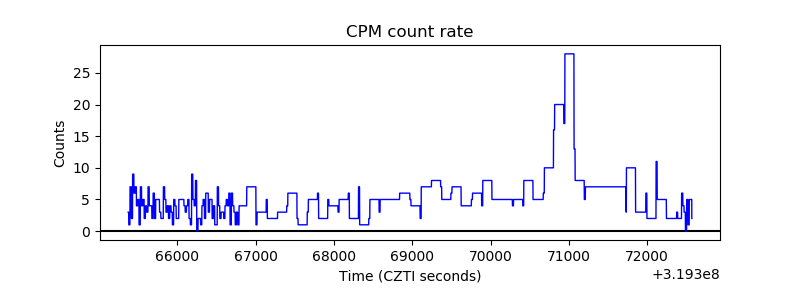 |
| CZT Counter | 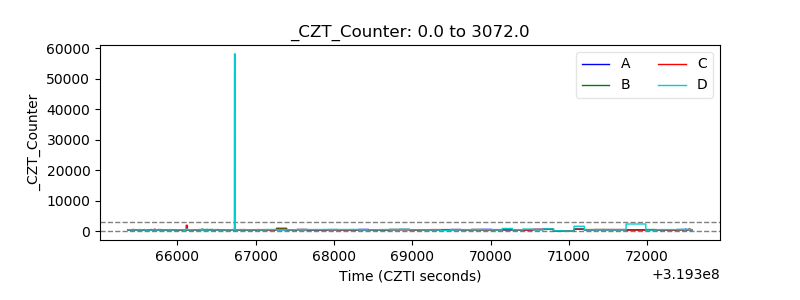 |
| +2.5 Volts monitor |  |
| +5 Volts monitor |  |
| _ROLL_ROT | 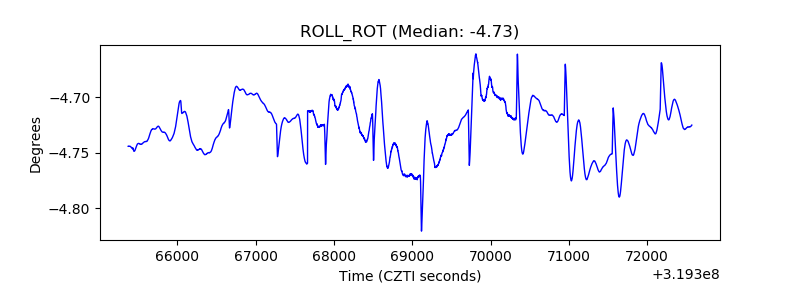 |
| _Roll_DEC | 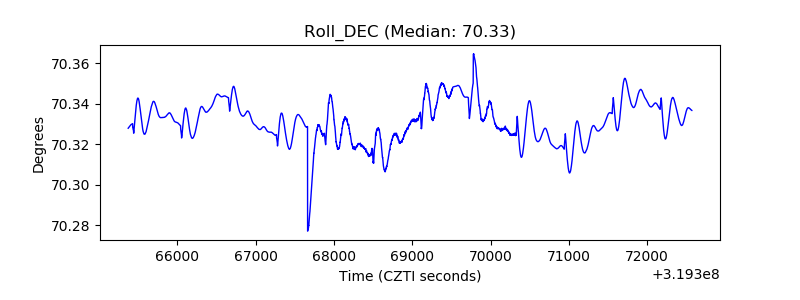 |
| _Roll_RA | 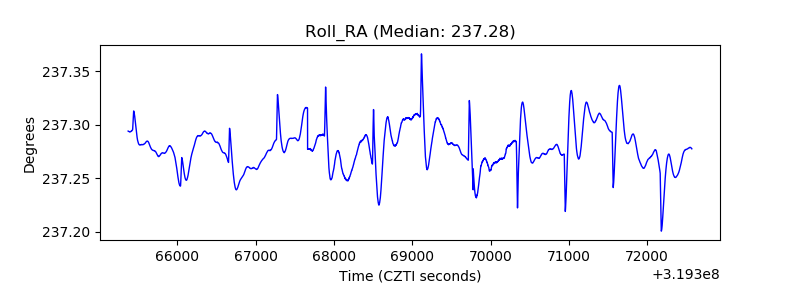 |
| Veto Counter | 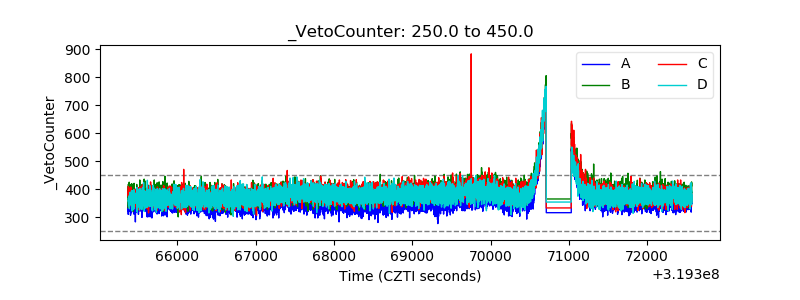 |