| Param | Original file | Final file |
|---|---|---|
| Filename | modeM0/AS1C05_012T03_9000003500_23692cztM0_level2.evt | modeM0/AS1C05_012T03_9000003500_23692cztM0_level2_quad_clean.evt |
| Size (bytes) | 569,992,320 | 94,262,400 |
| Size | 543.6 MB | 89.9 MB |
| Events in quadrant A | 2,994,816 | 615,884 |
| Events in quadrant B | 3,185,680 | 630,165 |
| Events in quadrant C | 3,165,797 | 611,162 |
| Events in quadrant D | 7,493,494 | 561,759 |
| Mode SS | |||
|---|---|---|---|
| Quadrant | BADHDUFLAG | Total packets | Discarded packets |
| A | 0 | 126 | 0 |
| B | 0 | 126 | 0 |
| C | 0 | 126 | 0 |
| D | 0 | 126 | 0 |
| Mode M9 | |||
|---|---|---|---|
| Quadrant | BADHDUFLAG | Total packets | Discarded packets |
| A | 0 | 12 | 0 |
| B | 0 | 12 | 0 |
| C | 0 | 12 | 0 |
| D | 0 | 12 | 0 |
| Mode M0 | |||
|---|---|---|---|
| Quadrant | BADHDUFLAG | Total packets | Discarded packets |
| A | 0 | 13151 | 1 |
| B | 0 | 13659 | 1 |
| C | 0 | 13553 | 1 |
| D | 0 | 26680 | 3 |
| Quadrant | Total seconds | Saturated seconds | Saturation percentage |
|---|---|---|---|
| A | 6243 | 36 | 0.576646% |
| B | 6244 | 58 | 0.928892% |
| C | 6244 | 94 | 1.505445% |
| D | 6243 | 945 | 15.136953% |
Noise dominated data is calculated using 1-second bins in cleaned event files. If a bin has >2000 counts, and if more than 50% of those come from <1% of pixels, then it is considered to be noise-dominated and hence unusable.
| Quadrant | # 1 sec bins | Bins with >0 counts | Bins with >2000 counts | High rate bins dominated by noise | Noise dominated (total time) | Noise dominated (detector-on time) | Marked lightcurve |
|---|---|---|---|---|---|---|---|
| A | 7378 | 6244 | 0 | 0 | 0.00% | 0.00% | 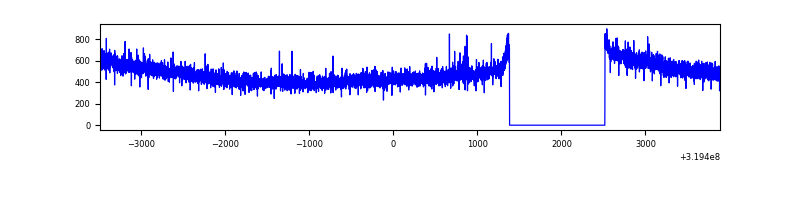 |
| B | 7379 | 6244 | 3 | 3 | 0.04% | 0.05% |  |
| C | 7379 | 6244 | 0 | 0 | 0.00% | 0.00% |  |
| D | 7377 | 6242 | 774 | 774 | 10.49% | 12.40% | 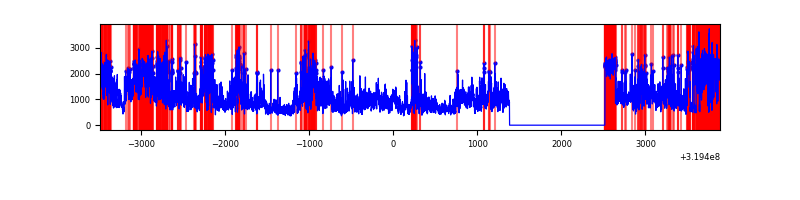 |
Top three noisy pixels from each quadrant. If the there are fewer than three noisy pixels in the level2.evt file, extra rows are filled as -1
| Pixel properties | Quadrant properties | ||||||
|---|---|---|---|---|---|---|---|
| Quadrant | DetID | PixID | Counts | Sigma | Mean | Median | Sigma |
| A | 13 | 254 | 10048 | 59.44 | 775 | 759 | 156.3 |
| A | 0 | 226 | 6631 | 37.58 | 775 | 759 | 156.3 |
| A | 3 | 137 | 6572 | 37.2 | 775 | 759 | 156.3 |
| B | 0 | 245 | 41945 | 278.8 | 777 | 758 | 147.7 |
| B | 0 | 183 | 28749 | 189.48 | 777 | 758 | 147.7 |
| B | 0 | 189 | 22405 | 146.53 | 777 | 758 | 147.7 |
| C | 14 | 238 | 120535 | 680.12 | 759 | 765 | 176.1 |
| C | 7 | 247 | 58287 | 326.64 | 759 | 765 | 176.1 |
| C | 1 | 16 | 22513 | 123.5 | 759 | 765 | 176.1 |
| D | 13 | 174 | 3855060 | 22365.59 | 720 | 702 | 172.3 |
| D | 1 | 52 | 795314 | 4610.87 | 720 | 702 | 172.3 |
| D | 9 | 35 | 40086 | 228.53 | 720 | 702 | 172.3 |
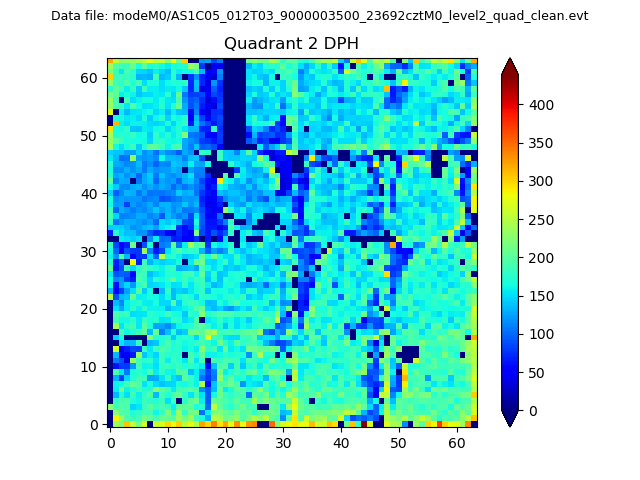
Histogram calculated using DETX and DETY for each event in the final _common_clean file
| Quadrant A | 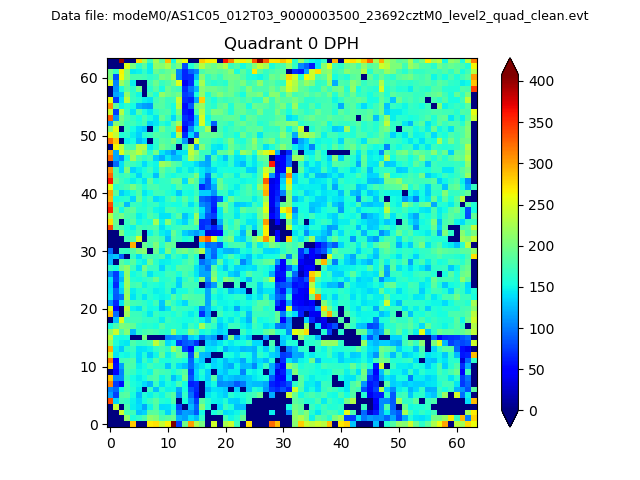 |
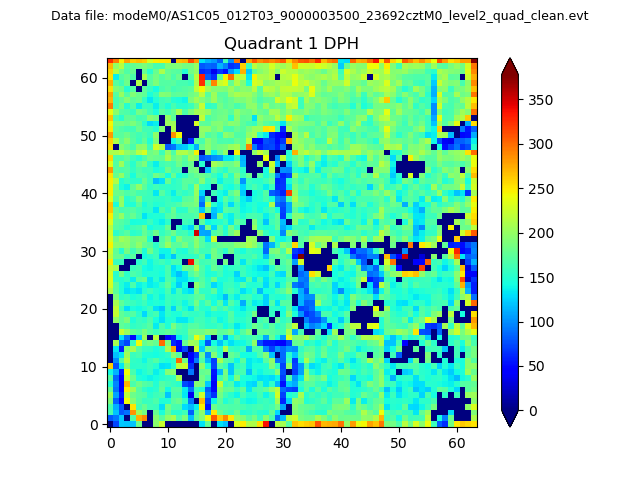 |
Quadrant B |
|---|---|---|---|
| Quadrant D | 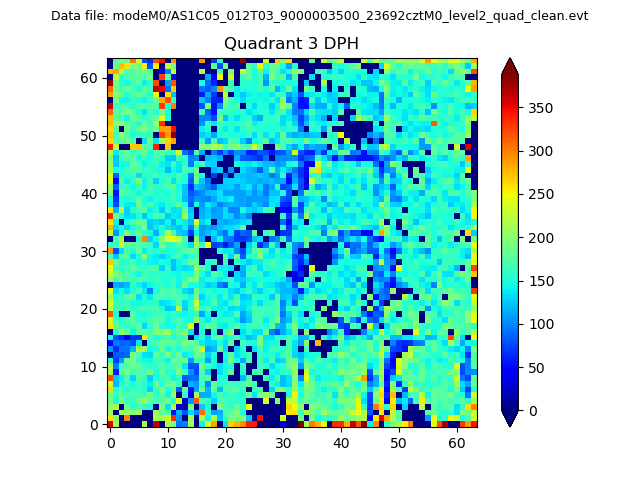 |
 |
Quadrant C |
| Plot type | Count rate plots | Images |
|---|---|---|
| Comparison with Poisson distribution Blue bars denote a histogram of data divided into 1 sec bins. Red curve is a Poisson curve with rate = median count rate of data. |
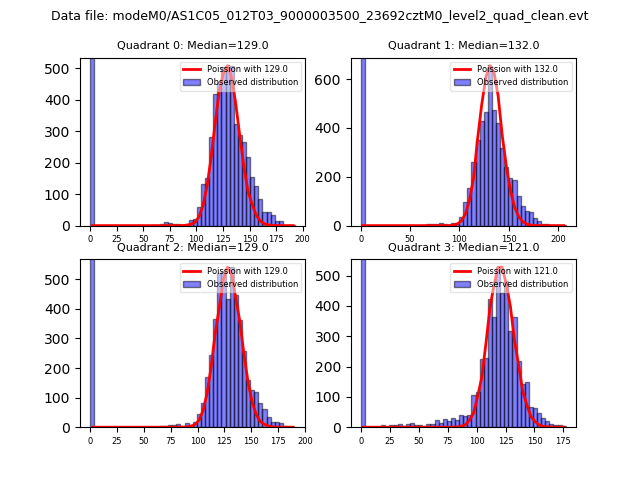 |
 |
| Quadrant-wise count rates Data is divided into 100 sec bins |
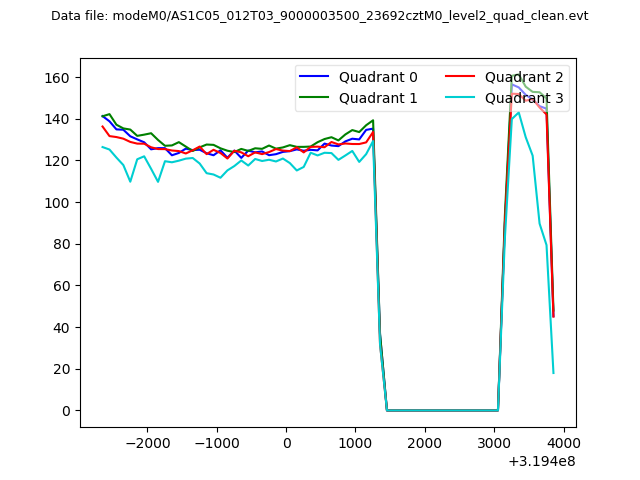 |
|
| Module-wise count rates for Quadrant A Data is divided into 100 sec bins |
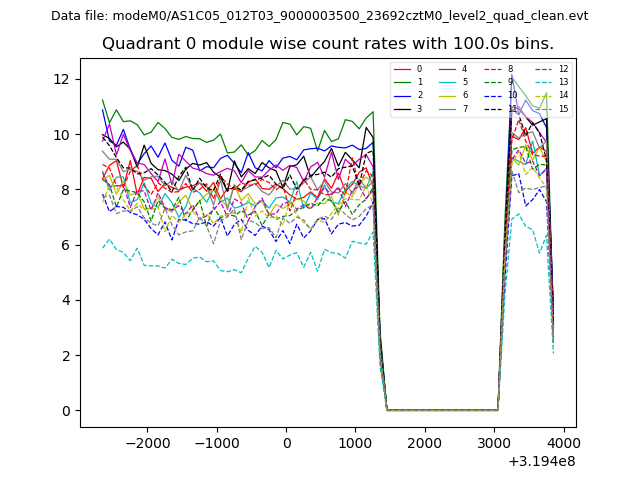 |
 |
| Module-wise count rates for Quadrant B Data is divided into 100 sec bins |
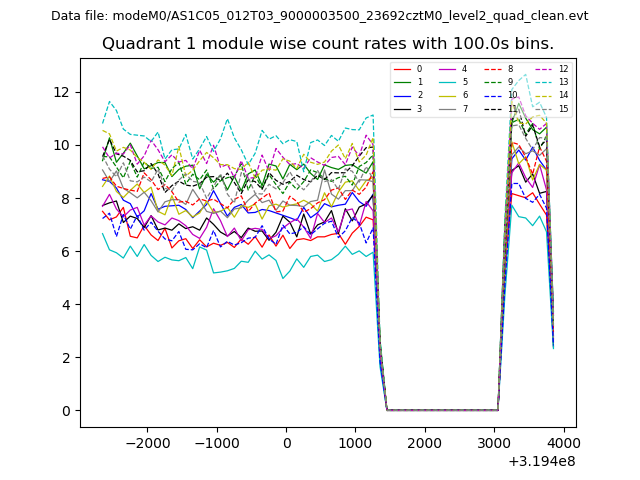 |
 |
| Module-wise count rates for Quadrant C Data is divided into 100 sec bins |
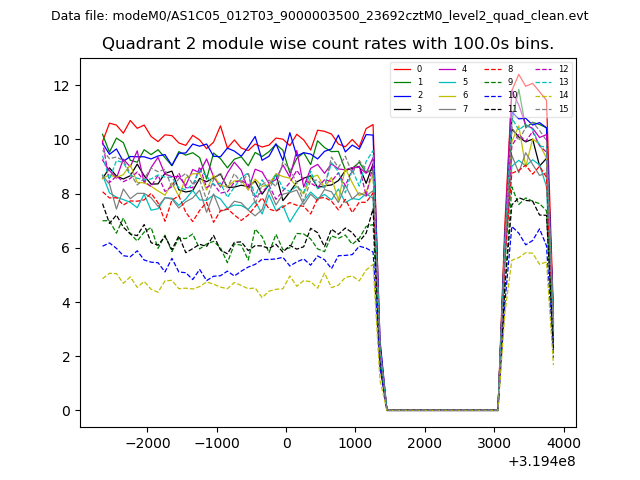 |
 |
| Module-wise count rates for Quadrant D Data is divided into 100 sec bins |
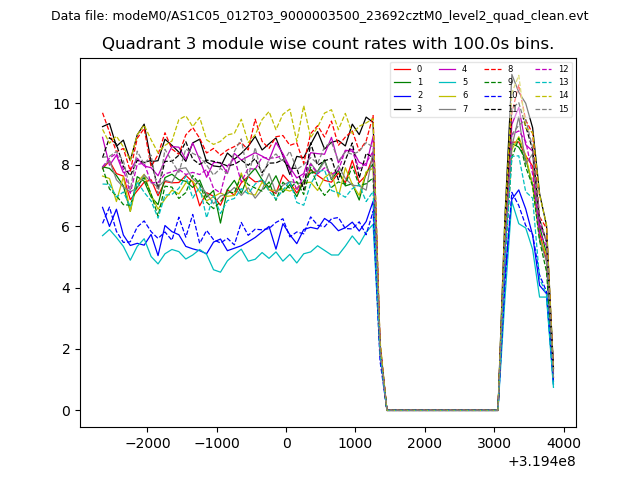 |
 |
| Parameter | Plot |
|---|---|
| CZT HV Monitor | 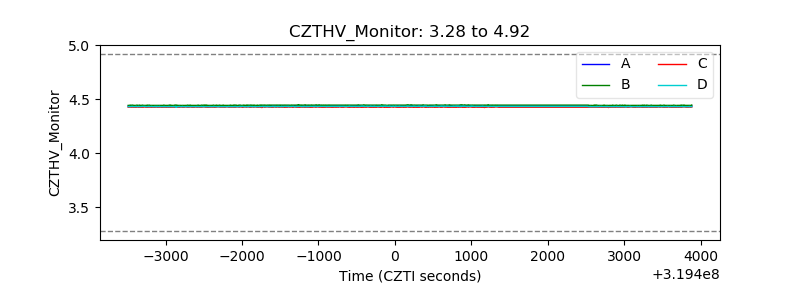 |
| D_VDD | 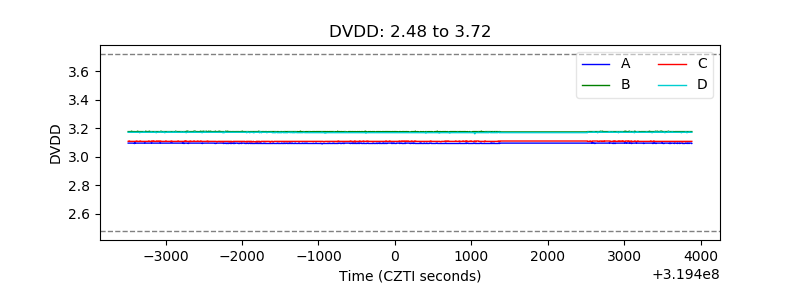 |
| Temperature 1 | 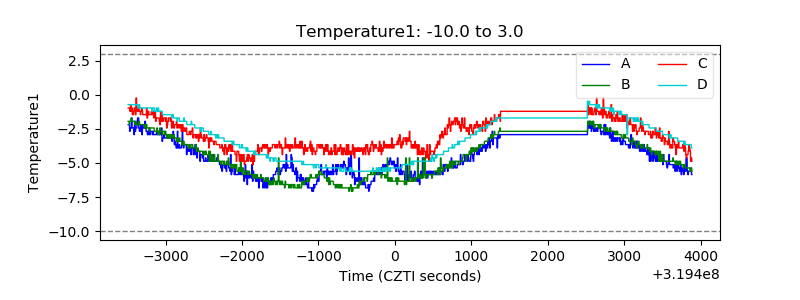 |
| Veto HV Monitor | 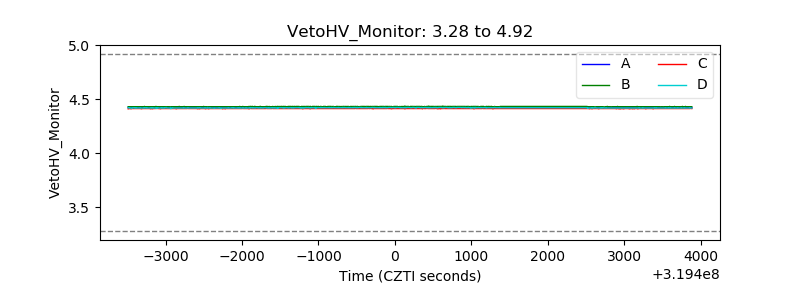 |
| Veto LLD | 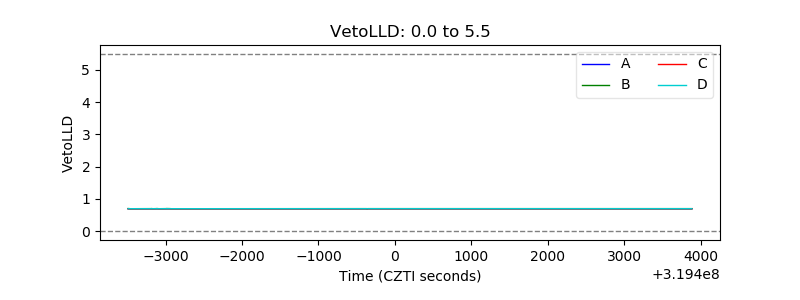 |
| Alpha Counter | 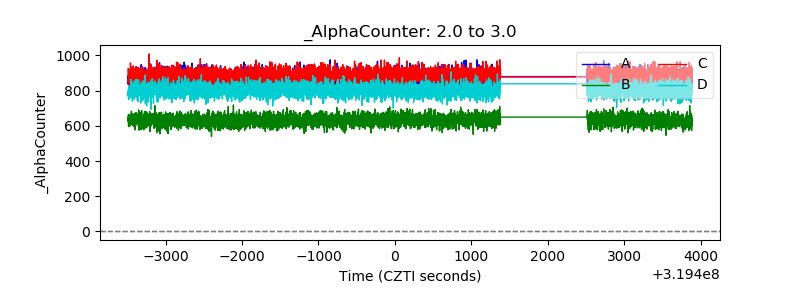 |
| _CPM_Rate | 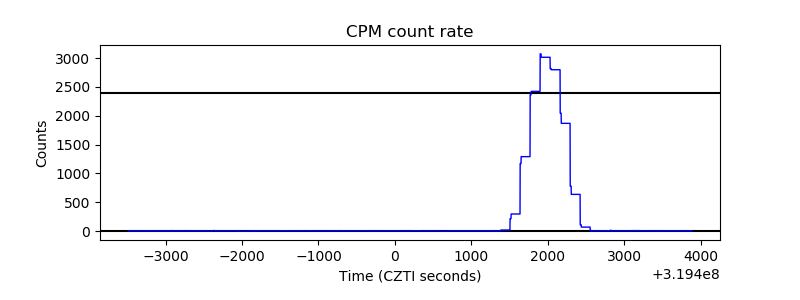 |
| CZT Counter | 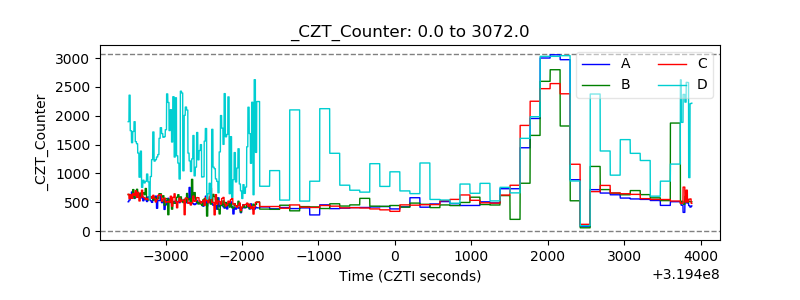 |
| +2.5 Volts monitor |  |
| +5 Volts monitor |  |
| _ROLL_ROT | 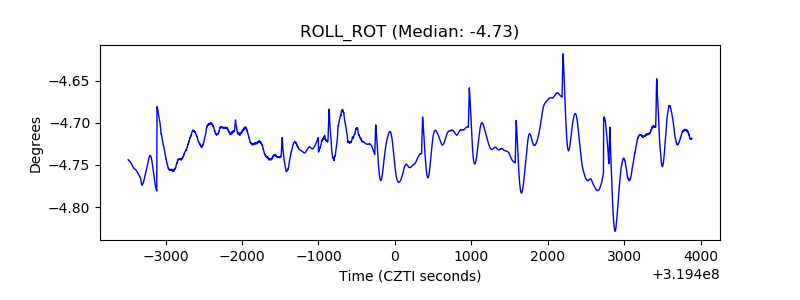 |
| _Roll_DEC |  |
| _Roll_RA | 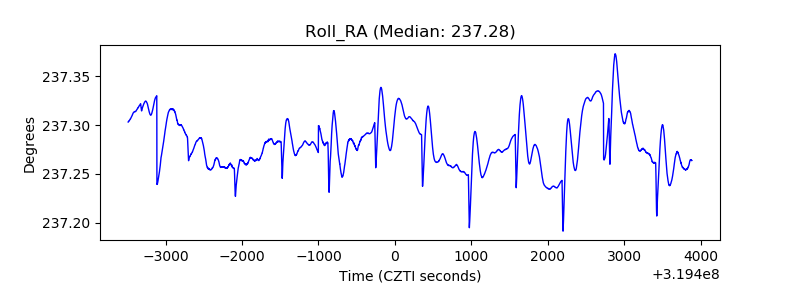 |
| Veto Counter | 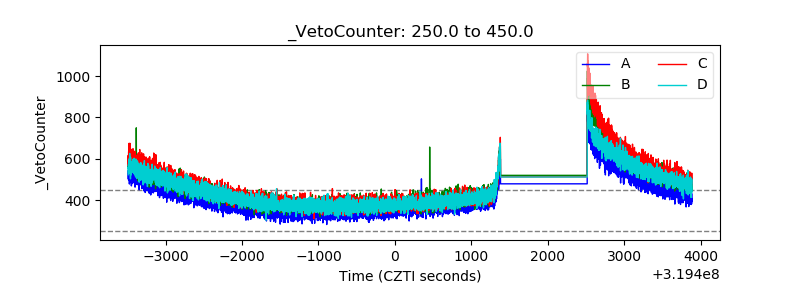 |