| Param | Original file | Final file |
|---|---|---|
| Filename | modeM0/AS1C05_012T03_9000003500_23693cztM0_level2.evt | modeM0/AS1C05_012T03_9000003500_23693cztM0_level2_quad_clean.evt |
| Size (bytes) | 564,217,920 | 110,943,360 |
| Size | 538.1 MB | 105.8 MB |
| Events in quadrant A | 3,022,541 | 754,131 |
| Events in quadrant B | 3,230,783 | 776,748 |
| Events in quadrant C | 3,194,553 | 757,747 |
| Events in quadrant D | 7,221,273 | 640,473 |
| Mode SS | |||
|---|---|---|---|
| Quadrant | BADHDUFLAG | Total packets | Discarded packets |
| A | 0 | 126 | 0 |
| B | 0 | 126 | 0 |
| C | 0 | 126 | 0 |
| D | 0 | 126 | 0 |
| Mode M9 | |||
|---|---|---|---|
| Quadrant | BADHDUFLAG | Total packets | Discarded packets |
| A | 0 | 13 | 0 |
| B | 0 | 13 | 0 |
| C | 0 | 13 | 0 |
| D | 0 | 13 | 0 |
| Mode M0 | |||
|---|---|---|---|
| Quadrant | BADHDUFLAG | Total packets | Discarded packets |
| A | 0 | 13160 | 1 |
| B | 0 | 13674 | 1 |
| C | 0 | 13550 | 1 |
| D | 0 | 25716 | 5 |
| Quadrant | Total seconds | Saturated seconds | Saturation percentage |
|---|---|---|---|
| A | 6163 | 20 | 0.324517% |
| B | 6163 | 37 | 0.600357% |
| C | 6163 | 67 | 1.087133% |
| D | 6163 | 1631 | 26.464384% |
Noise dominated data is calculated using 1-second bins in cleaned event files. If a bin has >2000 counts, and if more than 50% of those come from <1% of pixels, then it is considered to be noise-dominated and hence unusable.
| Quadrant | # 1 sec bins | Bins with >0 counts | Bins with >2000 counts | High rate bins dominated by noise | Noise dominated (total time) | Noise dominated (detector-on time) | Marked lightcurve |
|---|---|---|---|---|---|---|---|
| A | 7443 | 6163 | 0 | 0 | 0.00% | 0.00% | 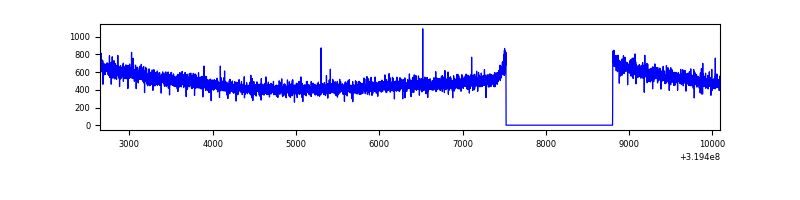 |
| B | 7443 | 6164 | 5 | 5 | 0.07% | 0.08% | 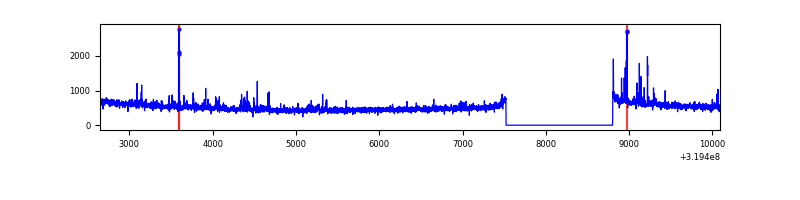 |
| C | 7443 | 6164 | 0 | 0 | 0.00% | 0.00% | 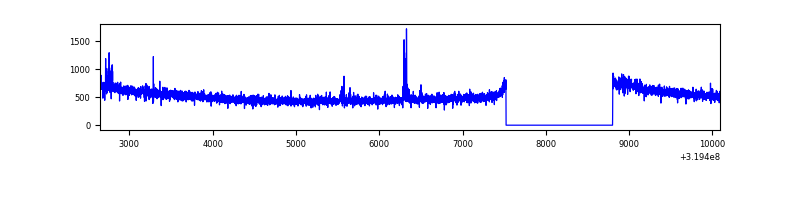 |
| D | 7442 | 6162 | 1359 | 1359 | 18.26% | 22.05% | 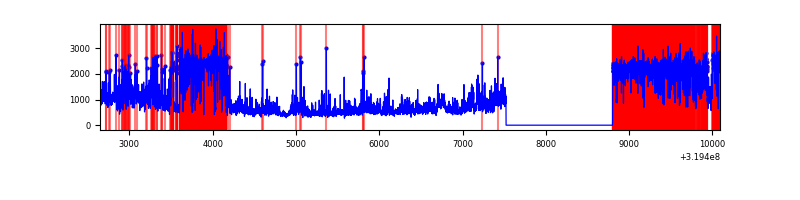 |
Top three noisy pixels from each quadrant. If the there are fewer than three noisy pixels in the level2.evt file, extra rows are filled as -1
| Pixel properties | Quadrant properties | ||||||
|---|---|---|---|---|---|---|---|
| Quadrant | DetID | PixID | Counts | Sigma | Mean | Median | Sigma |
| A | 13 | 254 | 9858 | 57.84 | 784 | 770 | 157.1 |
| A | 0 | 226 | 6788 | 38.3 | 784 | 770 | 157.1 |
| A | 3 | 137 | 6526 | 36.63 | 784 | 770 | 157.1 |
| B | 0 | 245 | 67144 | 454.3 | 788 | 768 | 146.1 |
| B | 0 | 183 | 31443 | 209.95 | 788 | 768 | 146.1 |
| B | 0 | 219 | 18239 | 119.58 | 788 | 768 | 146.1 |
| C | 14 | 238 | 123396 | 689.9 | 774 | 783 | 177.7 |
| C | 7 | 247 | 40740 | 224.83 | 774 | 783 | 177.7 |
| C | 1 | 16 | 12890 | 68.12 | 774 | 783 | 177.7 |
| D | 13 | 174 | 3892471 | 23630.16 | 686 | 665 | 164.7 |
| D | 1 | 52 | 672437 | 4078.85 | 686 | 665 | 164.7 |
| D | 8 | 195 | 30708 | 182.41 | 686 | 665 | 164.7 |
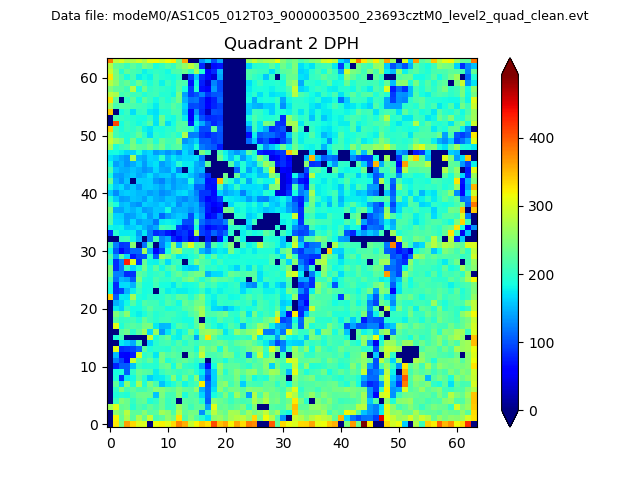
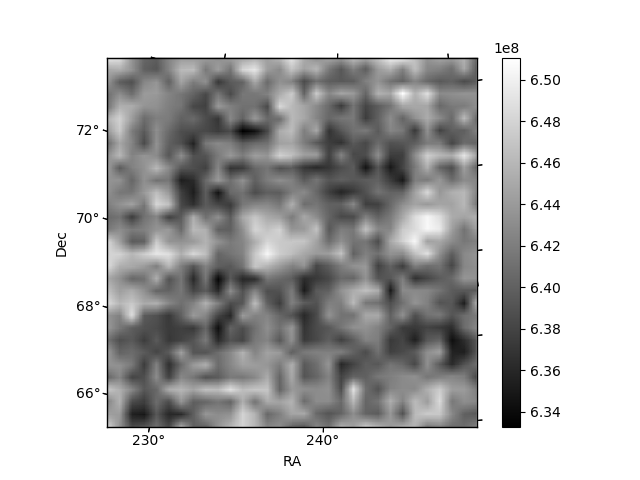
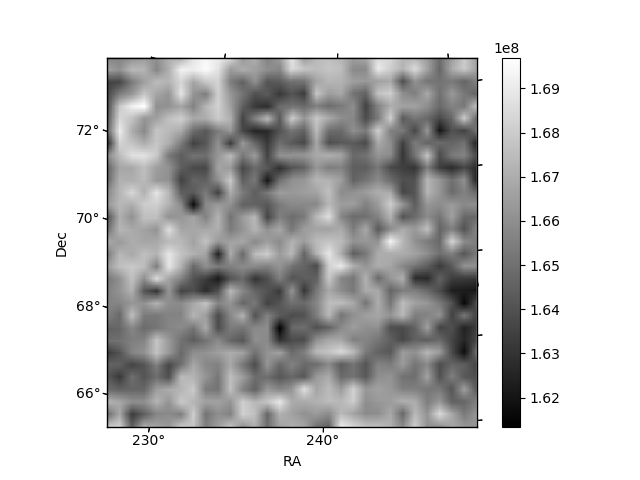
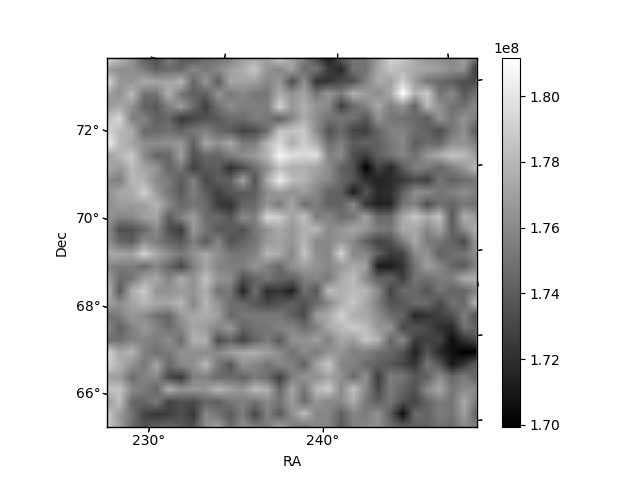
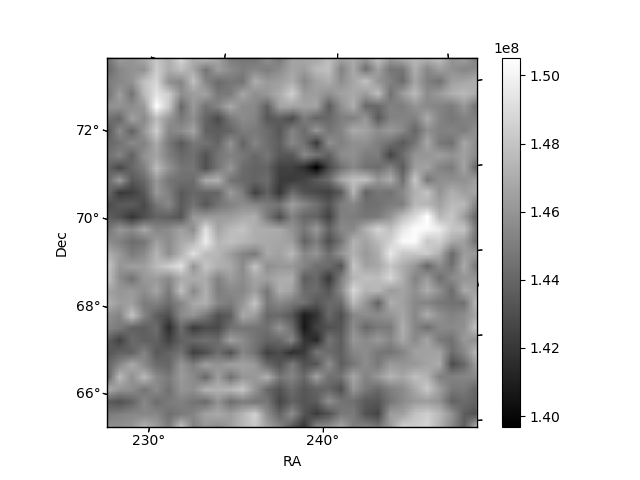
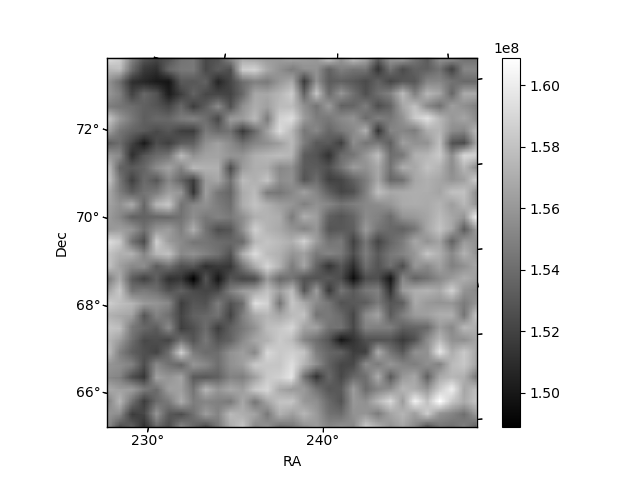
Histogram calculated using DETX and DETY for each event in the final _common_clean file
| Quadrant A | 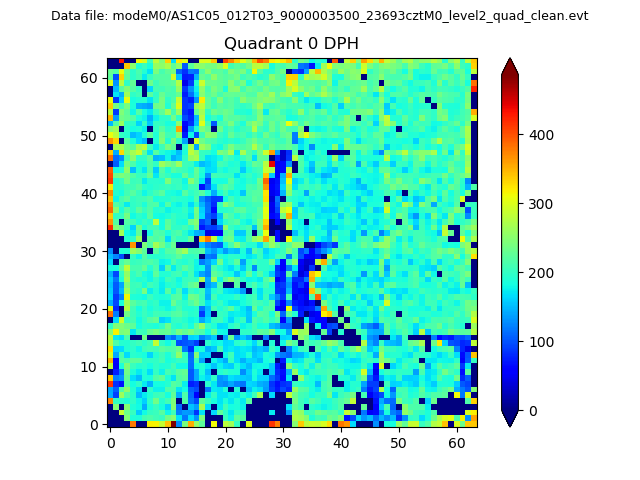 |
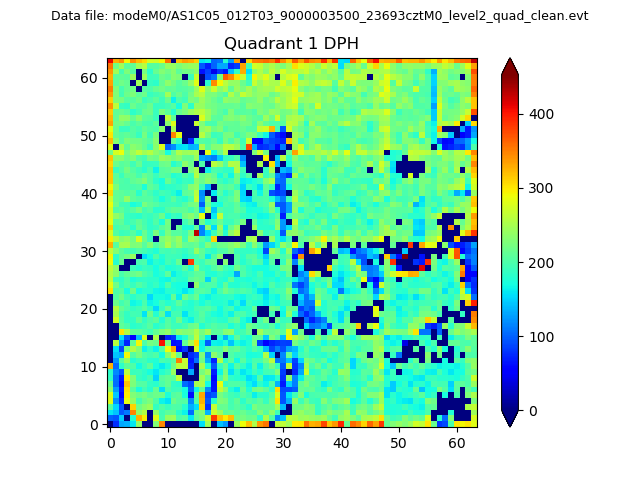 |
Quadrant B |
|---|---|---|---|
| Quadrant D | 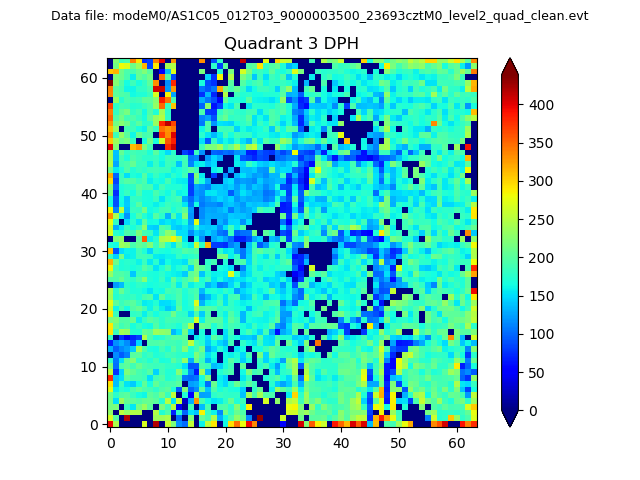 |
 |
Quadrant C |
| Plot type | Count rate plots | Images |
|---|---|---|
| Comparison with Poisson distribution Blue bars denote a histogram of data divided into 1 sec bins. Red curve is a Poisson curve with rate = median count rate of data. |
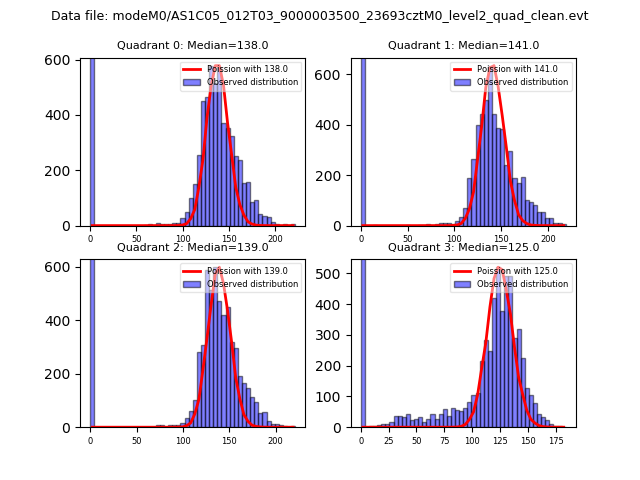 |
 |
| Quadrant-wise count rates Data is divided into 100 sec bins |
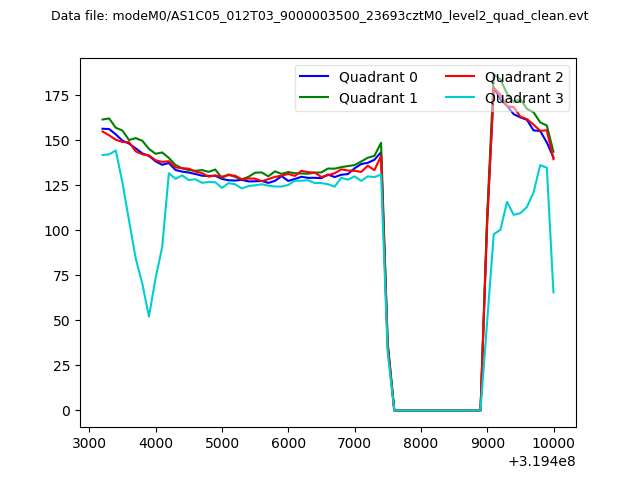 |
|
| Module-wise count rates for Quadrant A Data is divided into 100 sec bins |
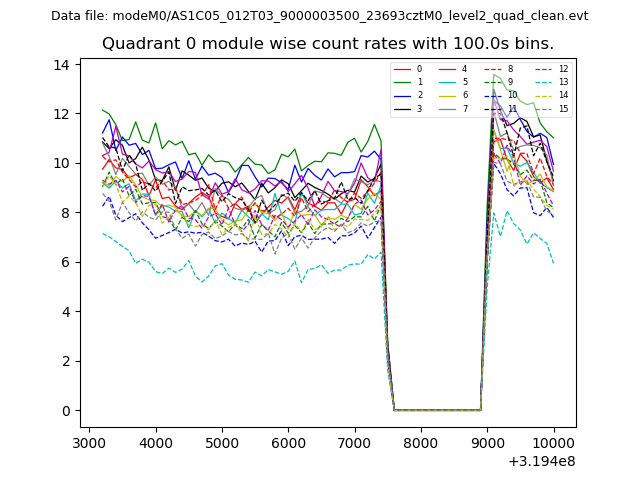 |
 |
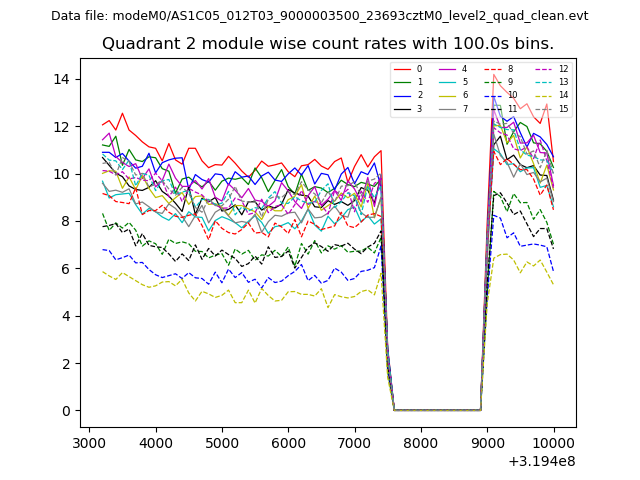
| Module-wise count rates for Quadrant B Data is divided into 100 sec bins |
 |
 |
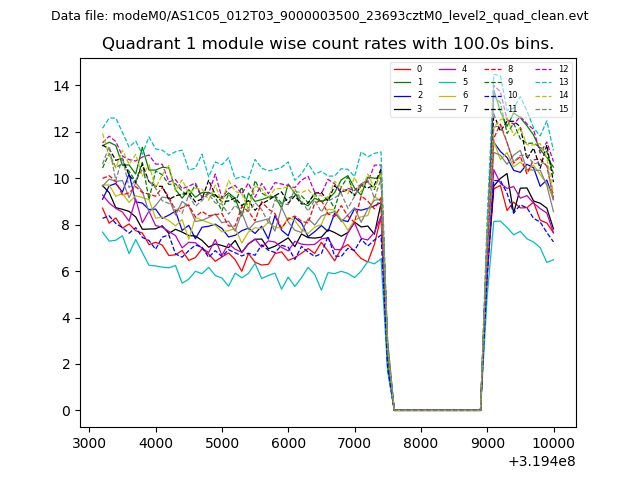
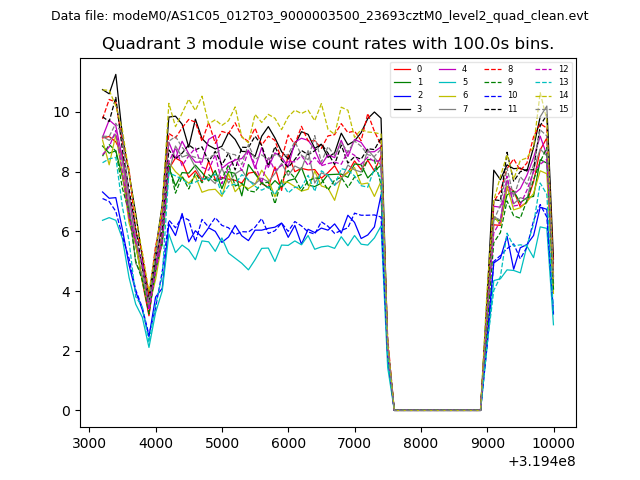
| Module-wise count rates for Quadrant C Data is divided into 100 sec bins |
 |
 |
| Module-wise count rates for Quadrant D Data is divided into 100 sec bins |
 |
 |
| Parameter | Plot |
|---|---|
| CZT HV Monitor | 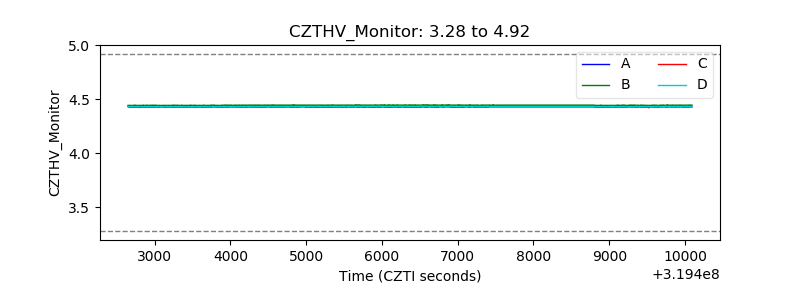 |
| D_VDD | 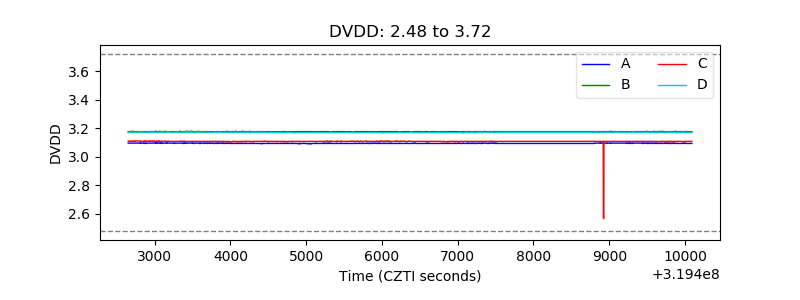 |
| Temperature 1 | 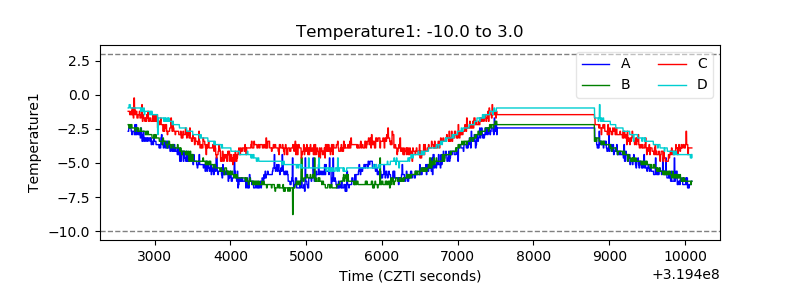 |
| Veto HV Monitor |  |
| Veto LLD | 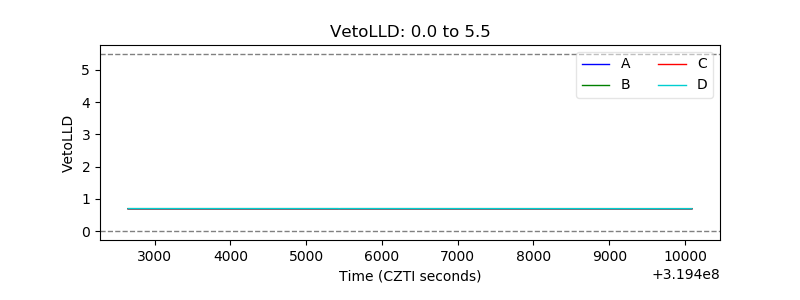 |
| Alpha Counter | 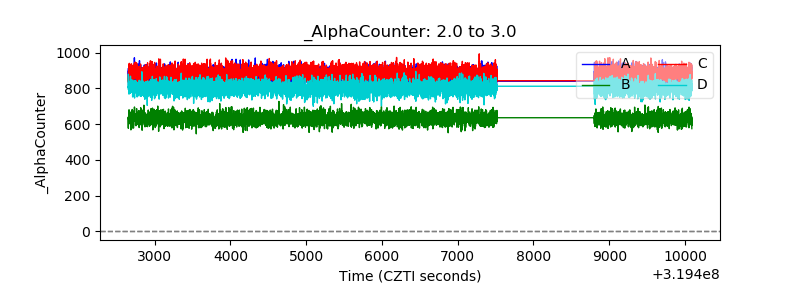 |
| _CPM_Rate | 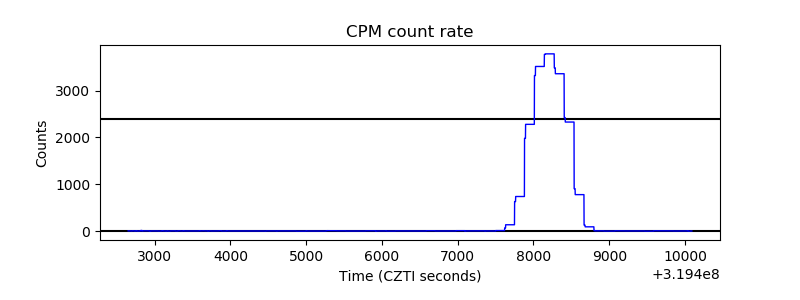 |
| CZT Counter | 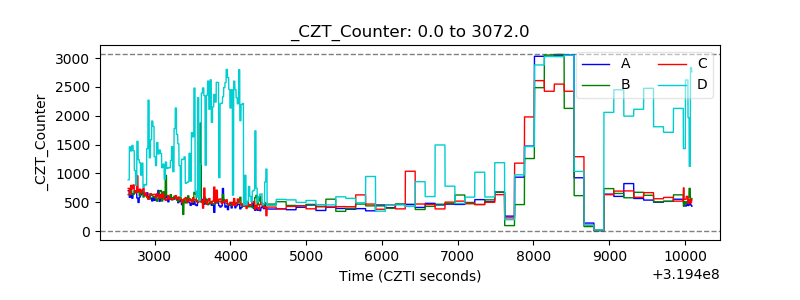 |
| +2.5 Volts monitor |  |
| +5 Volts monitor |  |
| _ROLL_ROT | 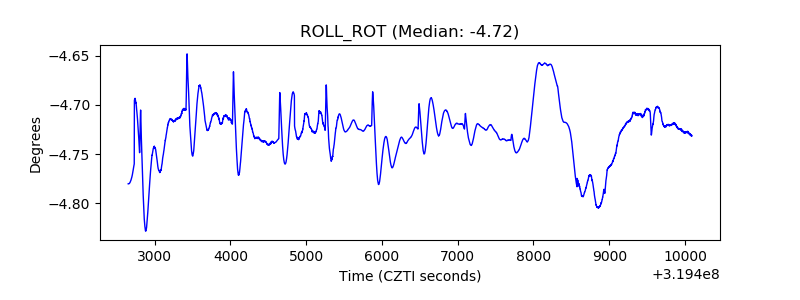 |
| _Roll_DEC | 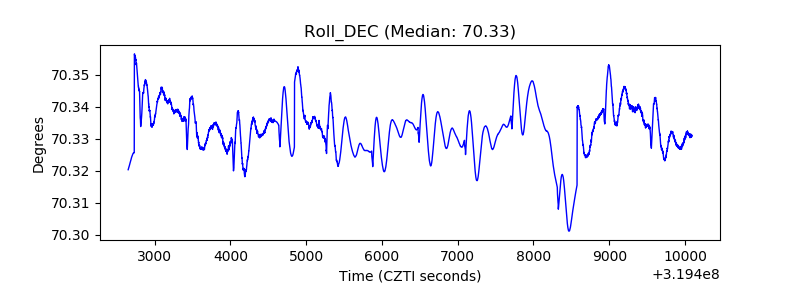 |
| _Roll_RA | 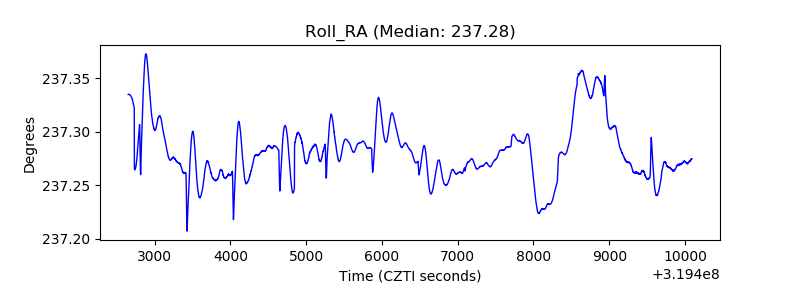 |
| Veto Counter |  |