| Param | Original file | Final file |
|---|---|---|
| Filename | modeM0/AS1C05_012T03_9000003500_23695cztM0_level2.evt | modeM0/AS1C05_012T03_9000003500_23695cztM0_level2_quad_clean.evt |
| Size (bytes) | 481,596,480 | 123,600,960 |
| Size | 459.3 MB | 117.9 MB |
| Events in quadrant A | 2,969,553 | 833,531 |
| Events in quadrant B | 3,173,539 | 865,515 |
| Events in quadrant C | 3,109,842 | 836,783 |
| Events in quadrant D | 4,919,773 | 783,203 |
| Mode SS | |||
|---|---|---|---|
| Quadrant | BADHDUFLAG | Total packets | Discarded packets |
| A | 0 | 126 | 0 |
| B | 0 | 126 | 0 |
| C | 0 | 126 | 0 |
| D | 0 | 126 | 0 |
| Mode M9 | |||
|---|---|---|---|
| Quadrant | BADHDUFLAG | Total packets | Discarded packets |
| A | 0 | 15 | 0 |
| B | 0 | 16 | 0 |
| C | 0 | 16 | 0 |
| D | 0 | 16 | 0 |
| Mode M0 | |||
|---|---|---|---|
| Quadrant | BADHDUFLAG | Total packets | Discarded packets |
| A | 0 | 12732 | 2 |
| B | 0 | 13277 | 2 |
| C | 0 | 13076 | 2 |
| D | 0 | 18915 | 2 |
| Quadrant | Total seconds | Saturated seconds | Saturation percentage |
|---|---|---|---|
| A | 6072 | 19 | 0.312912% |
| B | 6072 | 29 | 0.477602% |
| C | 6072 | 56 | 0.922266% |
| D | 6072 | 211 | 3.474967% |
Noise dominated data is calculated using 1-second bins in cleaned event files. If a bin has >2000 counts, and if more than 50% of those come from <1% of pixels, then it is considered to be noise-dominated and hence unusable.
| Quadrant | # 1 sec bins | Bins with >0 counts | Bins with >2000 counts | High rate bins dominated by noise | Noise dominated (total time) | Noise dominated (detector-on time) | Marked lightcurve |
|---|---|---|---|---|---|---|---|
| A | 7452 | 6073 | 0 | 0 | 0.00% | 0.00% | 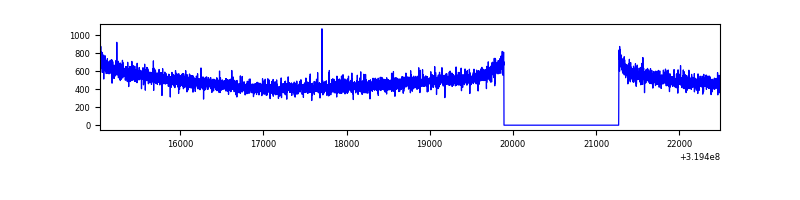 |
| B | 7452 | 6073 | 0 | 0 | 0.00% | 0.00% | 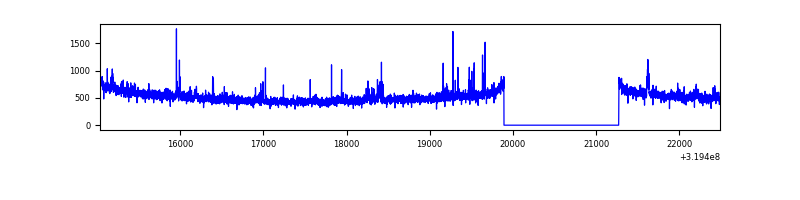 |
| C | 7452 | 6073 | 0 | 0 | 0.00% | 0.00% | 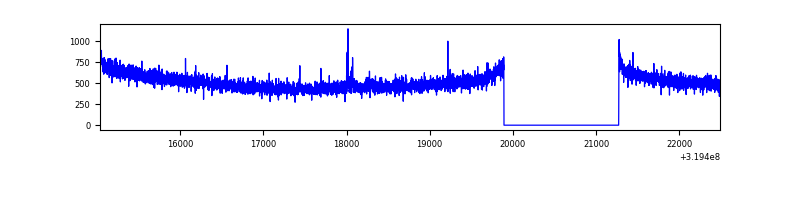 |
| D | 7452 | 6072 | 106 | 106 | 1.42% | 1.75% | 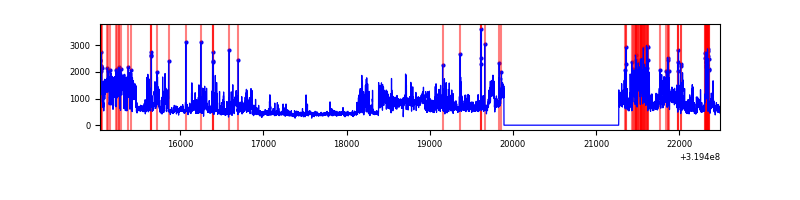 |
Top three noisy pixels from each quadrant. If the there are fewer than three noisy pixels in the level2.evt file, extra rows are filled as -1
| Pixel properties | Quadrant properties | ||||||
|---|---|---|---|---|---|---|---|
| Quadrant | DetID | PixID | Counts | Sigma | Mean | Median | Sigma |
| A | 13 | 254 | 9508 | 57.42 | 770 | 756 | 152.4 |
| A | 0 | 226 | 6494 | 37.64 | 770 | 756 | 152.4 |
| A | 3 | 137 | 6292 | 36.32 | 770 | 756 | 152.4 |
| B | 0 | 183 | 36388 | 249.09 | 781 | 763 | 143.0 |
| B | 0 | 189 | 20177 | 135.74 | 781 | 763 | 143.0 |
| B | 12 | 111 | 16739 | 111.7 | 781 | 763 | 143.0 |
| C | 14 | 238 | 122208 | 693.29 | 761 | 766 | 175.2 |
| C | 7 | 247 | 18440 | 100.9 | 761 | 766 | 175.2 |
| C | 13 | 61 | 5155 | 25.06 | 761 | 766 | 175.2 |
| D | 13 | 174 | 1505187 | 8389.07 | 745 | 726 | 179.3 |
| D | 1 | 52 | 427955 | 2382.28 | 745 | 726 | 179.3 |
| D | 9 | 35 | 113470 | 628.68 | 745 | 726 | 179.3 |
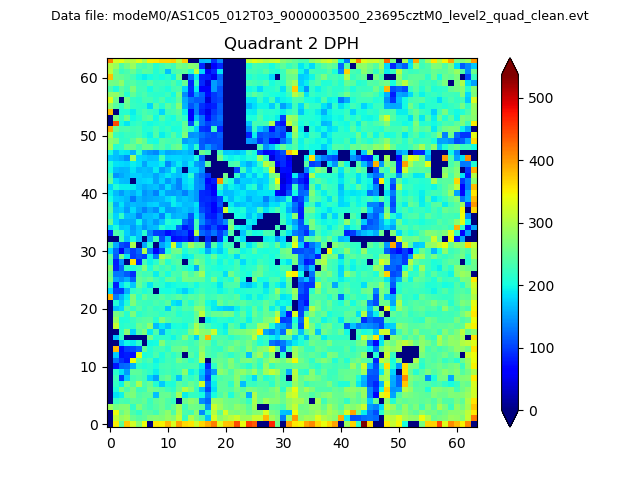
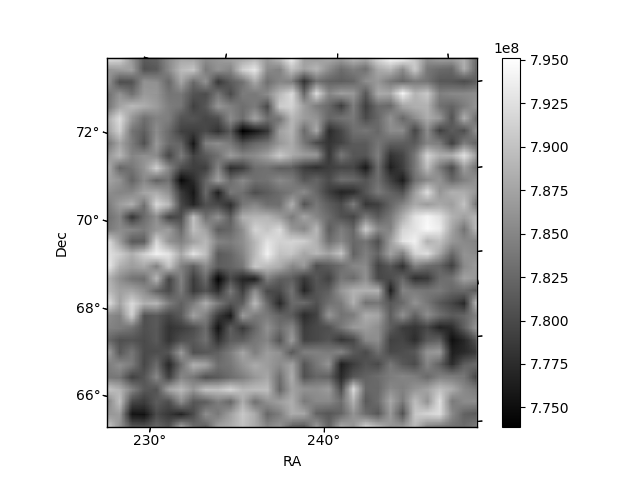
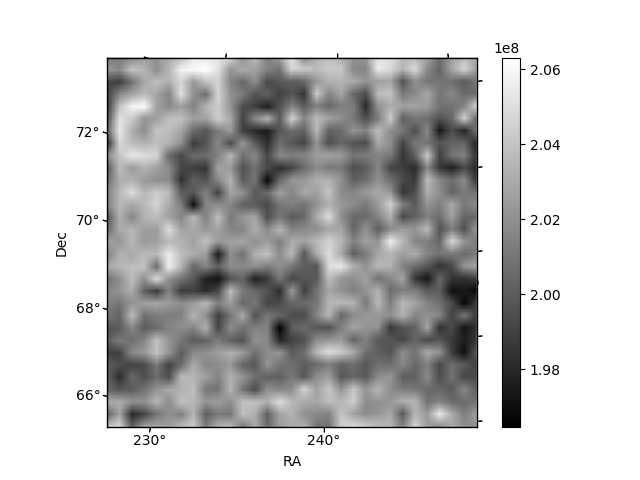
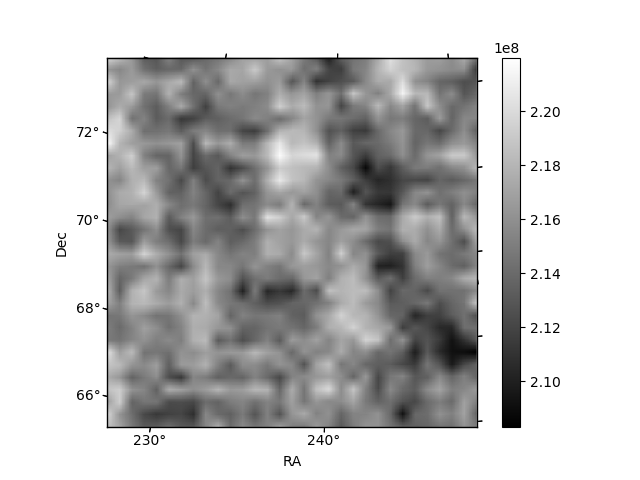
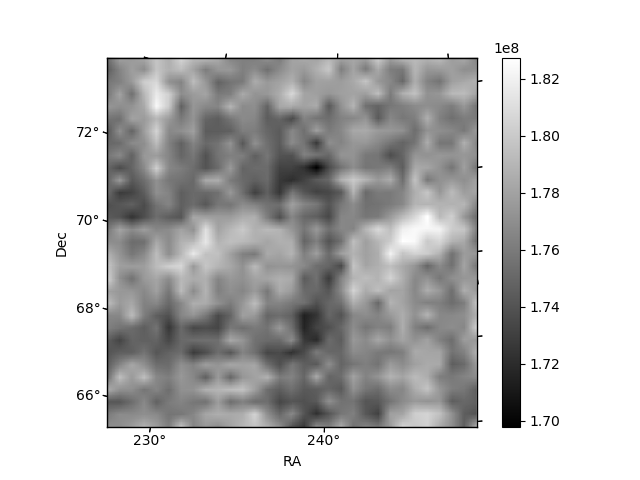
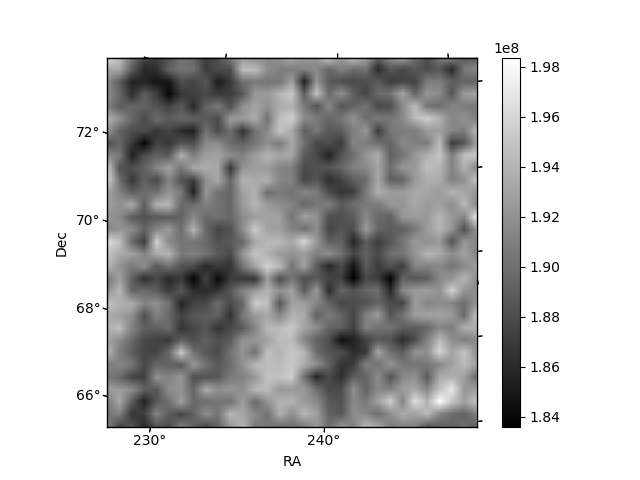
Histogram calculated using DETX and DETY for each event in the final _common_clean file
| Quadrant A | 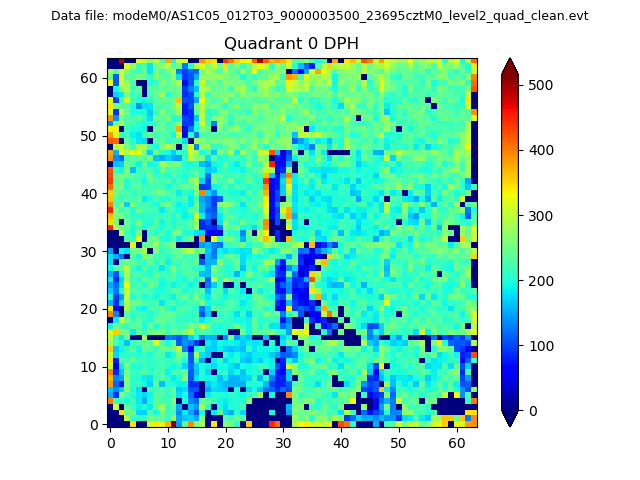 |
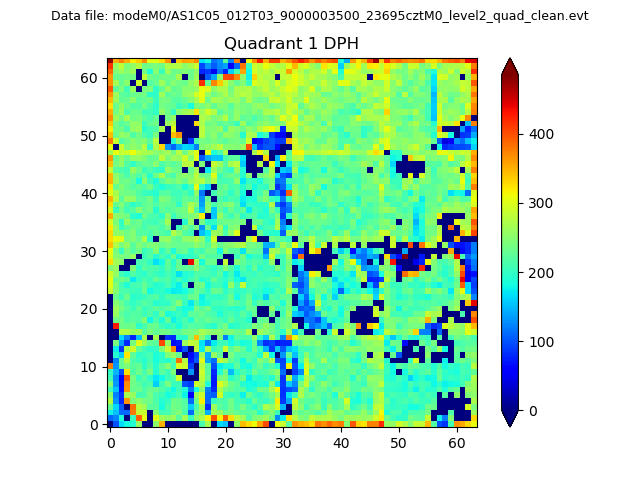 |
Quadrant B |
|---|---|---|---|
| Quadrant D | 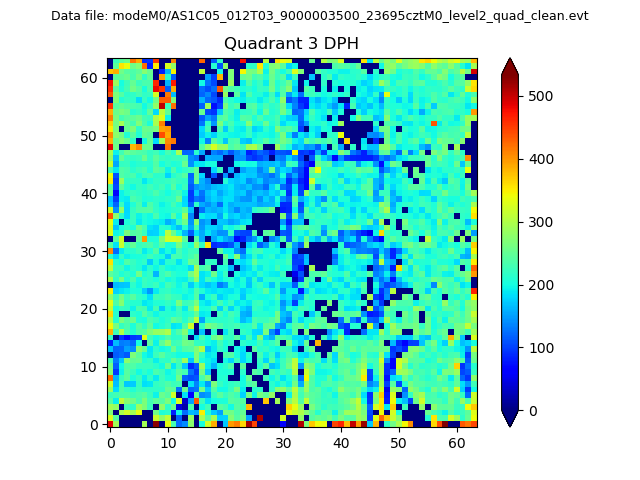 |
 |
Quadrant C |
| Plot type | Count rate plots | Images |
|---|---|---|
| Comparison with Poisson distribution Blue bars denote a histogram of data divided into 1 sec bins. Red curve is a Poisson curve with rate = median count rate of data. |
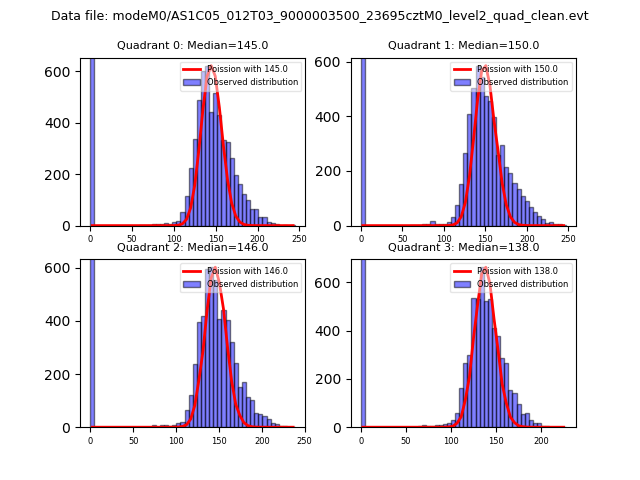 |
 |
| Quadrant-wise count rates Data is divided into 100 sec bins |
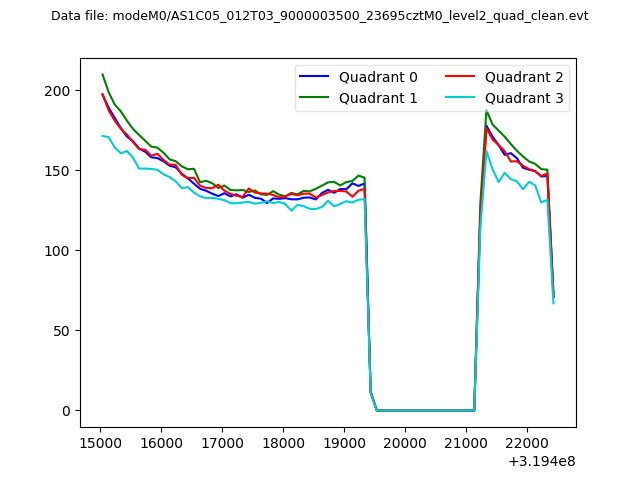 |
|
| Module-wise count rates for Quadrant A Data is divided into 100 sec bins |
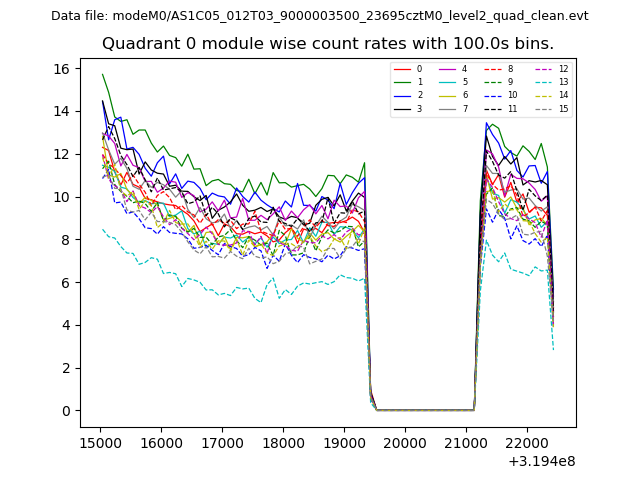 |
 |
| Module-wise count rates for Quadrant B Data is divided into 100 sec bins |
 |
 |
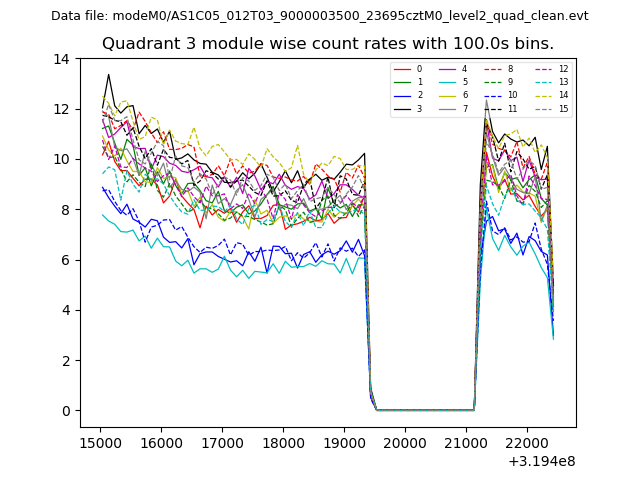
| Module-wise count rates for Quadrant C Data is divided into 100 sec bins |
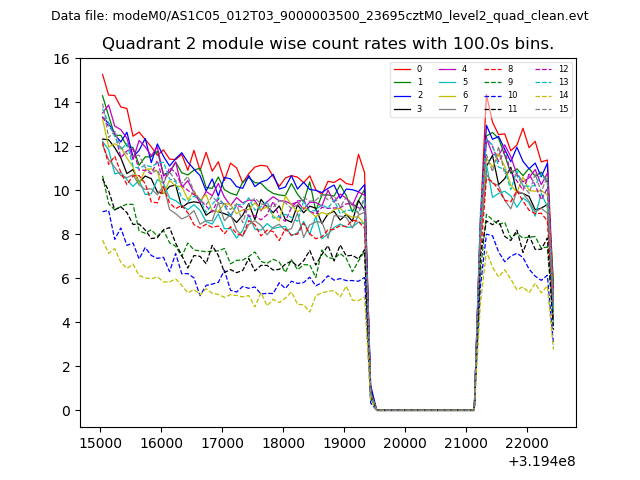 |
 |
| Module-wise count rates for Quadrant D Data is divided into 100 sec bins |
 |
 |
| Parameter | Plot |
|---|---|
| CZT HV Monitor | 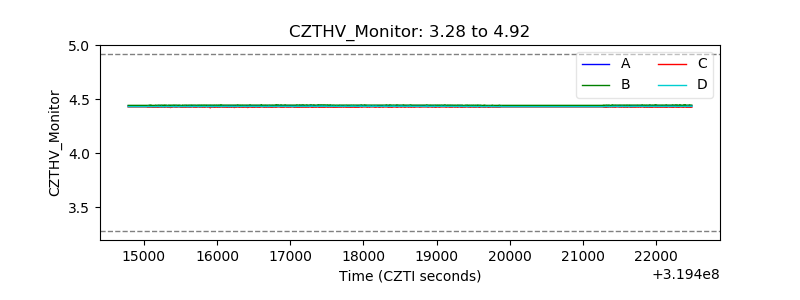 |
| D_VDD | 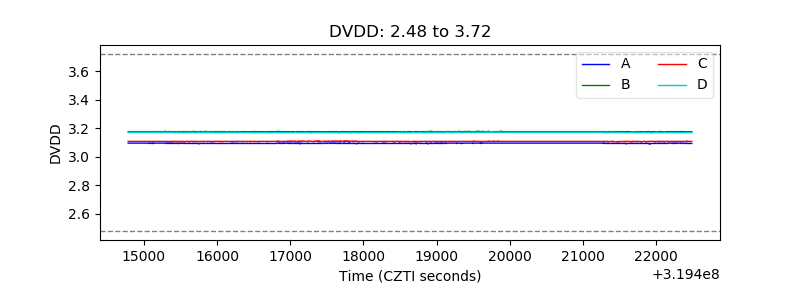 |
| Temperature 1 | 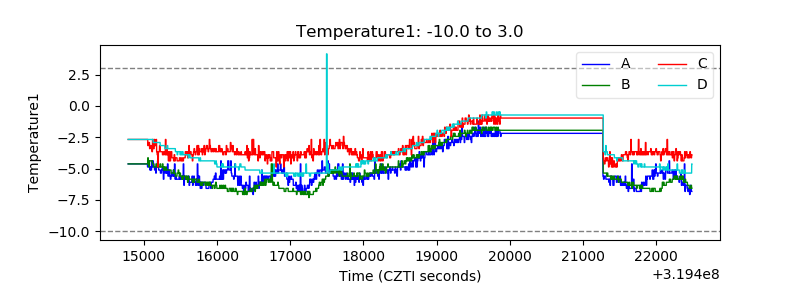 |
| Veto HV Monitor | 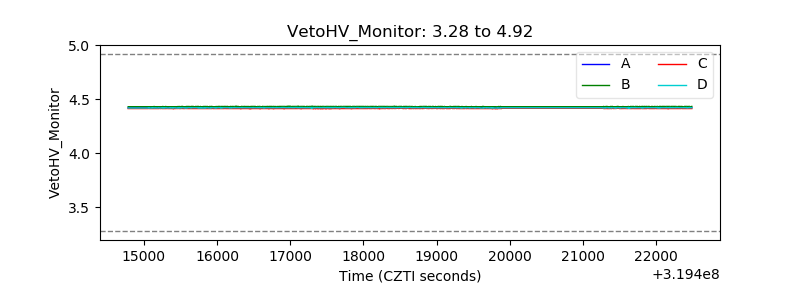 |
| Veto LLD | 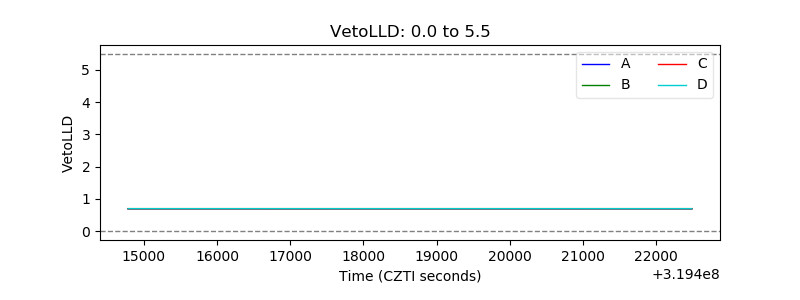 |
| Alpha Counter | 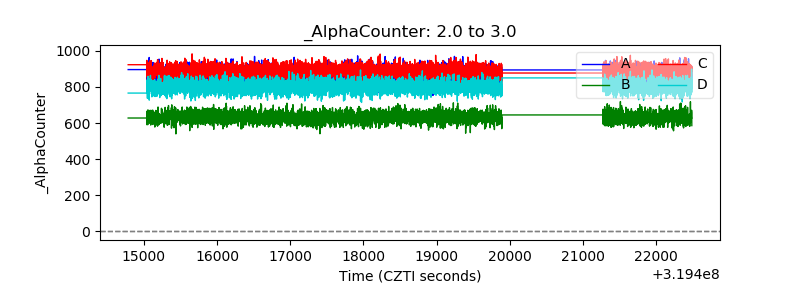 |
| _CPM_Rate | 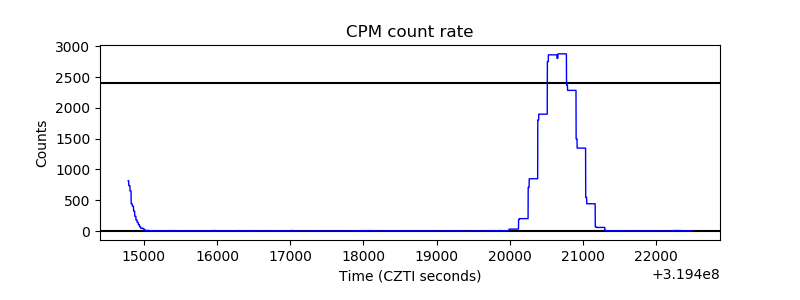 |
| CZT Counter | 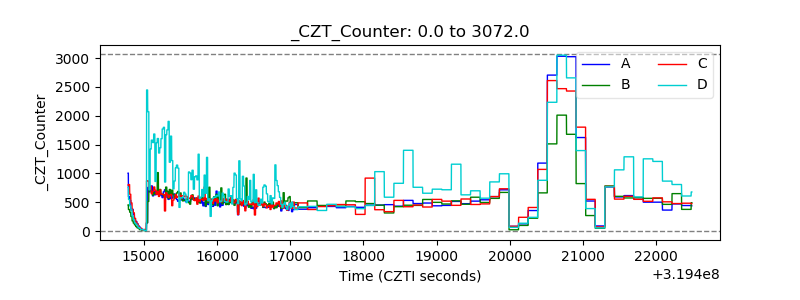 |
| +2.5 Volts monitor |  |
| +5 Volts monitor | 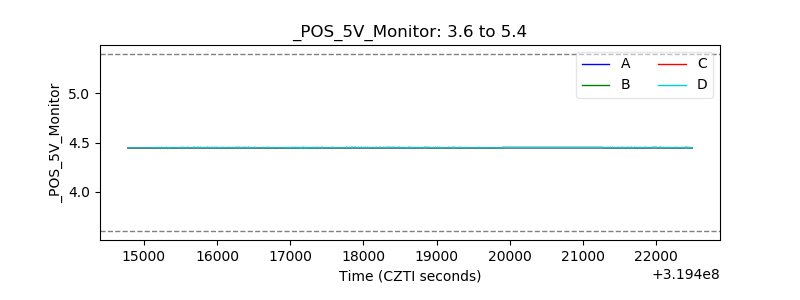 |
| _ROLL_ROT | 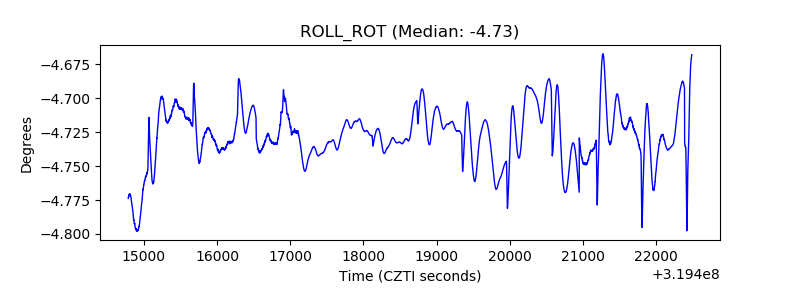 |
| _Roll_DEC | 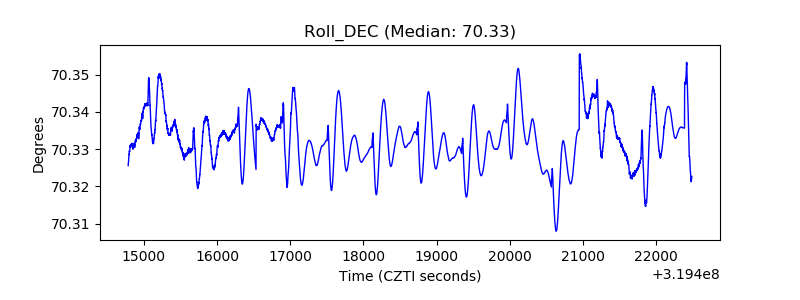 |
| _Roll_RA | 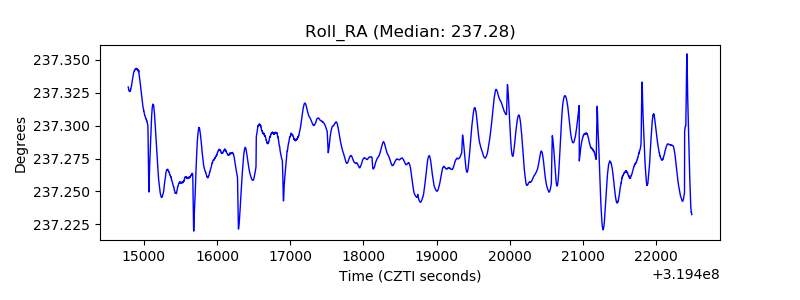 |
| Veto Counter | 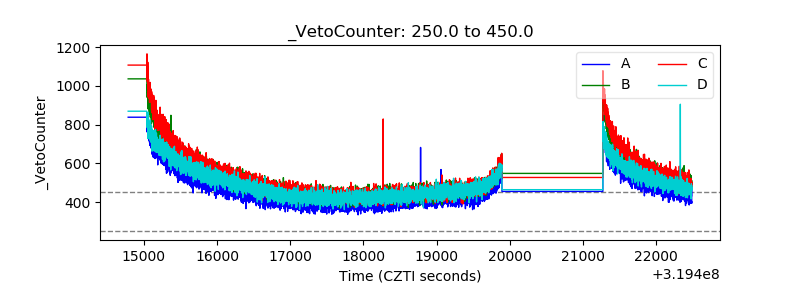 |