| Param | Original file | Final file |
|---|---|---|
| Filename | modeM0/AS1C05_012T03_9000003500_23696cztM0_level2.evt | modeM0/AS1C05_012T03_9000003500_23696cztM0_level2_quad_clean.evt |
| Size (bytes) | 475,479,360 | 119,070,720 |
| Size | 453.5 MB | 113.6 MB |
| Events in quadrant A | 3,112,920 | 790,220 |
| Events in quadrant B | 3,288,072 | 823,617 |
| Events in quadrant C | 3,198,415 | 790,203 |
| Events in quadrant D | 4,354,245 | 744,046 |
| Mode SS | |||
|---|---|---|---|
| Quadrant | BADHDUFLAG | Total packets | Discarded packets |
| A | 0 | 134 | 0 |
| B | 0 | 134 | 0 |
| C | 0 | 134 | 0 |
| D | 0 | 134 | 0 |
| Mode M9 | |||
|---|---|---|---|
| Quadrant | BADHDUFLAG | Total packets | Discarded packets |
| A | 0 | 15 | 0 |
| B | 0 | 16 | 0 |
| C | 0 | 16 | 0 |
| D | 0 | 16 | 0 |
| Mode M0 | |||
|---|---|---|---|
| Quadrant | BADHDUFLAG | Total packets | Discarded packets |
| A | 0 | 13599 | 2 |
| B | 0 | 14006 | 2 |
| C | 0 | 13751 | 2 |
| D | 0 | 17455 | 2 |
| Quadrant | Total seconds | Saturated seconds | Saturation percentage |
|---|---|---|---|
| A | 6569 | 17 | 0.258791% |
| B | 6569 | 45 | 0.685036% |
| C | 6569 | 59 | 0.898158% |
| D | 6569 | 206 | 3.135942% |
Noise dominated data is calculated using 1-second bins in cleaned event files. If a bin has >2000 counts, and if more than 50% of those come from <1% of pixels, then it is considered to be noise-dominated and hence unusable.
| Quadrant | # 1 sec bins | Bins with >0 counts | Bins with >2000 counts | High rate bins dominated by noise | Noise dominated (total time) | Noise dominated (detector-on time) | Marked lightcurve |
|---|---|---|---|---|---|---|---|
| A | 7849 | 6570 | 1 | 1 | 0.01% | 0.02% | 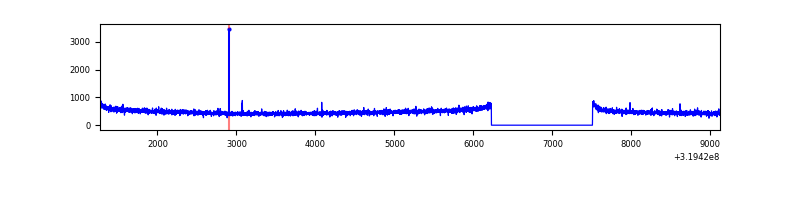 |
| B | 7849 | 6570 | 0 | 0 | 0.00% | 0.00% | 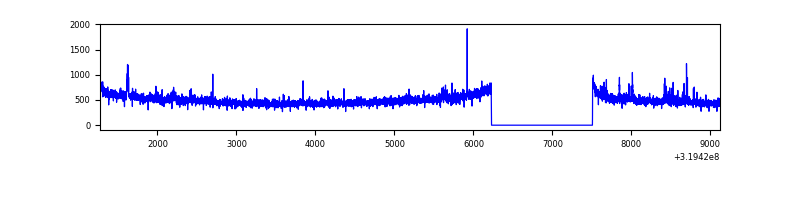 |
| C | 7849 | 6570 | 0 | 0 | 0.00% | 0.00% | 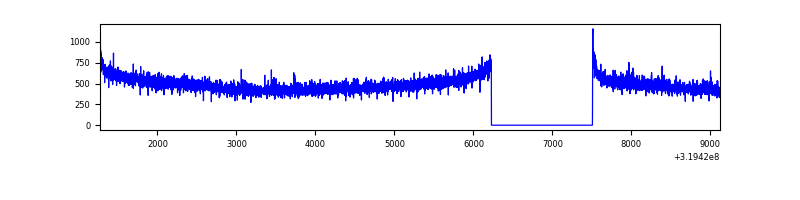 |
| D | 7849 | 6570 | 165 | 165 | 2.10% | 2.51% | 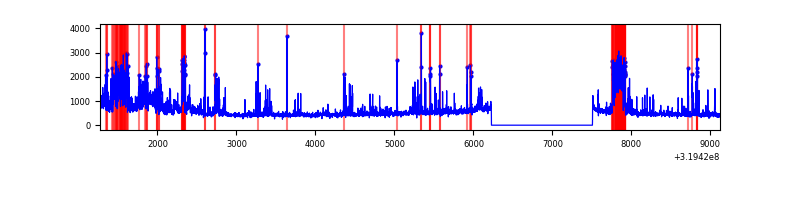 |
Top three noisy pixels from each quadrant. If the there are fewer than three noisy pixels in the level2.evt file, extra rows are filled as -1
| Pixel properties | Quadrant properties | ||||||
|---|---|---|---|---|---|---|---|
| Quadrant | DetID | PixID | Counts | Sigma | Mean | Median | Sigma |
| A | 13 | 254 | 10238 | 58.5 | 806 | 792 | 161.5 |
| A | 0 | 226 | 6939 | 38.07 | 806 | 792 | 161.5 |
| A | 3 | 137 | 6709 | 36.65 | 806 | 792 | 161.5 |
| B | 0 | 183 | 34343 | 225.41 | 814 | 795 | 148.8 |
| B | 0 | 229 | 21479 | 138.98 | 814 | 795 | 148.8 |
| B | 12 | 111 | 17699 | 113.58 | 814 | 795 | 148.8 |
| C | 14 | 238 | 128306 | 711.31 | 785 | 790 | 179.3 |
| C | 13 | 61 | 5414 | 25.79 | 785 | 790 | 179.3 |
| C | 7 | 247 | 4215 | 19.11 | 785 | 790 | 179.3 |
| D | 13 | 174 | 699647 | 3804.37 | 772 | 751 | 183.7 |
| D | 1 | 52 | 603030 | 3278.45 | 772 | 751 | 183.7 |
| D | 9 | 35 | 79778 | 430.18 | 772 | 751 | 183.7 |
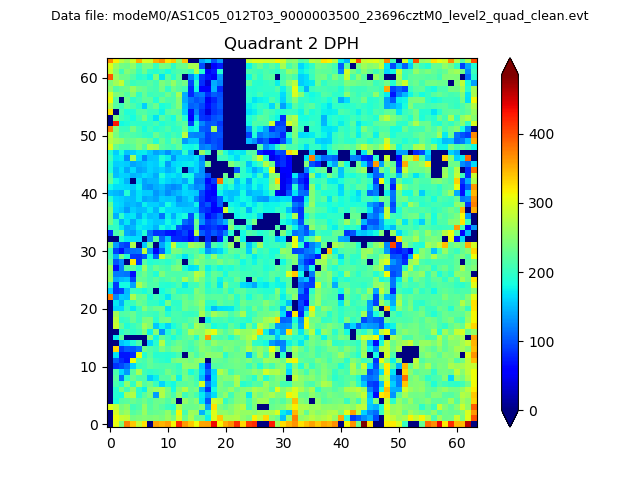
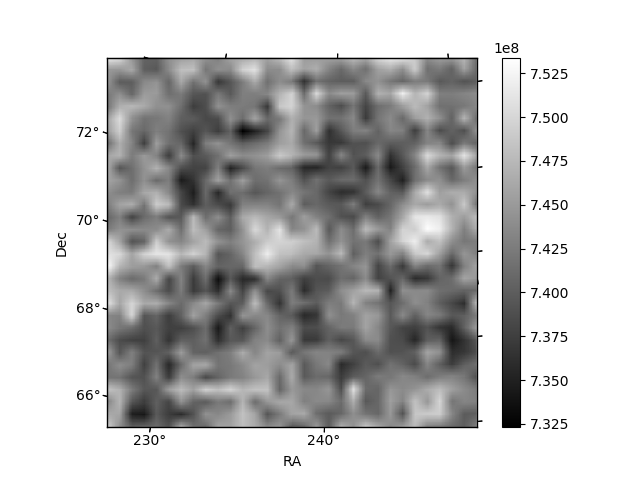
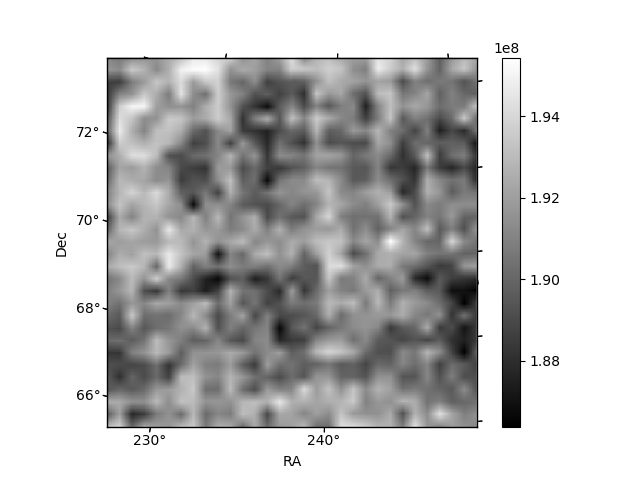
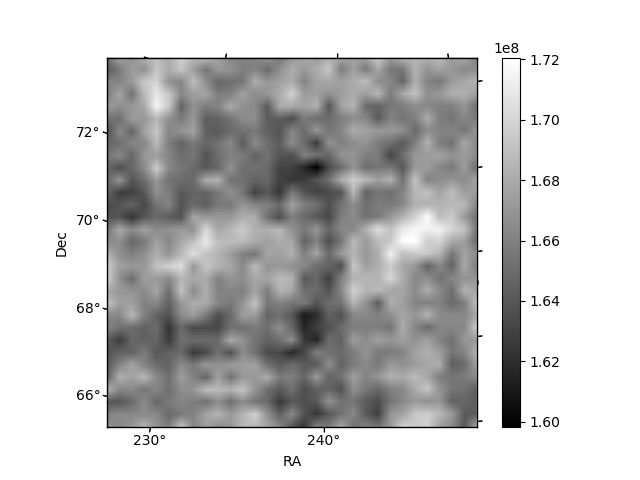
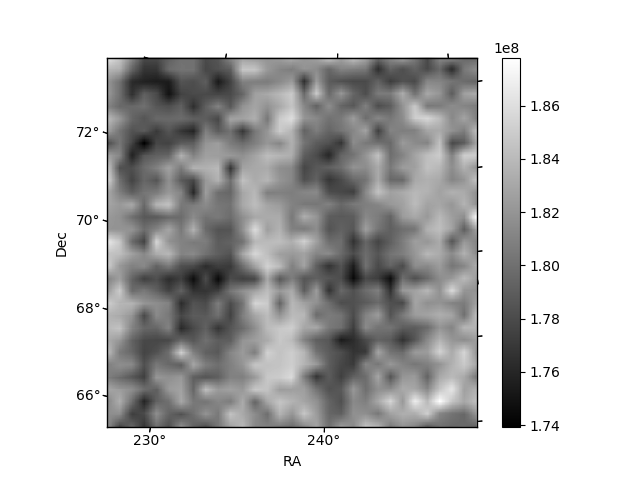
Histogram calculated using DETX and DETY for each event in the final _common_clean file
| Quadrant A | 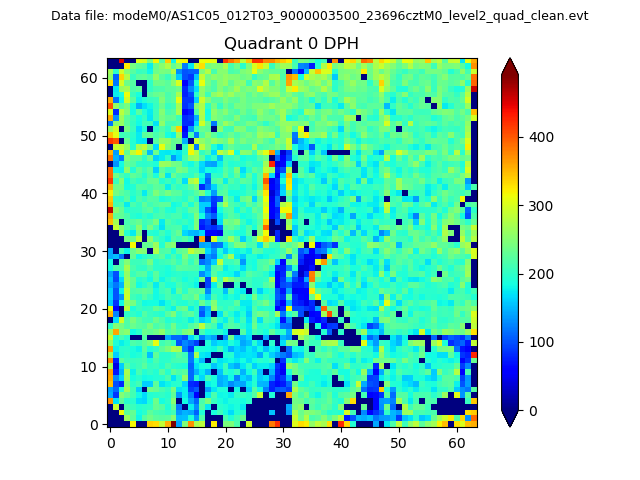 |
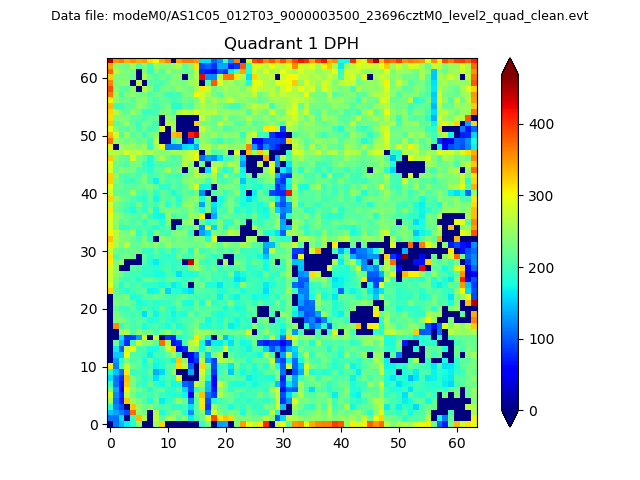 |
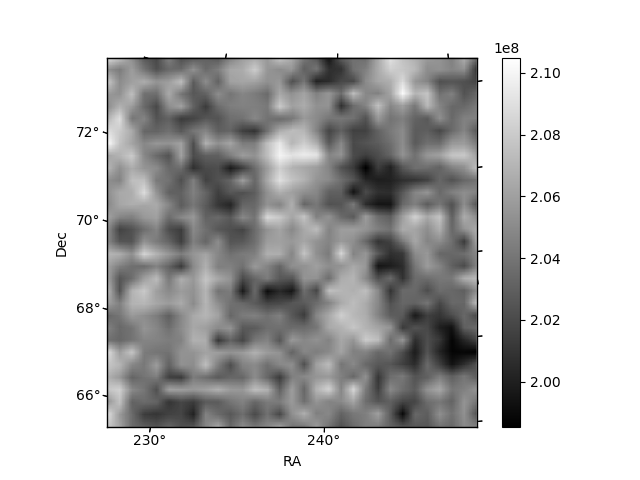
Quadrant B |
|---|---|---|---|
| Quadrant D | 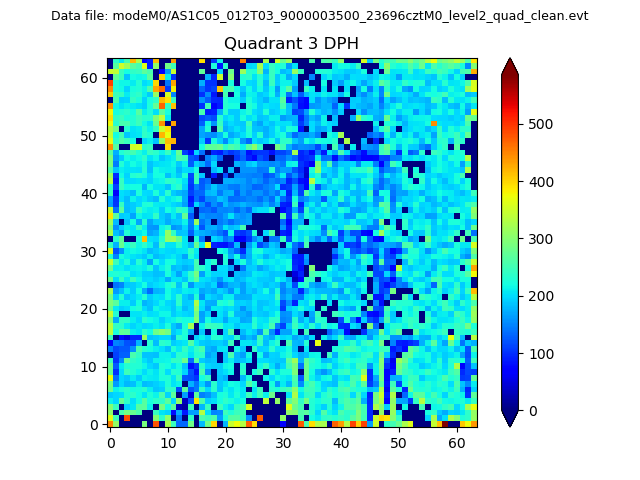 |
 |
Quadrant C |
| Plot type | Count rate plots | Images |
|---|---|---|
| Comparison with Poisson distribution Blue bars denote a histogram of data divided into 1 sec bins. Red curve is a Poisson curve with rate = median count rate of data. |
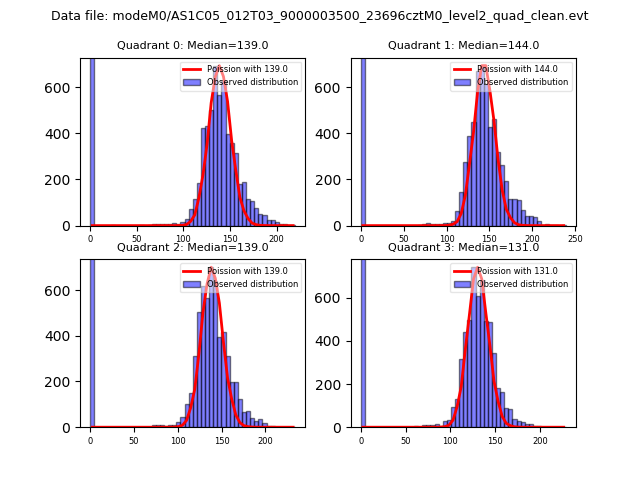 |
 |
| Quadrant-wise count rates Data is divided into 100 sec bins |
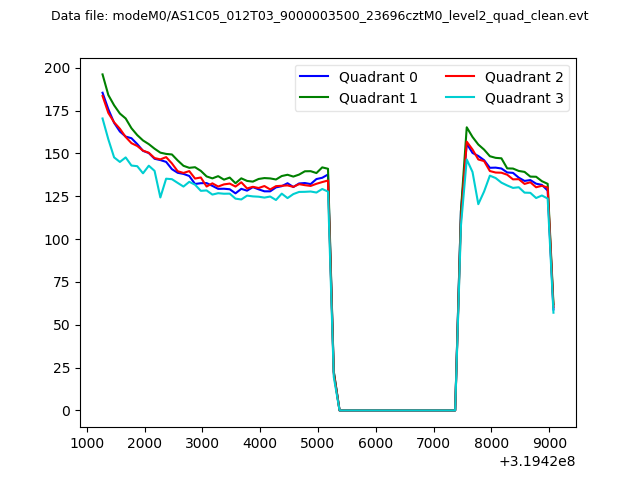 |
|
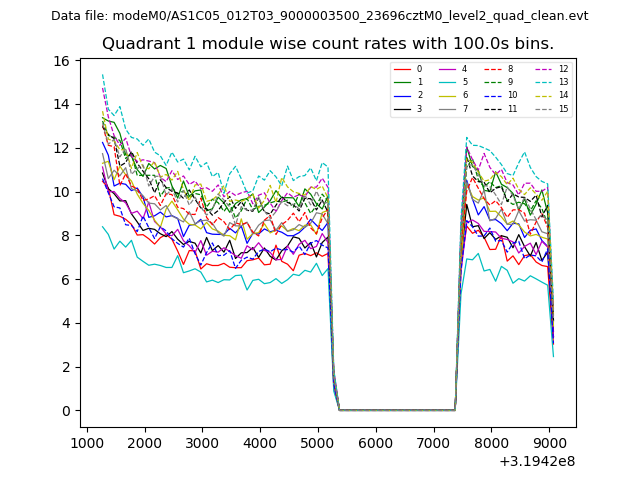
| Module-wise count rates for Quadrant A Data is divided into 100 sec bins |
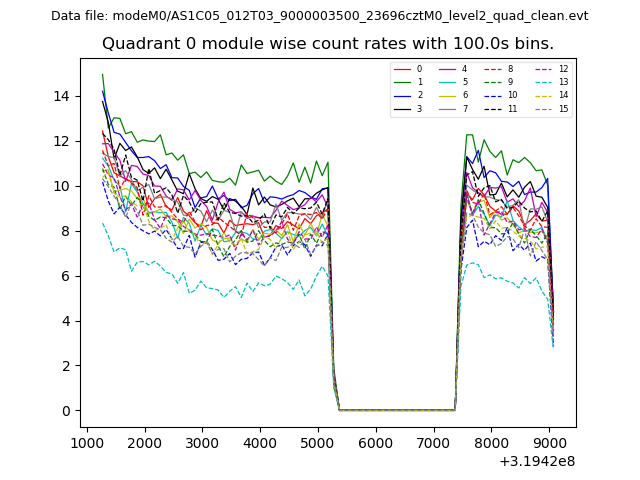 |
 |
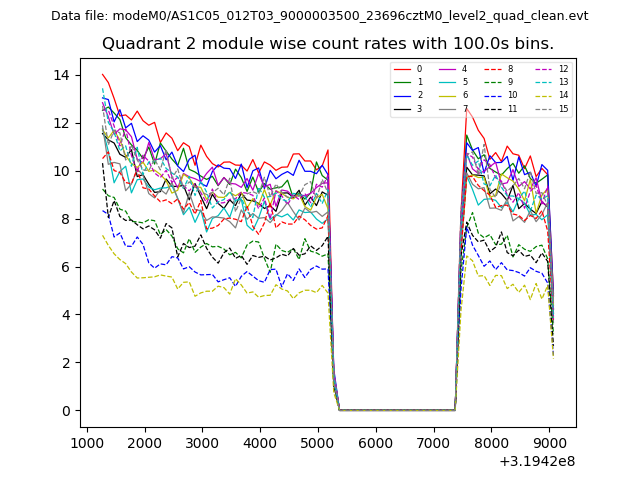
| Module-wise count rates for Quadrant B Data is divided into 100 sec bins |
 |
 |
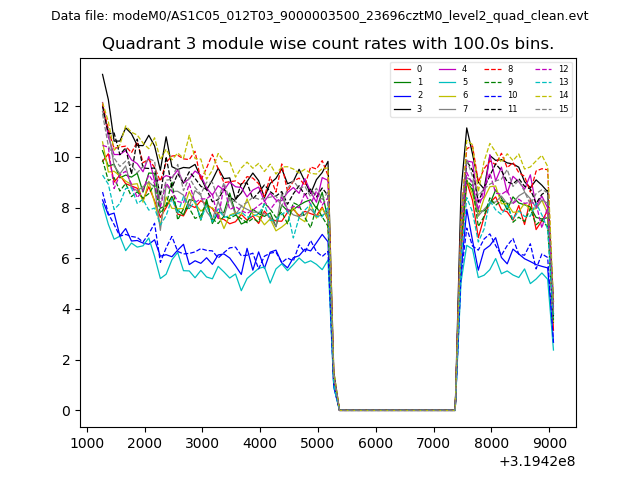
| Module-wise count rates for Quadrant C Data is divided into 100 sec bins |
 |
 |
| Module-wise count rates for Quadrant D Data is divided into 100 sec bins |
 |
 |
| Parameter | Plot |
|---|---|
| CZT HV Monitor | 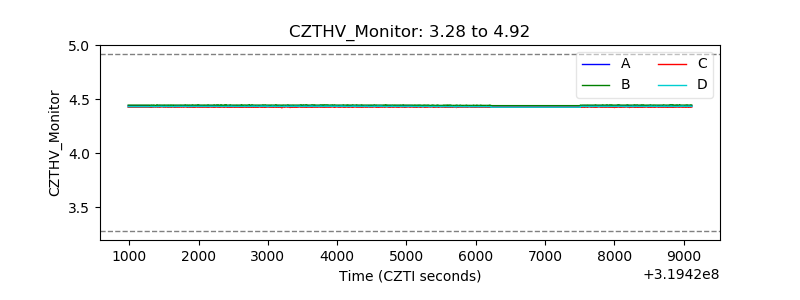 |
| D_VDD | 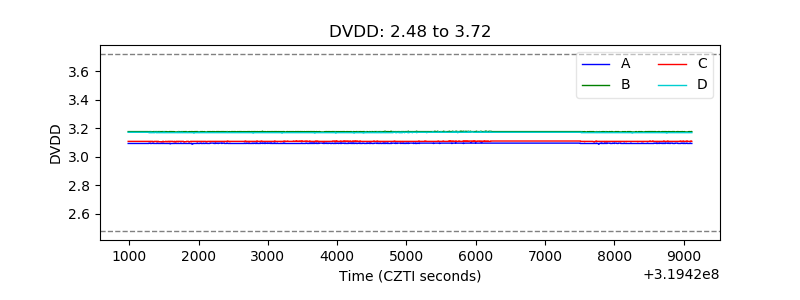 |
| Temperature 1 | 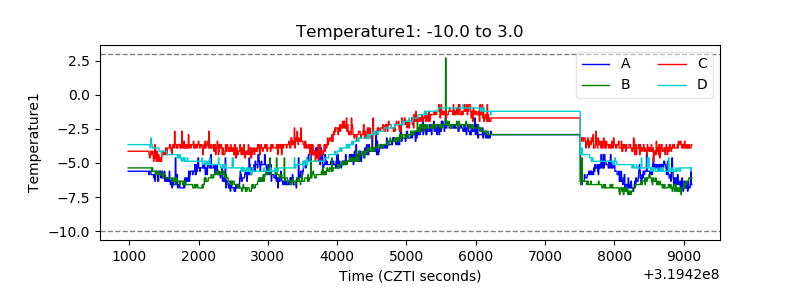 |
| Veto HV Monitor | 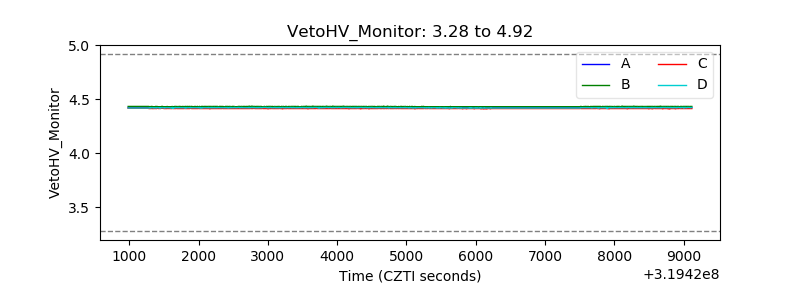 |
| Veto LLD | 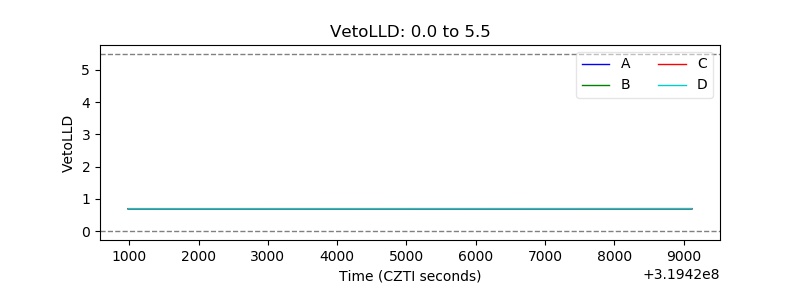 |
| Alpha Counter | 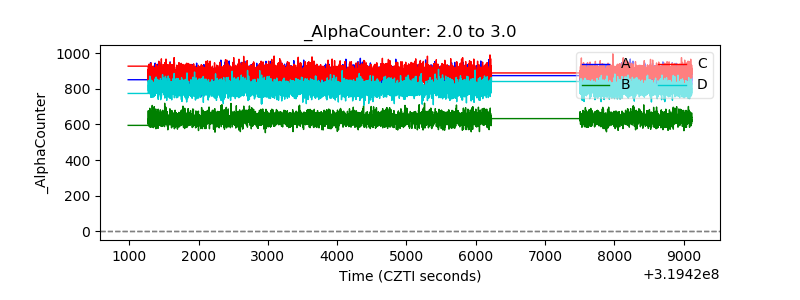 |
| _CPM_Rate | 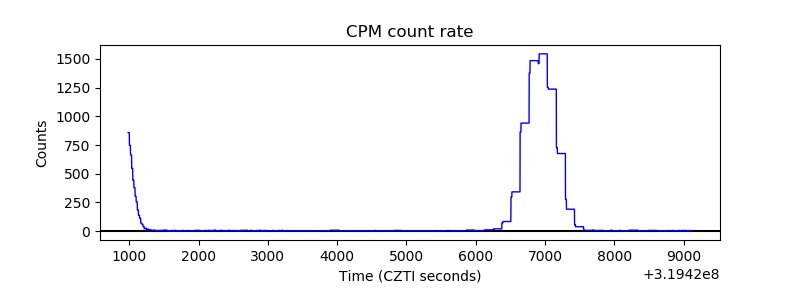 |
| CZT Counter | 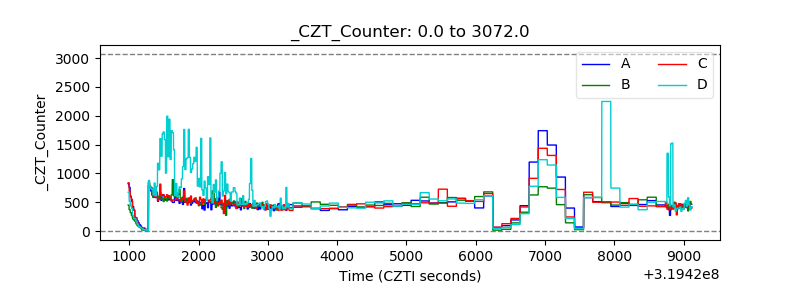 |
| +2.5 Volts monitor |  |
| +5 Volts monitor |  |
| _ROLL_ROT | 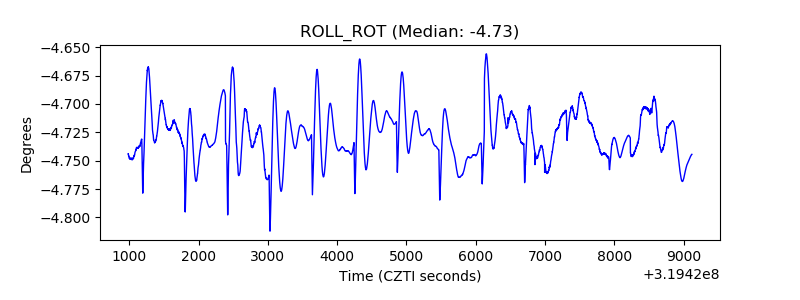 |
| _Roll_DEC | 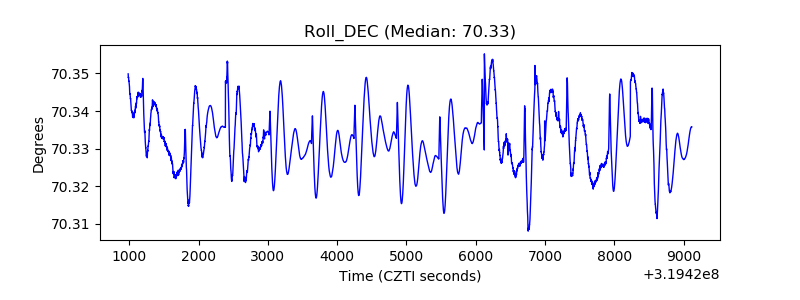 |
| _Roll_RA | 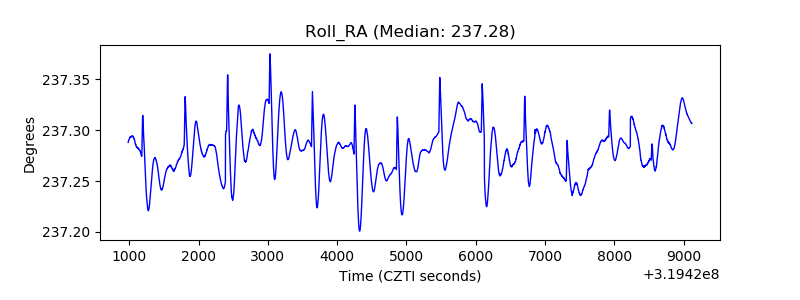 |
| Veto Counter | 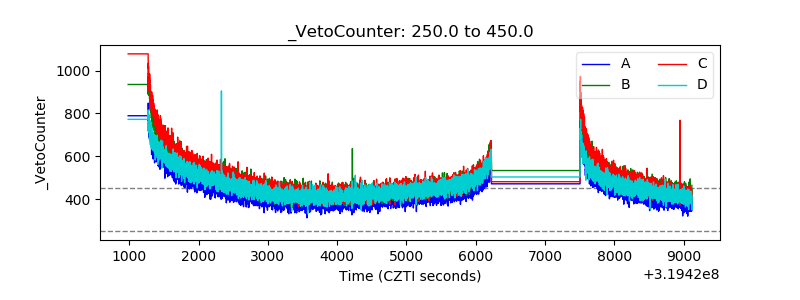 |