| Param | Original file | Final file |
|---|---|---|
| Filename | modeM0/AS1C05_012T03_9000003500_23697cztM0_level2.evt | modeM0/AS1C05_012T03_9000003500_23697cztM0_level2_quad_clean.evt |
| Size (bytes) | 448,148,160 | 109,906,560 |
| Size | 427.4 MB | 104.8 MB |
| Events in quadrant A | 3,078,218 | 719,477 |
| Events in quadrant B | 3,239,832 | 742,110 |
| Events in quadrant C | 3,135,053 | 714,784 |
| Events in quadrant D | 3,662,765 | 684,503 |
| Mode SS | |||
|---|---|---|---|
| Quadrant | BADHDUFLAG | Total packets | Discarded packets |
| A | 0 | 136 | 0 |
| B | 0 | 136 | 0 |
| C | 0 | 136 | 0 |
| D | 0 | 136 | 0 |
| Mode M9 | |||
|---|---|---|---|
| Quadrant | BADHDUFLAG | Total packets | Discarded packets |
| A | 0 | 15 | 0 |
| B | 0 | 16 | 0 |
| C | 0 | 16 | 0 |
| D | 0 | 16 | 0 |
| Mode M0 | |||
|---|---|---|---|
| Quadrant | BADHDUFLAG | Total packets | Discarded packets |
| A | 0 | 13713 | 2 |
| B | 0 | 14009 | 2 |
| C | 0 | 13777 | 2 |
| D | 0 | 15516 | 2 |
| Quadrant | Total seconds | Saturated seconds | Saturation percentage |
|---|---|---|---|
| A | 6711 | 13 | 0.193712% |
| B | 6711 | 28 | 0.417225% |
| C | 6711 | 52 | 0.774847% |
| D | 6711 | 112 | 1.668902% |
Noise dominated data is calculated using 1-second bins in cleaned event files. If a bin has >2000 counts, and if more than 50% of those come from <1% of pixels, then it is considered to be noise-dominated and hence unusable.
| Quadrant | # 1 sec bins | Bins with >0 counts | Bins with >2000 counts | High rate bins dominated by noise | Noise dominated (total time) | Noise dominated (detector-on time) | Marked lightcurve |
|---|---|---|---|---|---|---|---|
| A | 7801 | 6712 | 0 | 0 | 0.00% | 0.00% |  |
| B | 7801 | 6712 | 1 | 1 | 0.01% | 0.01% |  |
| C | 7801 | 6712 | 1 | 1 | 0.01% | 0.01% |  |
| D | 7801 | 6712 | 97 | 97 | 1.24% | 1.45% | 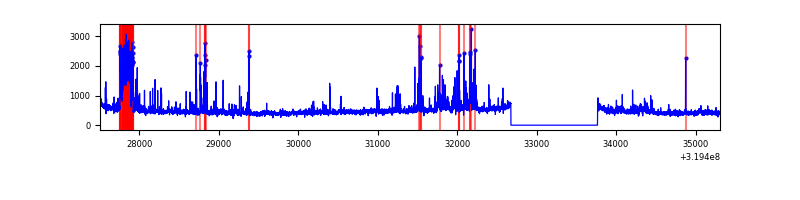 |
Top three noisy pixels from each quadrant. If the there are fewer than three noisy pixels in the level2.evt file, extra rows are filled as -1
| Pixel properties | Quadrant properties | ||||||
|---|---|---|---|---|---|---|---|
| Quadrant | DetID | PixID | Counts | Sigma | Mean | Median | Sigma |
| A | 13 | 254 | 11180 | 65.82 | 796 | 780 | 158.0 |
| A | 10 | 253 | 7769 | 44.23 | 796 | 780 | 158.0 |
| A | 3 | 137 | 6866 | 38.52 | 796 | 780 | 158.0 |
| B | 0 | 183 | 54791 | 362.01 | 801 | 782 | 149.2 |
| B | 12 | 111 | 18109 | 116.14 | 801 | 782 | 149.2 |
| B | 11 | 111 | 16203 | 103.36 | 801 | 782 | 149.2 |
| C | 14 | 238 | 124810 | 700.56 | 770 | 774 | 177.1 |
| C | 13 | 61 | 5259 | 25.33 | 770 | 774 | 177.1 |
| C | 10 | 23 | 4784 | 22.65 | 770 | 774 | 177.1 |
| D | 13 | 174 | 434444 | 2342.47 | 763 | 739 | 185.1 |
| D | 1 | 52 | 229670 | 1236.47 | 763 | 739 | 185.1 |
| D | 9 | 35 | 71380 | 381.53 | 763 | 739 | 185.1 |
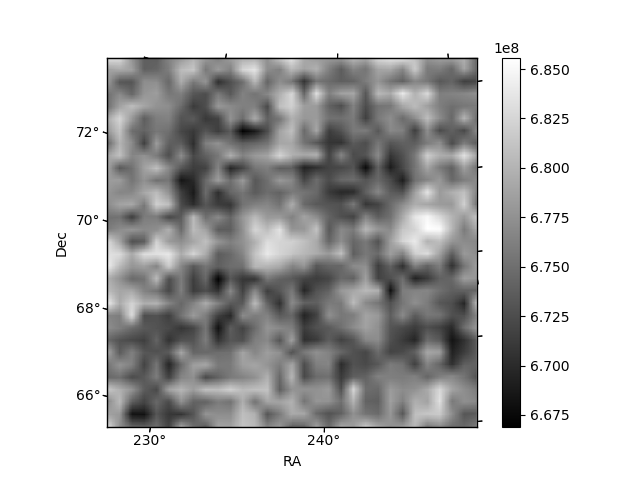
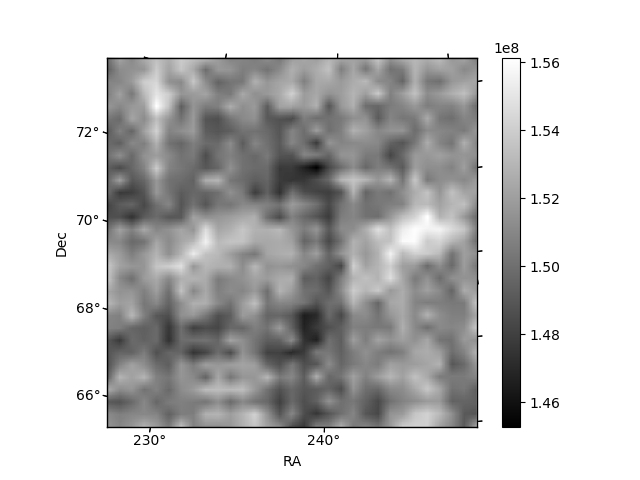
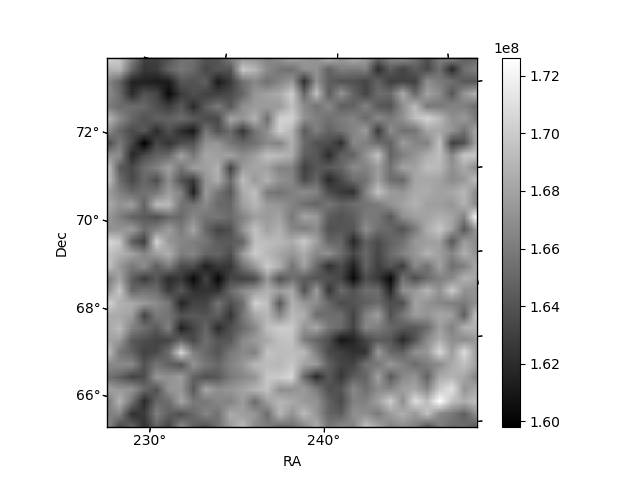
Histogram calculated using DETX and DETY for each event in the final _common_clean file
| Quadrant A | 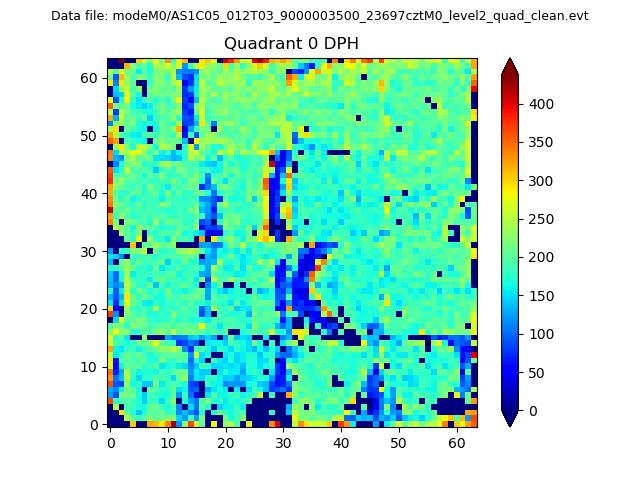 |
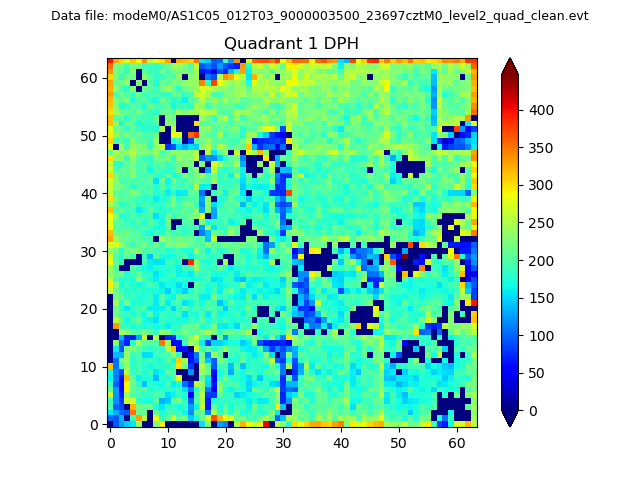 |
Quadrant B |
|---|---|---|---|
| Quadrant D |  |
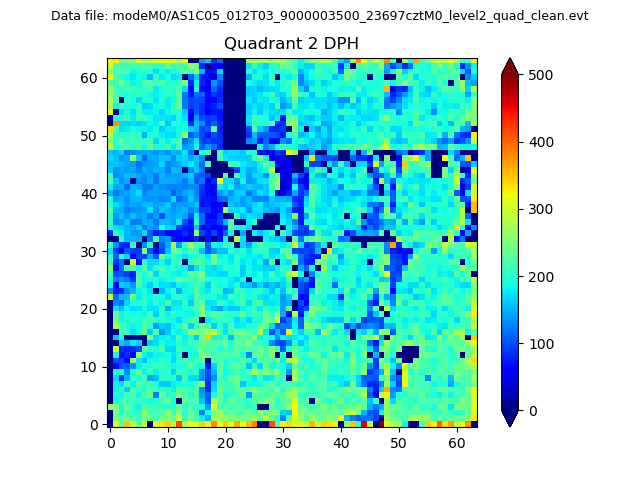 |
Quadrant C |
| Plot type | Count rate plots | Images |
|---|---|---|
| Comparison with Poisson distribution Blue bars denote a histogram of data divided into 1 sec bins. Red curve is a Poisson curve with rate = median count rate of data. |
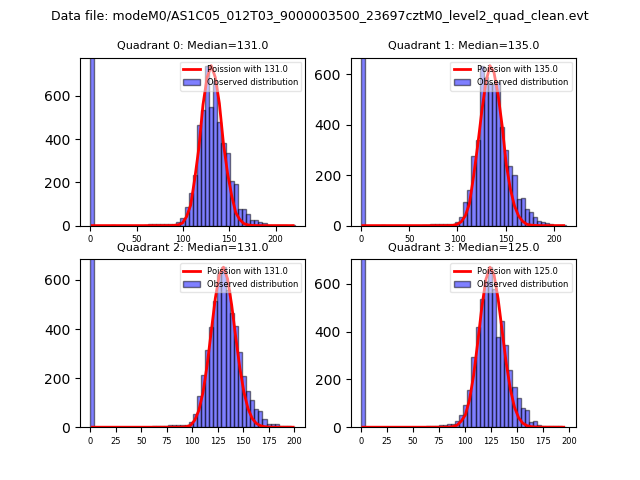 |
 |
| Quadrant-wise count rates Data is divided into 100 sec bins |
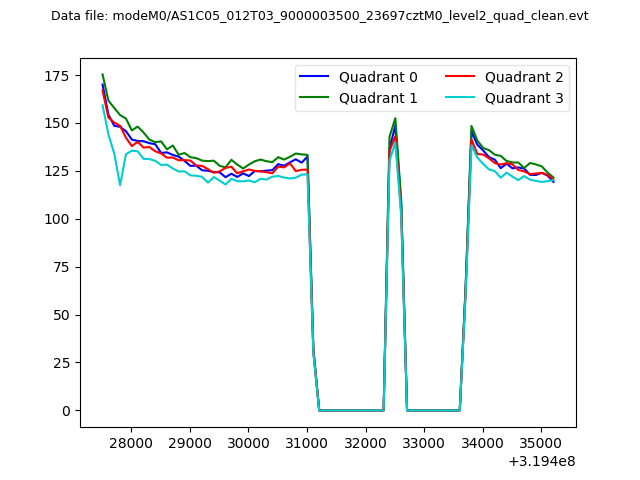 |
|
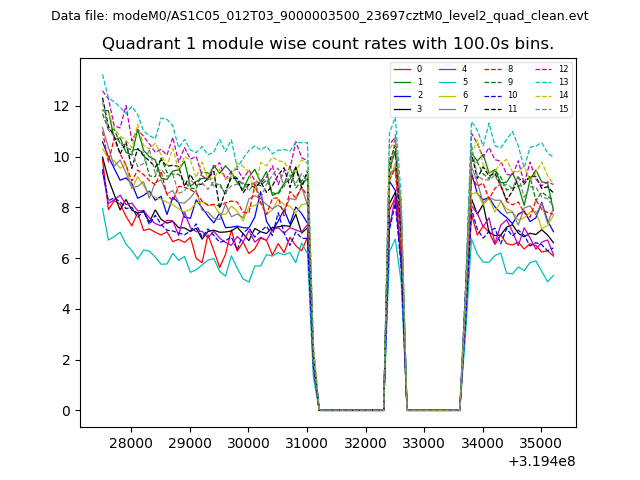
| Module-wise count rates for Quadrant A Data is divided into 100 sec bins |
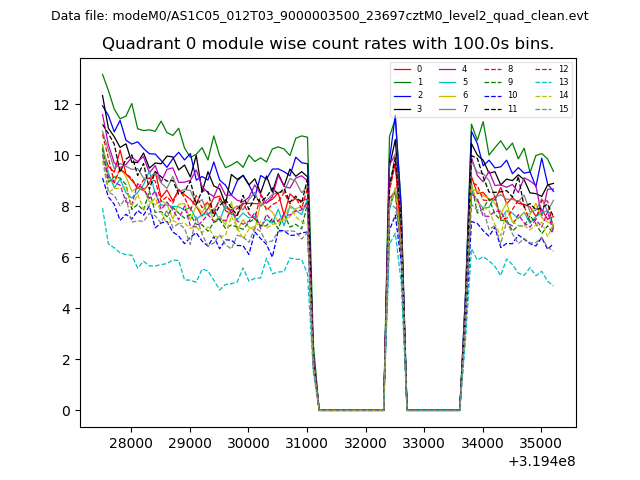 |
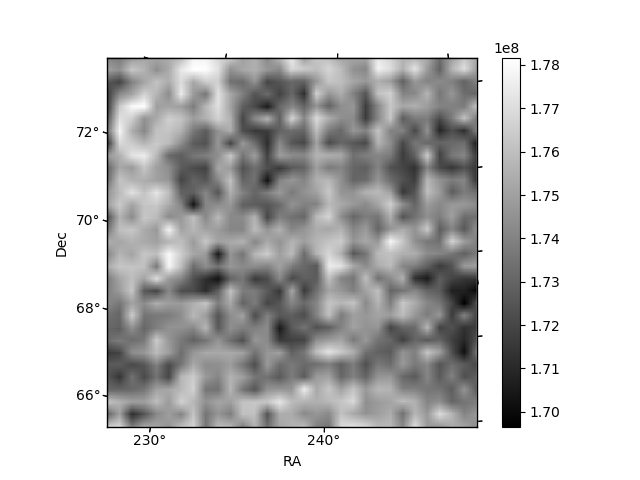 |
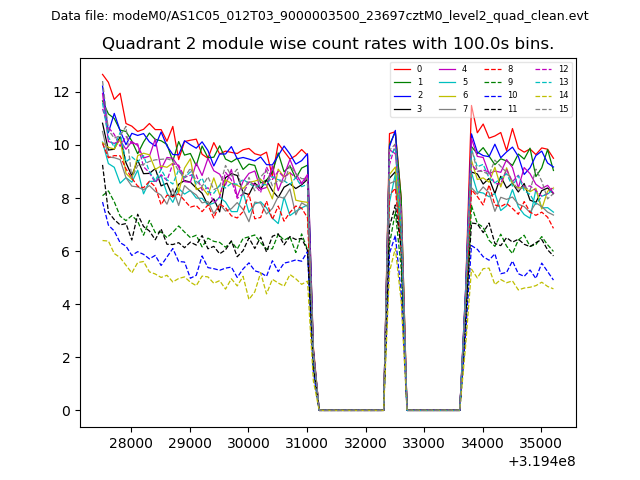
| Module-wise count rates for Quadrant B Data is divided into 100 sec bins |
 |
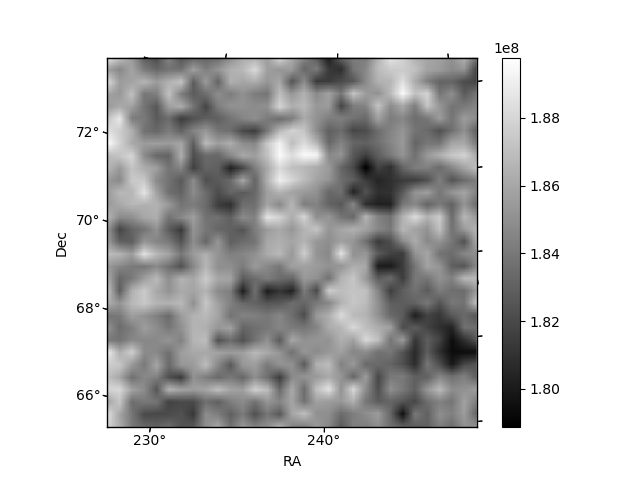 |
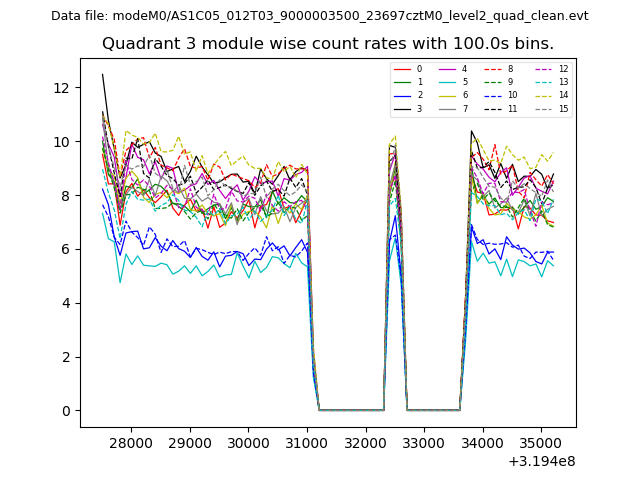
| Module-wise count rates for Quadrant C Data is divided into 100 sec bins |
 |
 |
| Module-wise count rates for Quadrant D Data is divided into 100 sec bins |
 |
 |
| Parameter | Plot |
|---|---|
| CZT HV Monitor | 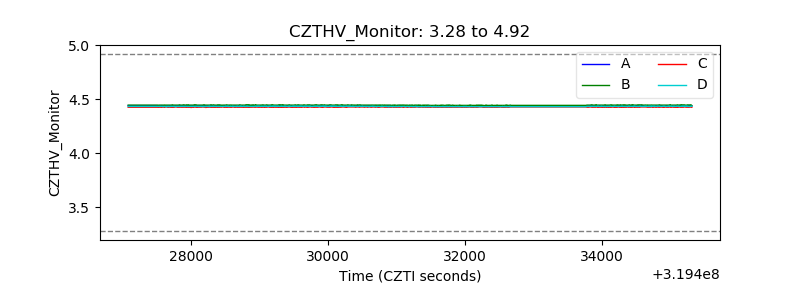 |
| D_VDD | 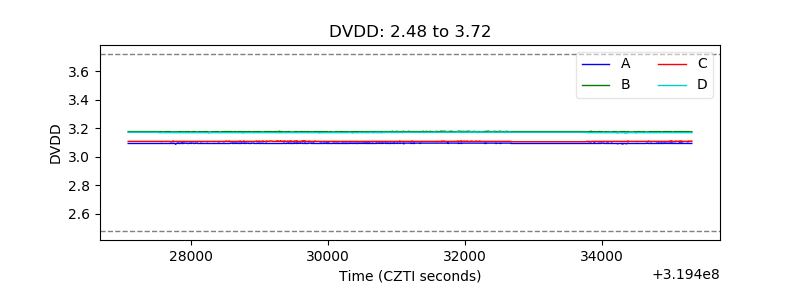 |
| Temperature 1 | 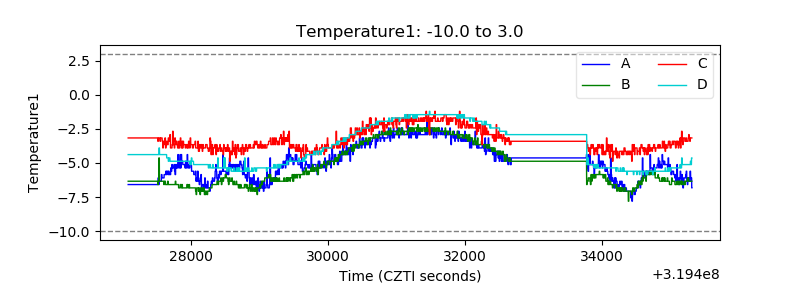 |
| Veto HV Monitor | 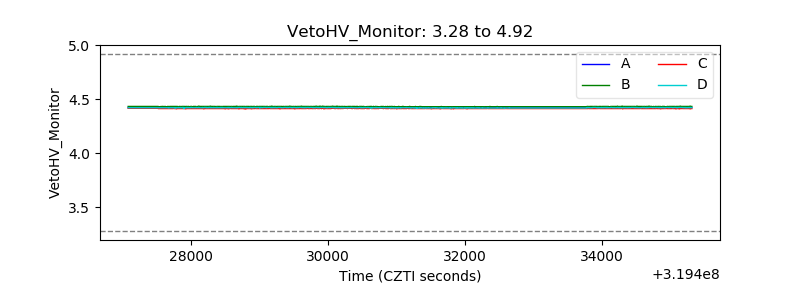 |
| Veto LLD |  |
| Alpha Counter | 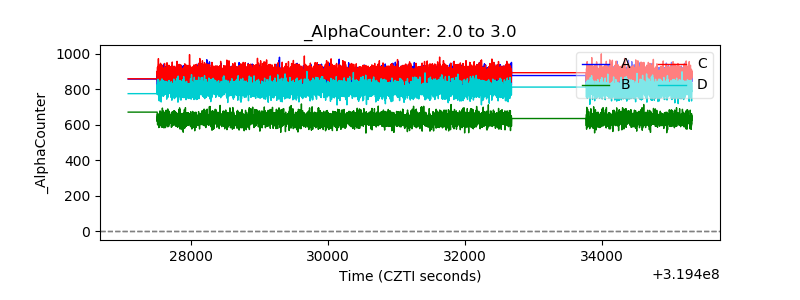 |
| _CPM_Rate | 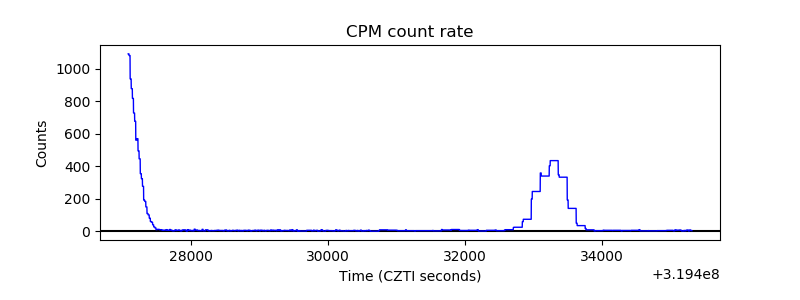 |
| CZT Counter | 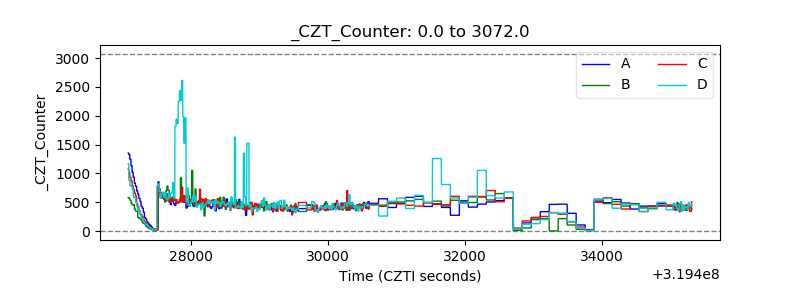 |
| +2.5 Volts monitor |  |
| +5 Volts monitor |  |
| _ROLL_ROT | 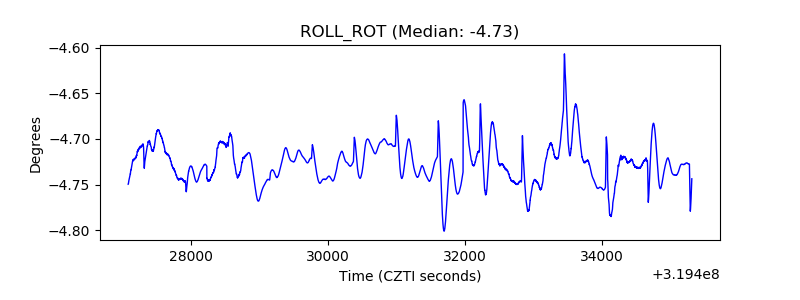 |
| _Roll_DEC | 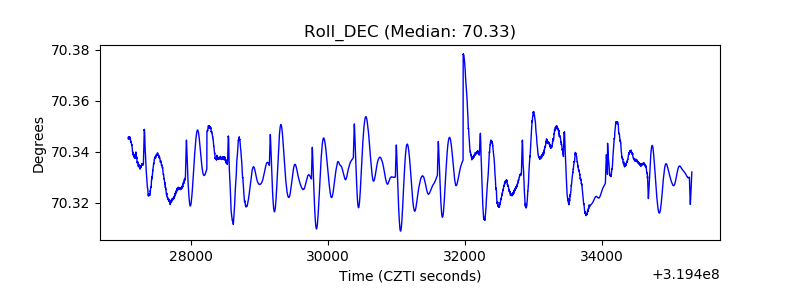 |
| _Roll_RA | 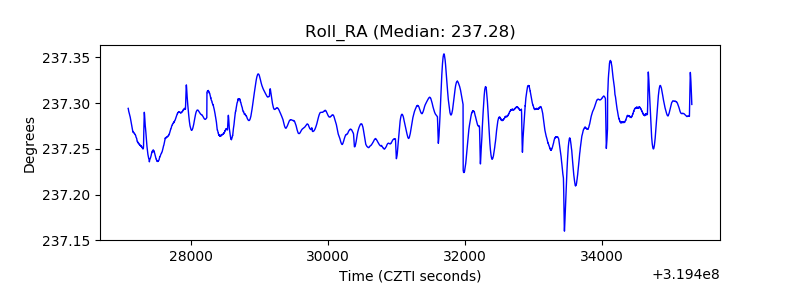 |
| Veto Counter | 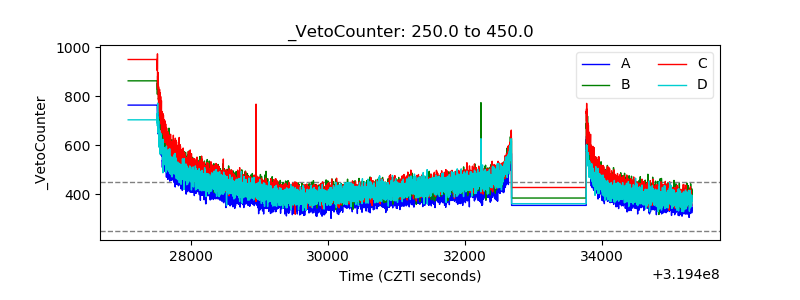 |