| Param | Original file | Final file |
|---|---|---|
| Filename | modeM0/AS1A07_054T01_9000003504_23700cztM0_level2.evt | modeM0/AS1A07_054T01_9000003504_23700cztM0_level2_quad_clean.evt |
| Size (bytes) | 59,333,760 | 17,326,080 |
| Size | 56.6 MB | 16.5 MB |
| Events in quadrant A | 420,622 | 112,941 |
| Events in quadrant B | 430,355 | 115,737 |
| Events in quadrant C | 417,802 | 112,662 |
| Events in quadrant D | 460,180 | 109,230 |
| Mode M0 | |||
|---|---|---|---|
| Quadrant | BADHDUFLAG | Total packets | Discarded packets |
| A | 0 | 1906 | 0 |
| B | 0 | 1912 | 0 |
| C | 0 | 1917 | 0 |
| D | 0 | 2018 | 0 |
| Mode SS | |||
|---|---|---|---|
| Quadrant | BADHDUFLAG | Total packets | Discarded packets |
| A | 0 | 18 | 0 |
| B | 0 | 18 | 0 |
| C | 0 | 18 | 0 |
| D | 0 | 18 | 0 |
| Quadrant | Total seconds | Saturated seconds | Saturation percentage |
|---|---|---|---|
| A | 952 | 0 | 0.000000% |
| B | 952 | 0 | 0.000000% |
| C | 952 | 4 | 0.420168% |
| D | 952 | 3 | 0.315126% |
Noise dominated data is calculated using 1-second bins in cleaned event files. If a bin has >2000 counts, and if more than 50% of those come from <1% of pixels, then it is considered to be noise-dominated and hence unusable.
| Quadrant | # 1 sec bins | Bins with >0 counts | Bins with >2000 counts | High rate bins dominated by noise | Noise dominated (total time) | Noise dominated (detector-on time) | Marked lightcurve |
|---|---|---|---|---|---|---|---|
| A | 952 | 952 | 0 | 0 | 0.00% | 0.00% | 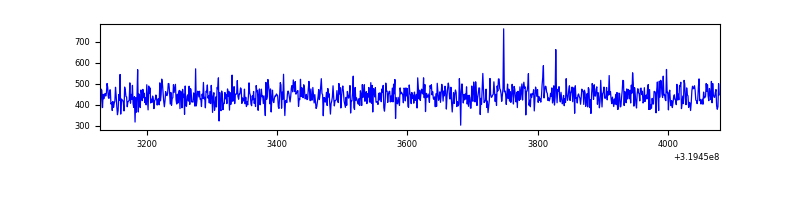 |
| B | 952 | 952 | 0 | 0 | 0.00% | 0.00% | 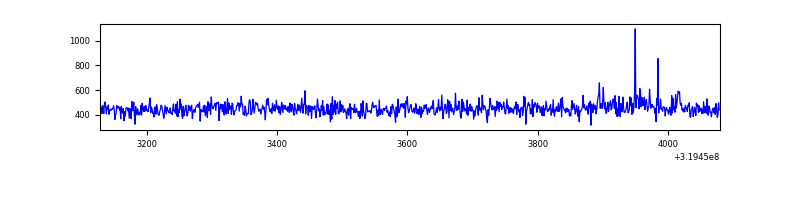 |
| C | 952 | 952 | 0 | 0 | 0.00% | 0.00% | 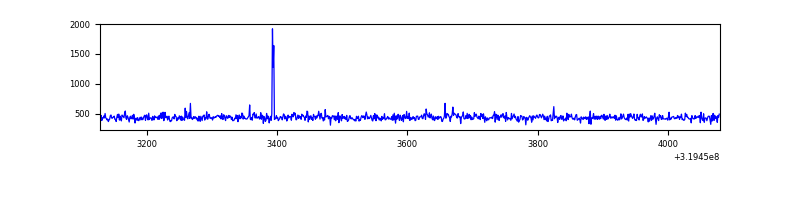 |
| D | 952 | 952 | 3 | 3 | 0.32% | 0.32% | 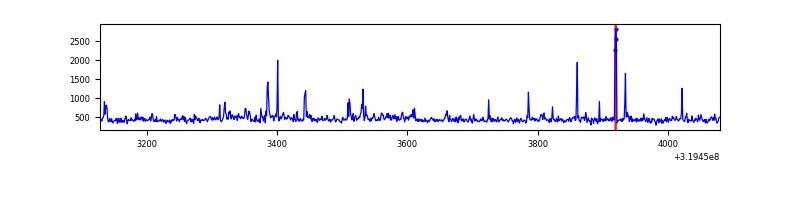 |
Top three noisy pixels from each quadrant. If the there are fewer than three noisy pixels in the level2.evt file, extra rows are filled as -1
| Pixel properties | Quadrant properties | ||||||
|---|---|---|---|---|---|---|---|
| Quadrant | DetID | PixID | Counts | Sigma | Mean | Median | Sigma |
| A | 13 | 254 | 1209 | 45.41 | 109 | 106 | 24.3 |
| A | 3 | 137 | 1038 | 38.37 | 109 | 106 | 24.3 |
| A | 0 | 226 | 917 | 33.39 | 109 | 106 | 24.3 |
| B | 0 | 228 | 4125 | 173.51 | 108 | 106 | 23.2 |
| B | 12 | 111 | 2709 | 112.38 | 108 | 106 | 23.2 |
| B | 11 | 111 | 2540 | 105.08 | 108 | 106 | 23.2 |
| C | 14 | 238 | 16628 | 649.55 | 101 | 102 | 25.4 |
| C | 10 | 23 | 3624 | 138.43 | 101 | 102 | 25.4 |
| C | 7 | 247 | 1729 | 63.95 | 101 | 102 | 25.4 |
| D | 1 | 52 | 66473 | 2475.72 | 102 | 99 | 26.8 |
| D | 2 | 234 | 4240 | 154.46 | 102 | 99 | 26.8 |
| D | 13 | 174 | 2984 | 107.61 | 102 | 99 | 26.8 |
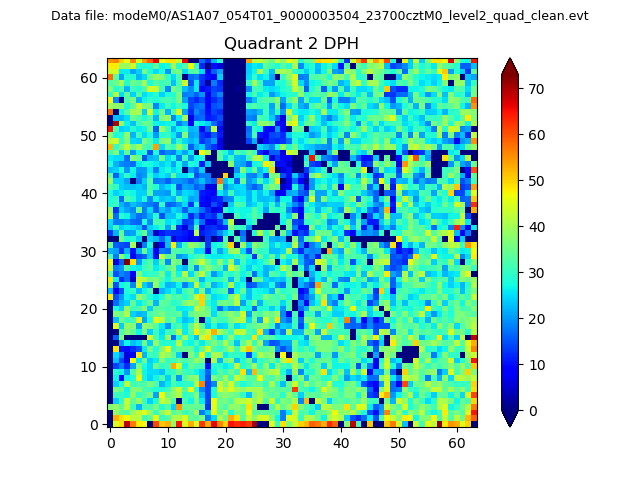
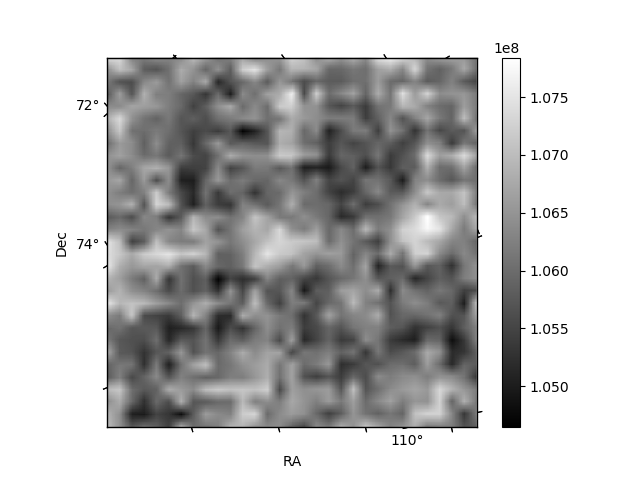
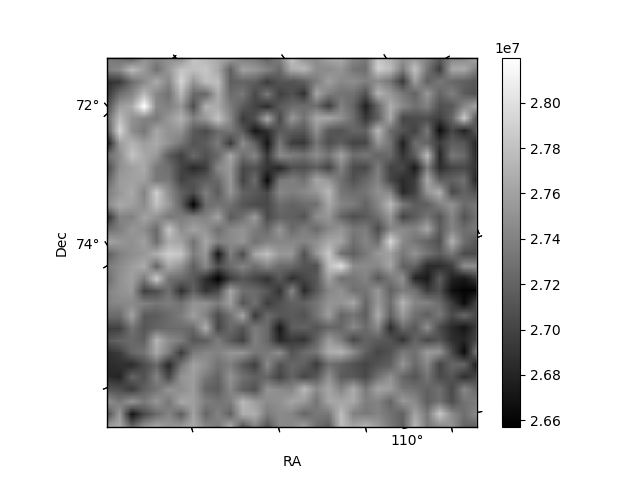
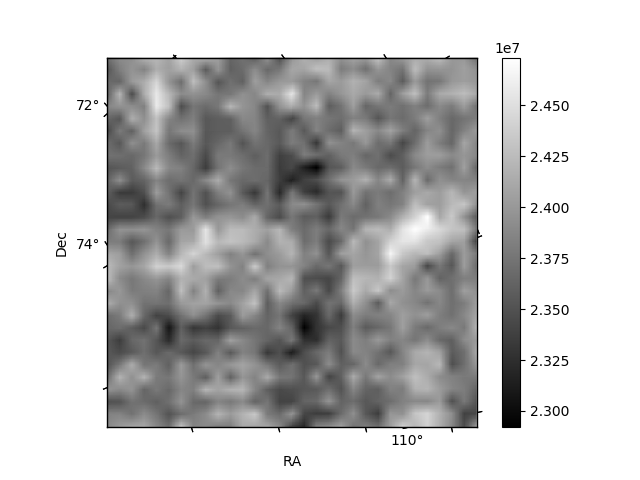
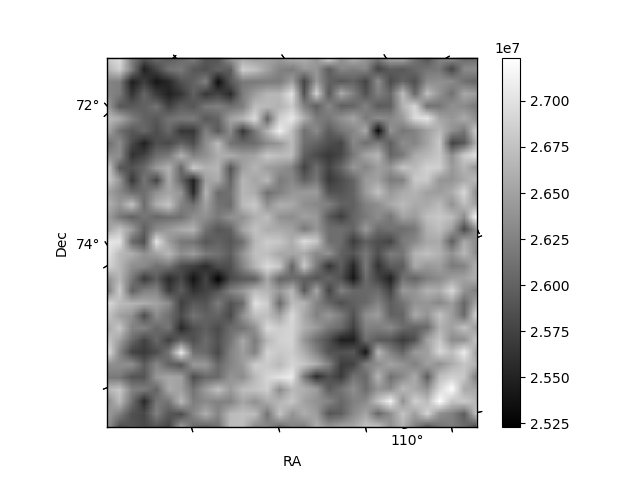
Histogram calculated using DETX and DETY for each event in the final _common_clean file
| Quadrant A | 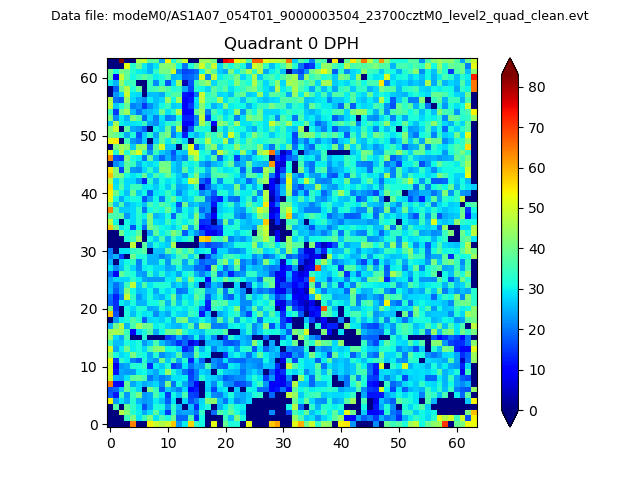 |
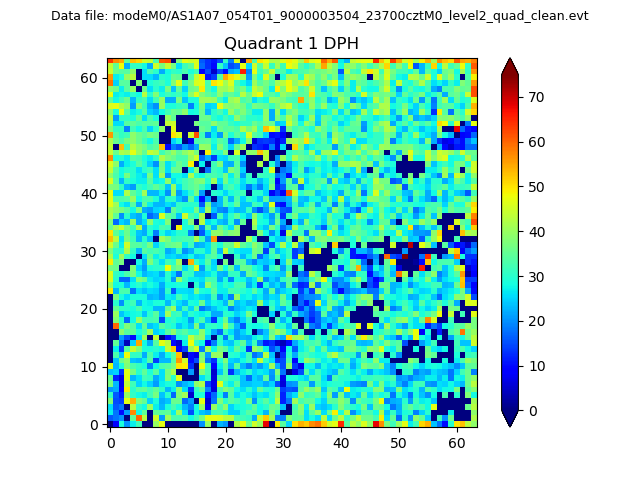 |
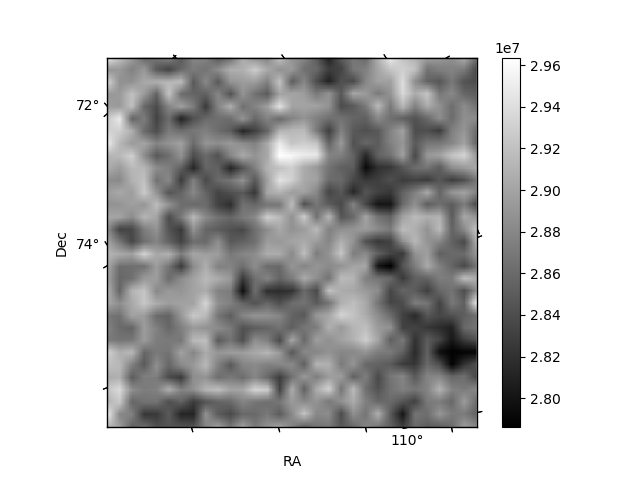
Quadrant B |
|---|---|---|---|
| Quadrant D | 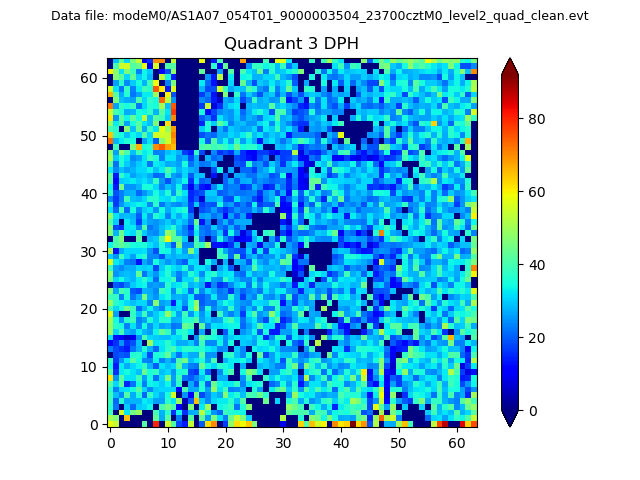 |
 |
Quadrant C |
| Plot type | Count rate plots | Images |
|---|---|---|
| Comparison with Poisson distribution Blue bars denote a histogram of data divided into 1 sec bins. Red curve is a Poisson curve with rate = median count rate of data. |
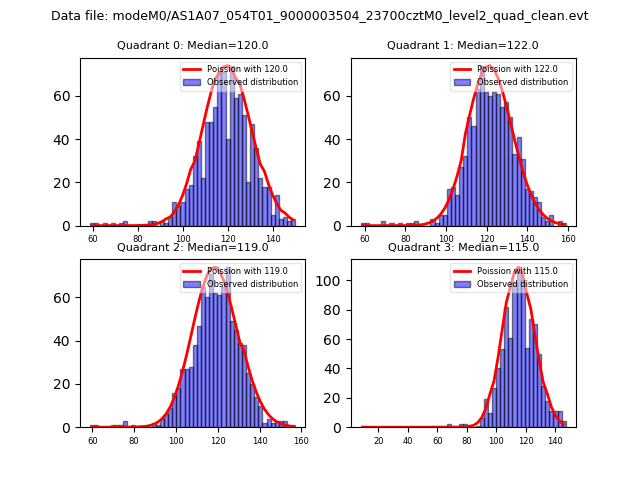 |
 |
| Quadrant-wise count rates Data is divided into 100 sec bins |
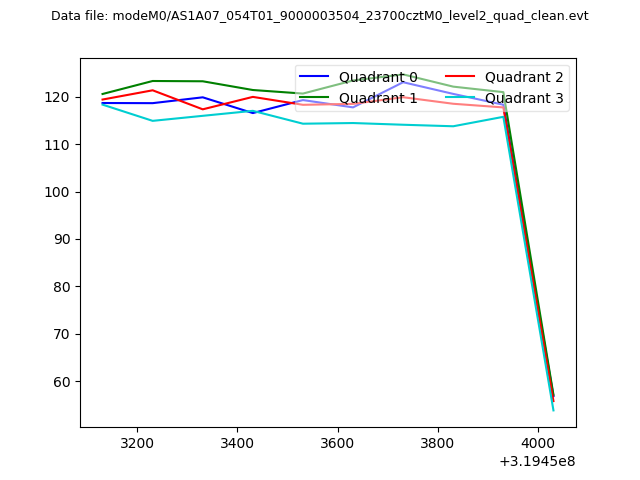 |
|
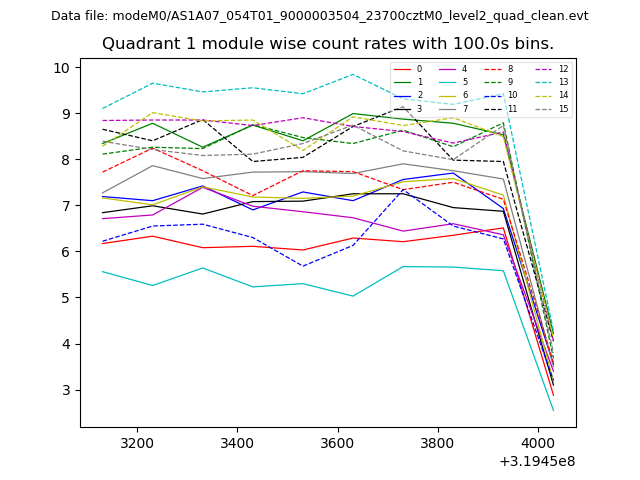
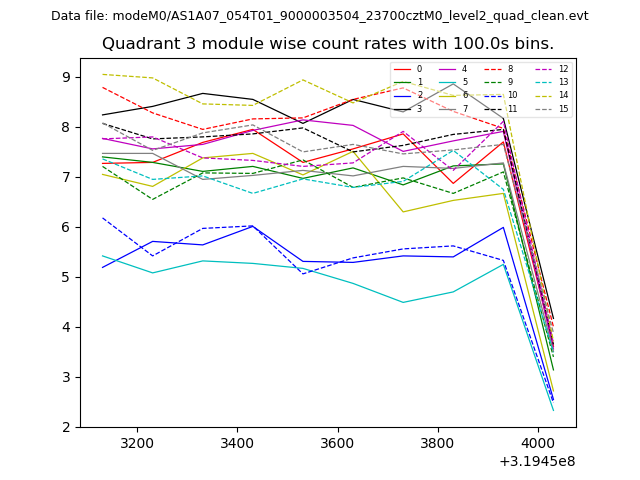
| Module-wise count rates for Quadrant A Data is divided into 100 sec bins |
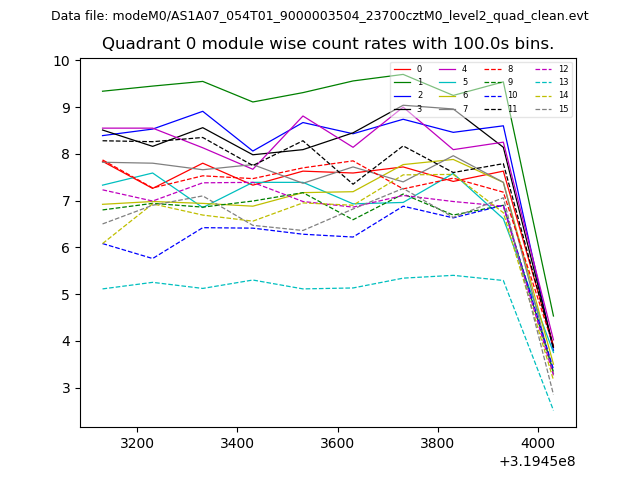 |
 |
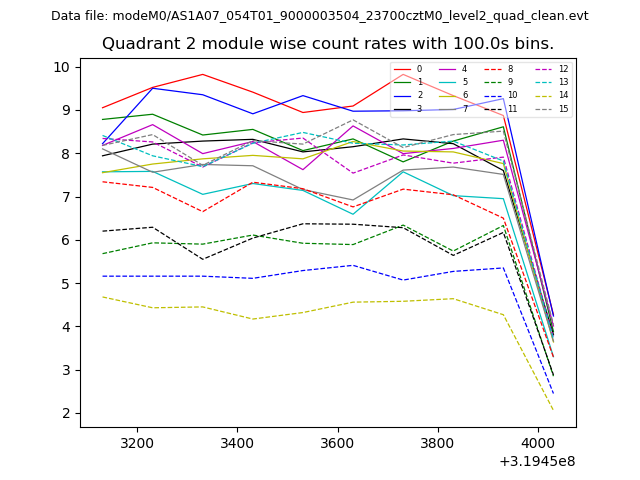
| Module-wise count rates for Quadrant B Data is divided into 100 sec bins |
 |
 |
| Module-wise count rates for Quadrant C Data is divided into 100 sec bins |
 |
 |
| Module-wise count rates for Quadrant D Data is divided into 100 sec bins |
 |
 |
| Parameter | Plot |
|---|---|
| CZT HV Monitor | 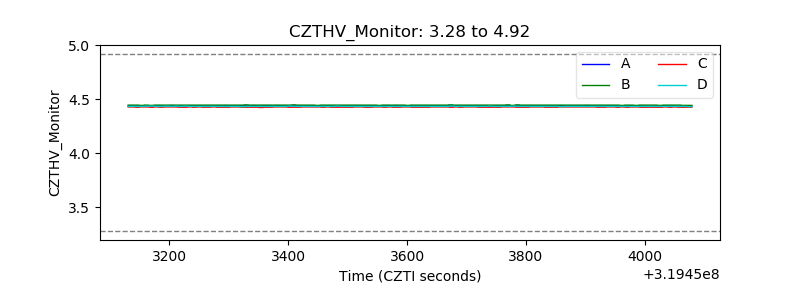 |
| D_VDD | 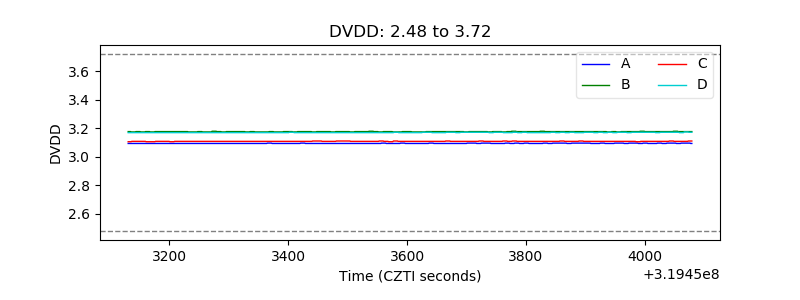 |
| Temperature 1 | 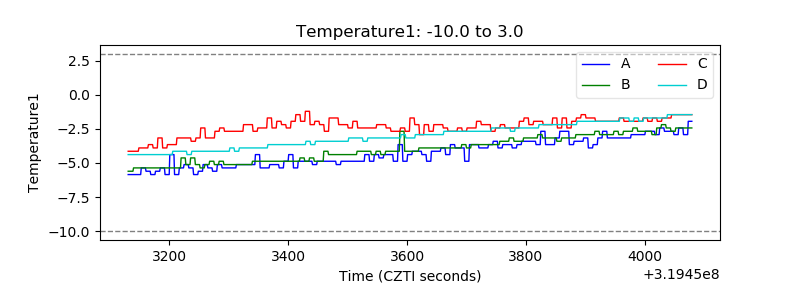 |
| Veto HV Monitor | 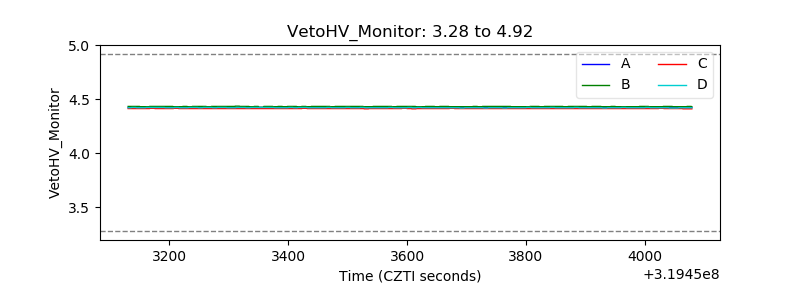 |
| Veto LLD | 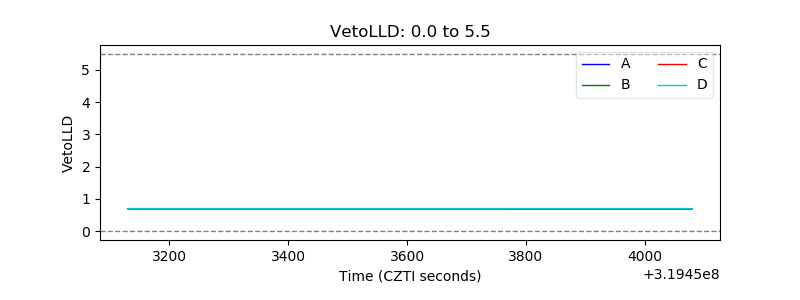 |
| Alpha Counter | 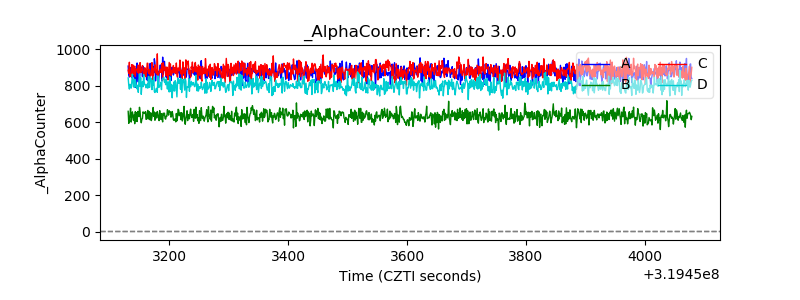 |
| _CPM_Rate | 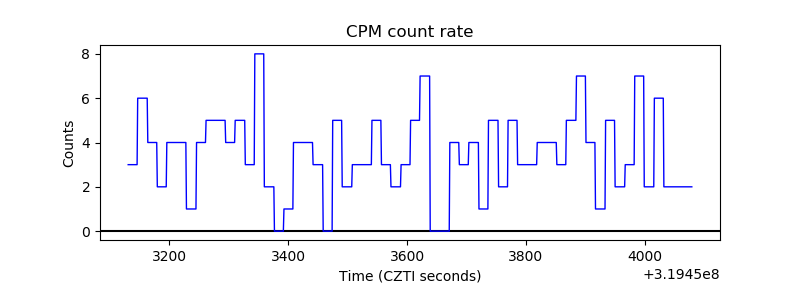 |
| CZT Counter | 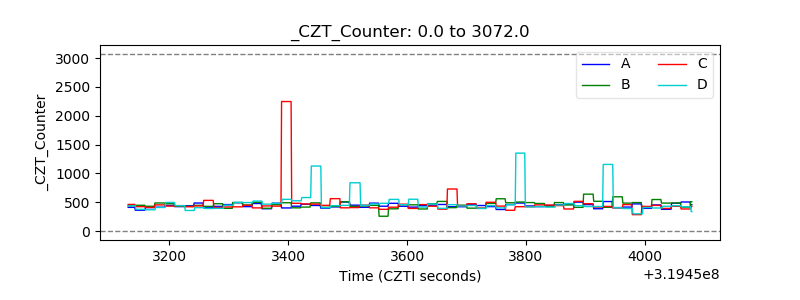 |
| +2.5 Volts monitor |  |
| +5 Volts monitor | 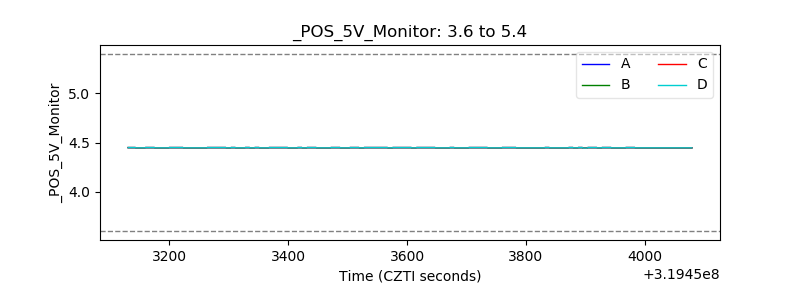 |
| _ROLL_ROT | 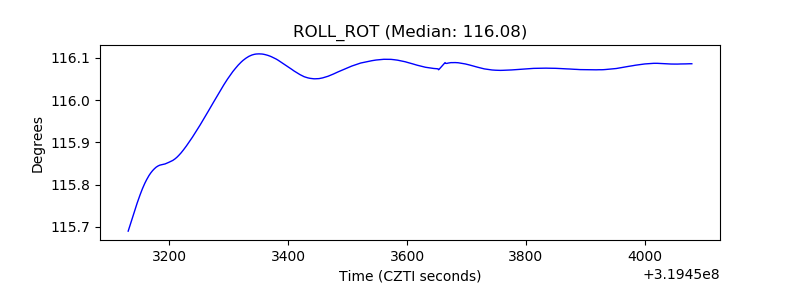 |
| _Roll_DEC | 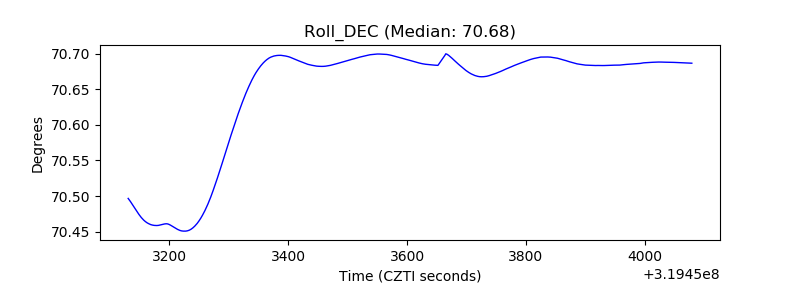 |
| _Roll_RA | 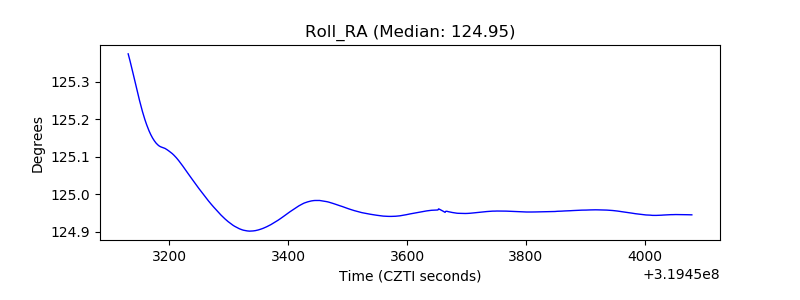 |
| Veto Counter | 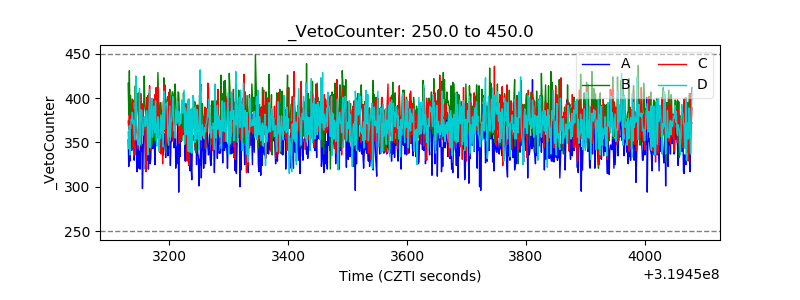 |