| Param | Original file | Final file |
|---|---|---|
| Filename | modeM0/AS1A07_054T01_9000003504_23701cztM0_level2.evt | modeM0/AS1A07_054T01_9000003504_23701cztM0_level2_quad_clean.evt |
| Size (bytes) | 321,094,080 | 87,431,040 |
| Size | 306.2 MB | 83.4 MB |
| Events in quadrant A | 2,103,458 | 594,962 |
| Events in quadrant B | 2,383,252 | 593,337 |
| Events in quadrant C | 2,145,698 | 569,477 |
| Events in quadrant D | 2,765,089 | 553,712 |
| Mode M0 | |||
|---|---|---|---|
| Quadrant | BADHDUFLAG | Total packets | Discarded packets |
| A | 0 | 9598 | 0 |
| B | 0 | 10167 | 0 |
| C | 0 | 9622 | 0 |
| D | 0 | 11338 | 0 |
| Mode SS | |||
|---|---|---|---|
| Quadrant | BADHDUFLAG | Total packets | Discarded packets |
| A | 0 | 96 | 0 |
| B | 0 | 96 | 0 |
| C | 0 | 96 | 0 |
| D | 0 | 96 | 0 |
| Quadrant | Total seconds | Saturated seconds | Saturation percentage |
|---|---|---|---|
| A | 4790 | 1 | 0.020877% |
| B | 4790 | 23 | 0.480167% |
| C | 4790 | 16 | 0.334029% |
| D | 4789 | 71 | 1.482564% |
Noise dominated data is calculated using 1-second bins in cleaned event files. If a bin has >2000 counts, and if more than 50% of those come from <1% of pixels, then it is considered to be noise-dominated and hence unusable.
| Quadrant | # 1 sec bins | Bins with >0 counts | Bins with >2000 counts | High rate bins dominated by noise | Noise dominated (total time) | Noise dominated (detector-on time) | Marked lightcurve |
|---|---|---|---|---|---|---|---|
| A | 4790 | 4790 | 0 | 0 | 0.00% | 0.00% | 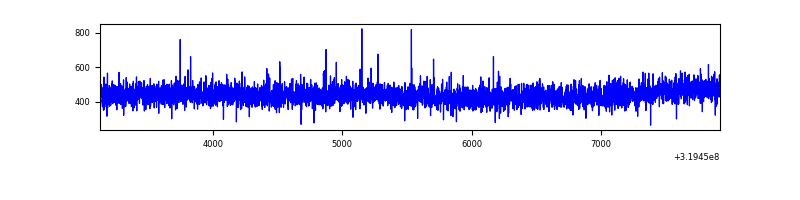 |
| B | 4790 | 4790 | 17 | 17 | 0.35% | 0.35% | 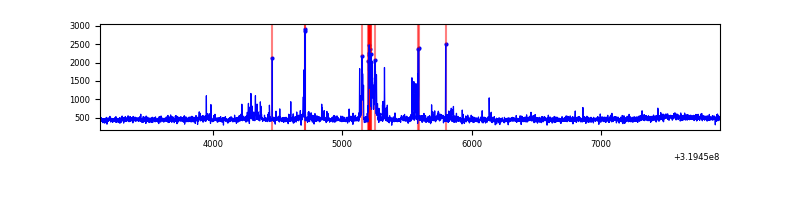 |
| C | 4790 | 4790 | 0 | 0 | 0.00% | 0.00% | 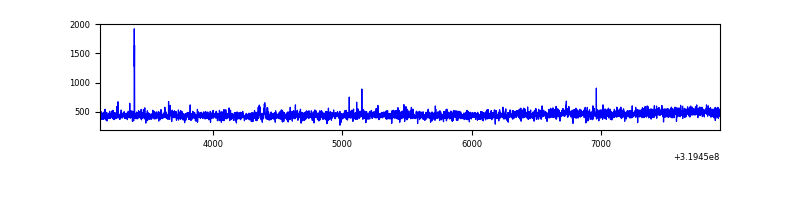 |
| D | 4789 | 4789 | 57 | 57 | 1.19% | 1.19% | 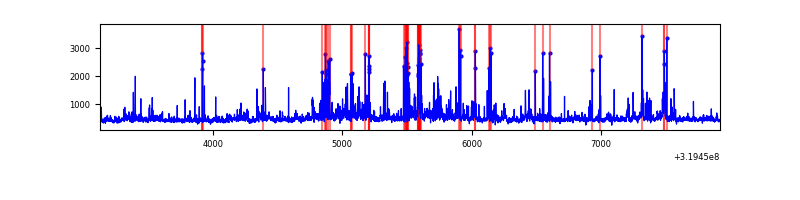 |
Top three noisy pixels from each quadrant. If the there are fewer than three noisy pixels in the level2.evt file, extra rows are filled as -1
| Pixel properties | Quadrant properties | ||||||
|---|---|---|---|---|---|---|---|
| Quadrant | DetID | PixID | Counts | Sigma | Mean | Median | Sigma |
| A | 13 | 254 | 7555 | 63.18 | 545 | 533 | 111.1 |
| A | 3 | 137 | 4783 | 38.24 | 545 | 533 | 111.1 |
| A | 0 | 226 | 4630 | 36.86 | 545 | 533 | 111.1 |
| B | 7 | 219 | 103649 | 992.78 | 543 | 529 | 103.9 |
| B | 7 | 235 | 29516 | 279.07 | 543 | 529 | 103.9 |
| B | 15 | 33 | 25547 | 240.86 | 543 | 529 | 103.9 |
| C | 14 | 238 | 84326 | 681.96 | 524 | 527 | 122.9 |
| C | 7 | 247 | 9393 | 72.15 | 524 | 527 | 122.9 |
| C | 3 | 233 | 4409 | 31.59 | 524 | 527 | 122.9 |
| D | 1 | 52 | 583176 | 4557.68 | 526 | 509 | 127.8 |
| D | 13 | 174 | 100977 | 785.87 | 526 | 509 | 127.8 |
| D | 7 | 38 | 39860 | 307.81 | 526 | 509 | 127.8 |
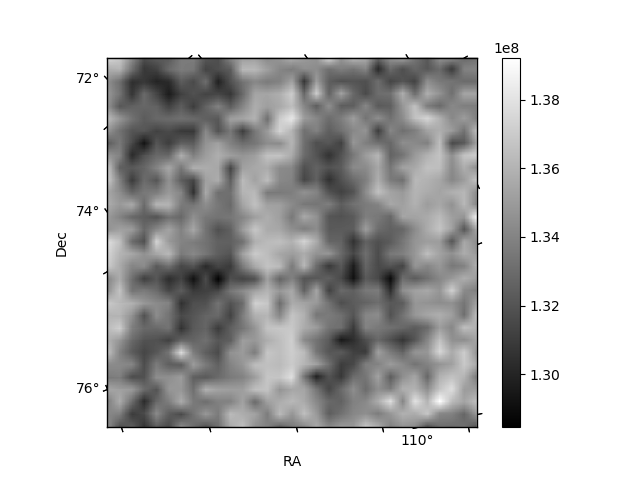
Histogram calculated using DETX and DETY for each event in the final _common_clean file
| Quadrant A |  |
 |
Quadrant B |
|---|---|---|---|
| Quadrant D |  |
 |
Quadrant C |
| Plot type | Count rate plots | Images |
|---|---|---|
| Comparison with Poisson distribution Blue bars denote a histogram of data divided into 1 sec bins. Red curve is a Poisson curve with rate = median count rate of data. |
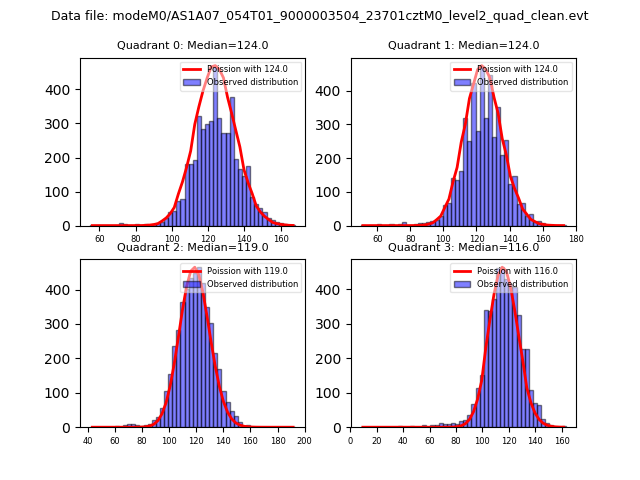 |
 |
| Quadrant-wise count rates Data is divided into 100 sec bins |
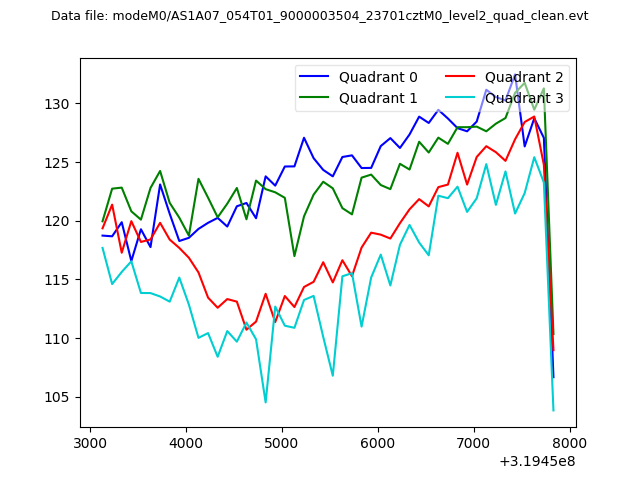 |
|
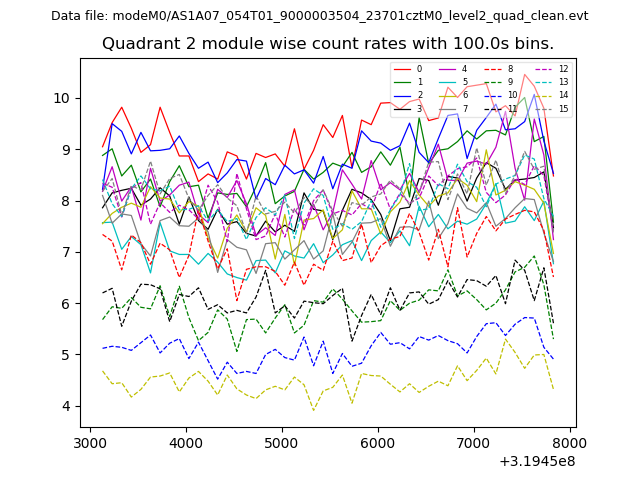
| Module-wise count rates for Quadrant A Data is divided into 100 sec bins |
 |
 |
| Module-wise count rates for Quadrant B Data is divided into 100 sec bins |
 |
 |
| Module-wise count rates for Quadrant C Data is divided into 100 sec bins |
 |
 |
| Module-wise count rates for Quadrant D Data is divided into 100 sec bins |
 |
 |
| Parameter | Plot |
|---|---|
| CZT HV Monitor | 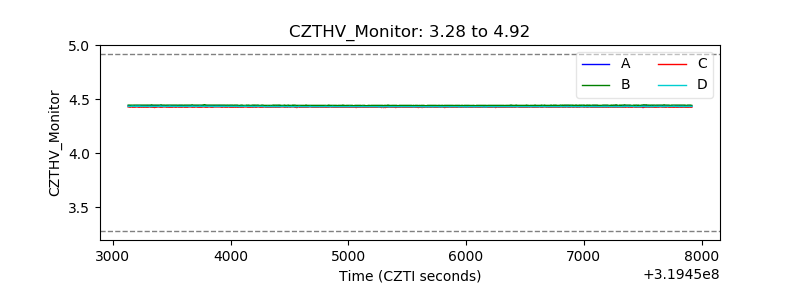 |
| D_VDD |  |
| Temperature 1 |  |
| Veto HV Monitor |  |
| Veto LLD |  |
| Alpha Counter | 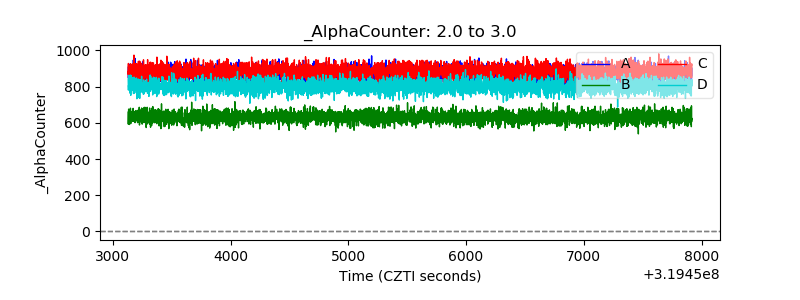 |
| _CPM_Rate | 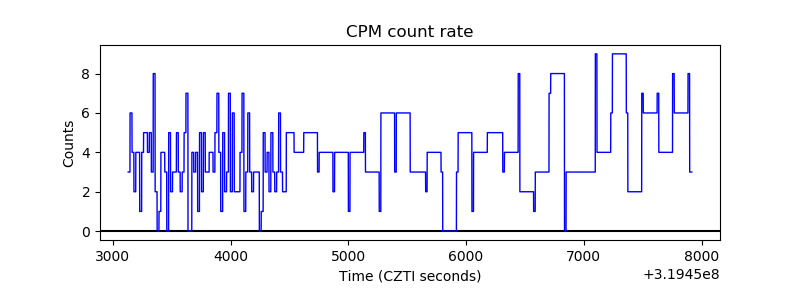 |
| CZT Counter |  |
| +2.5 Volts monitor |  |
| +5 Volts monitor |  |
| _ROLL_ROT |  |
| _Roll_DEC |  |
| _Roll_RA |  |
| Veto Counter |  |