| Param | Original file | Final file |
|---|---|---|
| Filename | modeM0/AS1A07_054T01_9000003504_23704cztM0_level2.evt | modeM0/AS1A07_054T01_9000003504_23704cztM0_level2_quad_clean.evt |
| Size (bytes) | 504,627,840 | 112,129,920 |
| Size | 481.3 MB | 106.9 MB |
| Events in quadrant A | 2,769,351 | 780,359 |
| Events in quadrant B | 5,543,030 | 715,188 |
| Events in quadrant C | 2,849,467 | 750,311 |
| Events in quadrant D | 3,710,685 | 728,019 |
| Mode M0 | |||
|---|---|---|---|
| Quadrant | BADHDUFLAG | Total packets | Discarded packets |
| A | 0 | 12361 | 1 |
| B | 0 | 20497 | 1 |
| C | 0 | 12479 | 1 |
| D | 0 | 15186 | 2 |
| Mode SS | |||
|---|---|---|---|
| Quadrant | BADHDUFLAG | Total packets | Discarded packets |
| A | 0 | 124 | 0 |
| B | 0 | 124 | 0 |
| C | 0 | 124 | 0 |
| D | 0 | 124 | 0 |
| Mode M9 | |||
|---|---|---|---|
| Quadrant | BADHDUFLAG | Total packets | Discarded packets |
| A | 0 | 9 | 0 |
| B | 0 | 9 | 0 |
| C | 0 | 9 | 0 |
| D | 0 | 9 | 0 |
| Quadrant | Total seconds | Saturated seconds | Saturation percentage |
|---|---|---|---|
| A | 6035 | 42 | 0.695940% |
| B | 6035 | 1015 | 16.818558% |
| C | 6035 | 84 | 1.391881% |
| D | 6035 | 119 | 1.971831% |
Noise dominated data is calculated using 1-second bins in cleaned event files. If a bin has >2000 counts, and if more than 50% of those come from <1% of pixels, then it is considered to be noise-dominated and hence unusable.
| Quadrant | # 1 sec bins | Bins with >0 counts | Bins with >2000 counts | High rate bins dominated by noise | Noise dominated (total time) | Noise dominated (detector-on time) | Marked lightcurve |
|---|---|---|---|---|---|---|---|
| A | 6970 | 6035 | 0 | 0 | 0.00% | 0.00% | 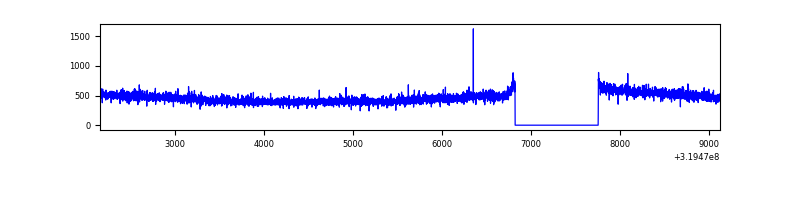 |
| B | 6970 | 6035 | 857 | 857 | 12.30% | 14.20% | 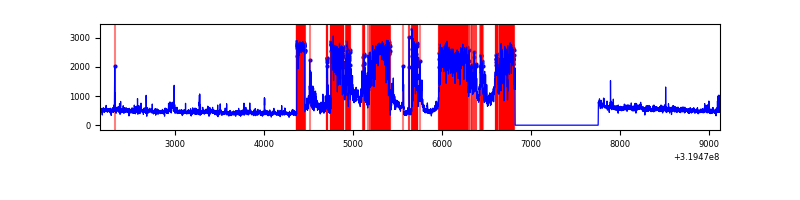 |
| C | 6970 | 6035 | 2 | 2 | 0.03% | 0.03% | 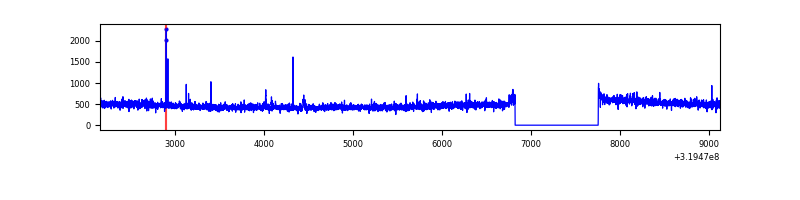 |
| D | 6970 | 6035 | 83 | 83 | 1.19% | 1.38% | 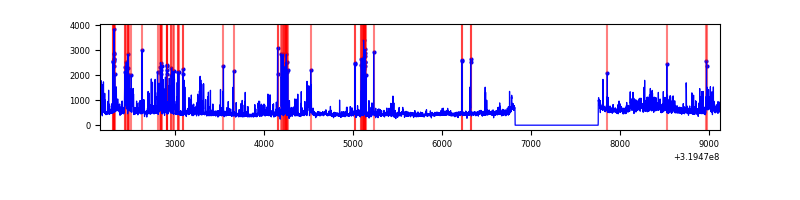 |
Top three noisy pixels from each quadrant. If the there are fewer than three noisy pixels in the level2.evt file, extra rows are filled as -1
| Pixel properties | Quadrant properties | ||||||
|---|---|---|---|---|---|---|---|
| Quadrant | DetID | PixID | Counts | Sigma | Mean | Median | Sigma |
| A | 13 | 254 | 9056 | 58.37 | 718 | 703 | 143.1 |
| A | 3 | 137 | 6286 | 39.01 | 718 | 703 | 143.1 |
| A | 0 | 226 | 6150 | 38.06 | 718 | 703 | 143.1 |
| B | 14 | 207 | 2820029 | 22265.39 | 666 | 649 | 126.6 |
| B | 0 | 229 | 28253 | 218.0 | 666 | 649 | 126.6 |
| B | 15 | 33 | 24916 | 191.64 | 666 | 649 | 126.6 |
| C | 14 | 238 | 110647 | 677.79 | 693 | 697 | 162.2 |
| C | 0 | 207 | 17637 | 104.43 | 693 | 697 | 162.2 |
| C | 7 | 247 | 14821 | 87.07 | 693 | 697 | 162.2 |
| D | 1 | 52 | 809642 | 4762.9 | 697 | 678 | 169.8 |
| D | 9 | 85 | 112077 | 655.88 | 697 | 678 | 169.8 |
| D | 13 | 174 | 70257 | 409.66 | 697 | 678 | 169.8 |
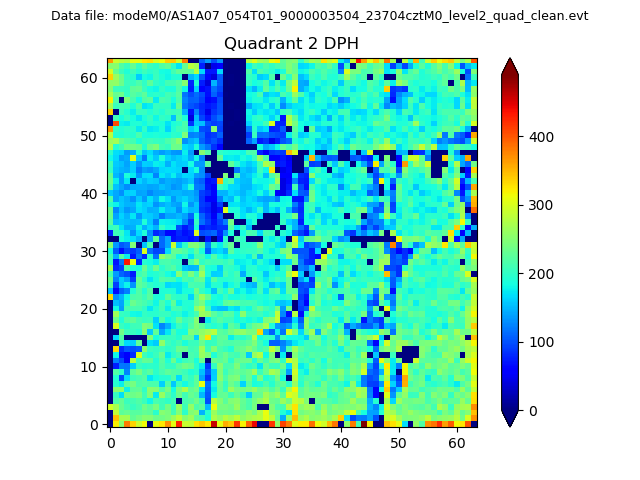
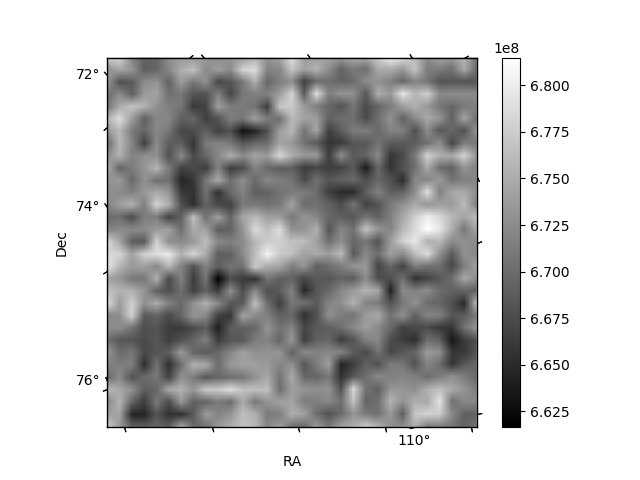
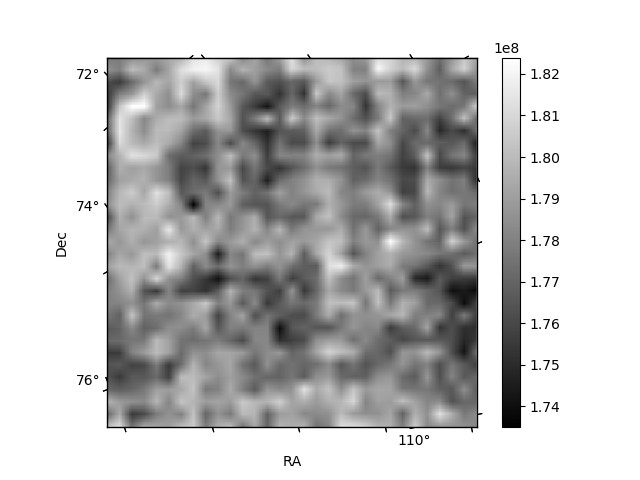
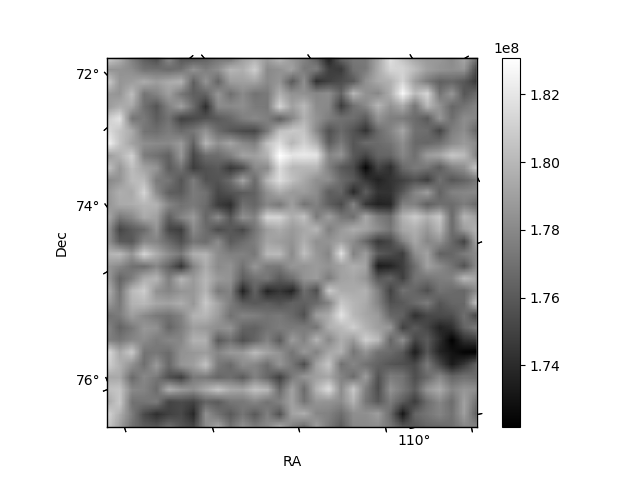
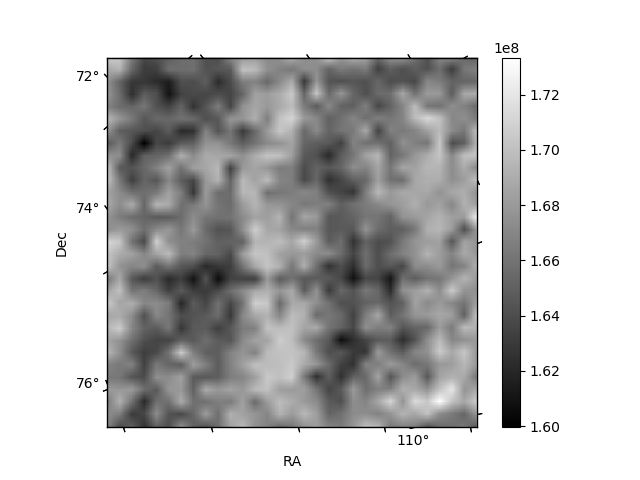
Histogram calculated using DETX and DETY for each event in the final _common_clean file
| Quadrant A | 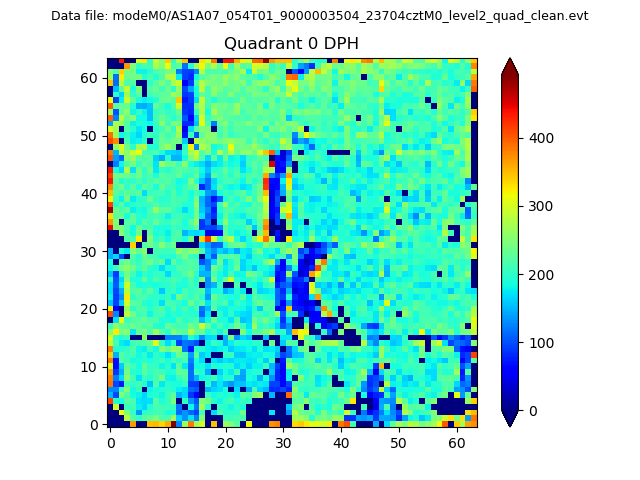 |
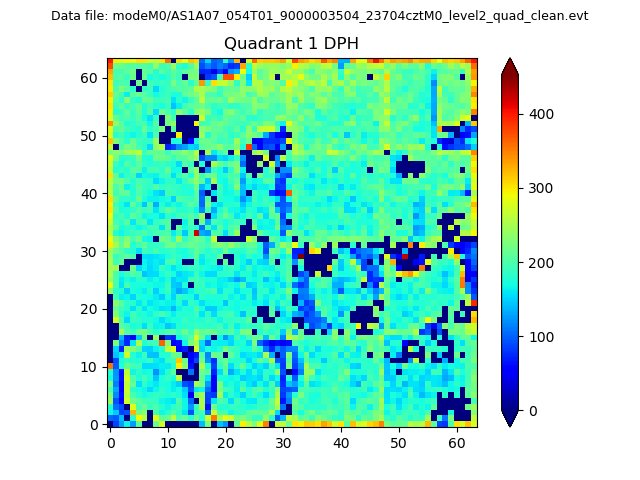 |
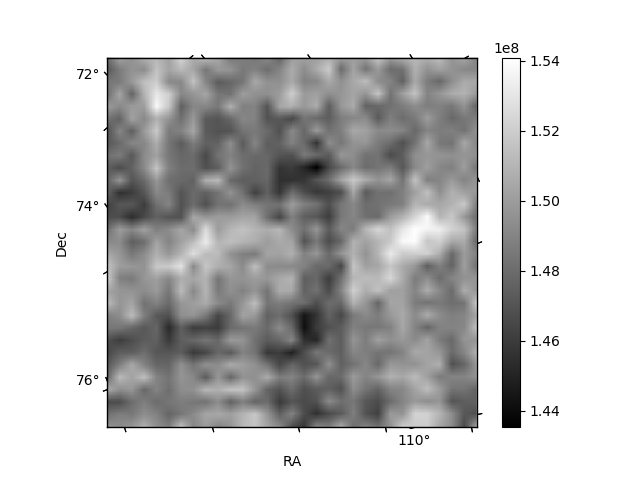
Quadrant B |
|---|---|---|---|
| Quadrant D | 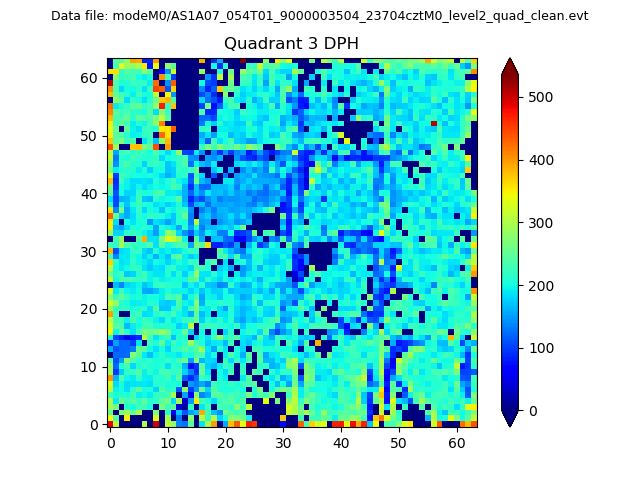 |
 |
Quadrant C |
| Plot type | Count rate plots | Images |
|---|---|---|
| Comparison with Poisson distribution Blue bars denote a histogram of data divided into 1 sec bins. Red curve is a Poisson curve with rate = median count rate of data. |
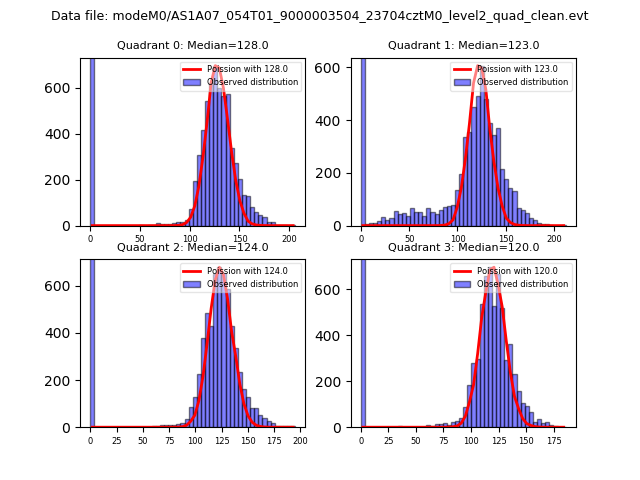 |
 |
| Quadrant-wise count rates Data is divided into 100 sec bins |
 |
|
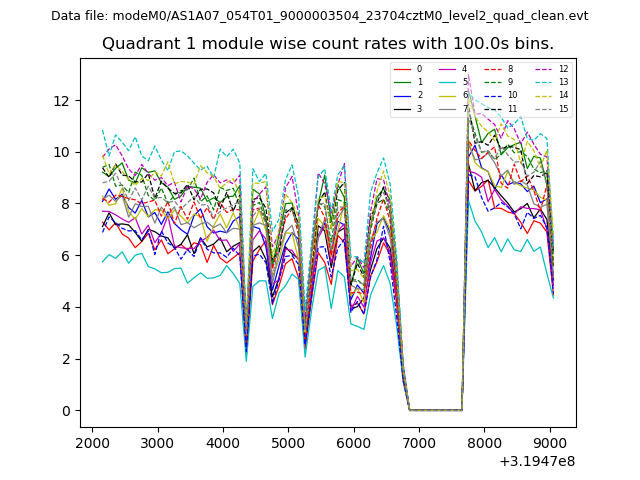
| Module-wise count rates for Quadrant A Data is divided into 100 sec bins |
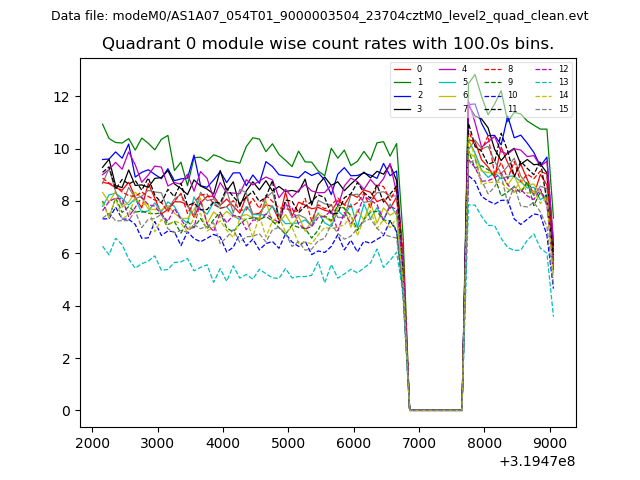 |
 |
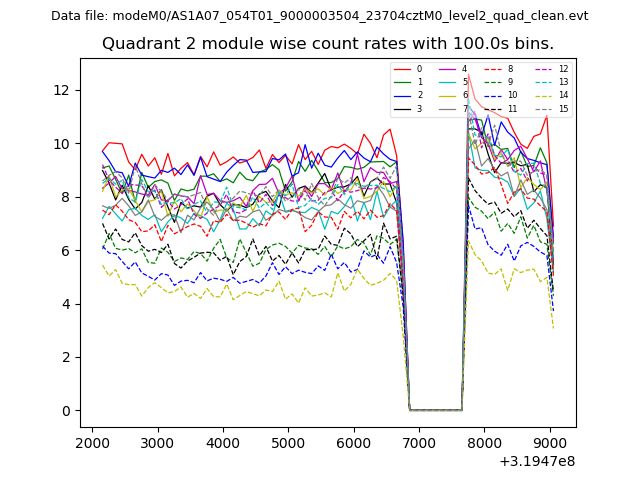
| Module-wise count rates for Quadrant B Data is divided into 100 sec bins |
 |
 |
| Module-wise count rates for Quadrant C Data is divided into 100 sec bins |
 |
 |
| Module-wise count rates for Quadrant D Data is divided into 100 sec bins |
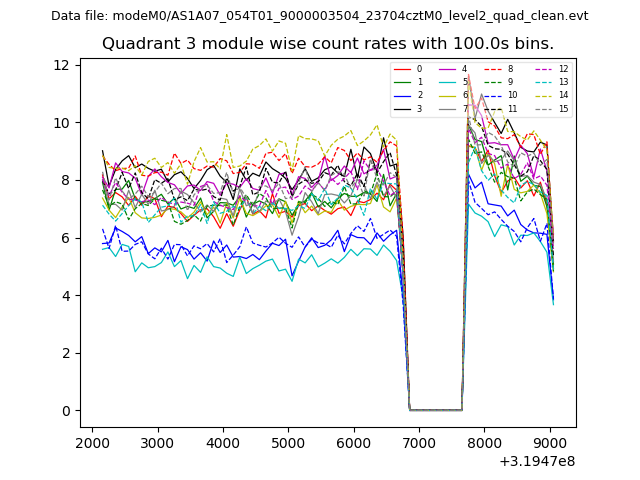 |
 |
| Parameter | Plot |
|---|---|
| CZT HV Monitor | 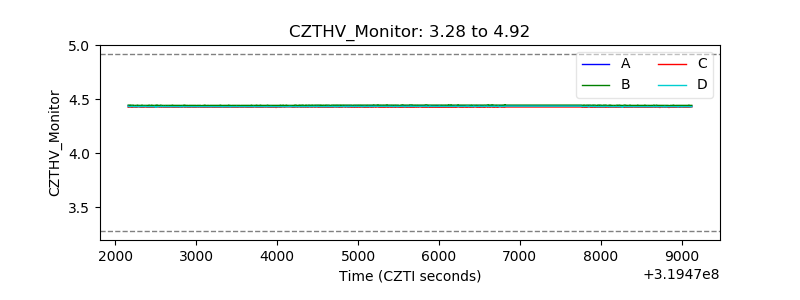 |
| D_VDD | 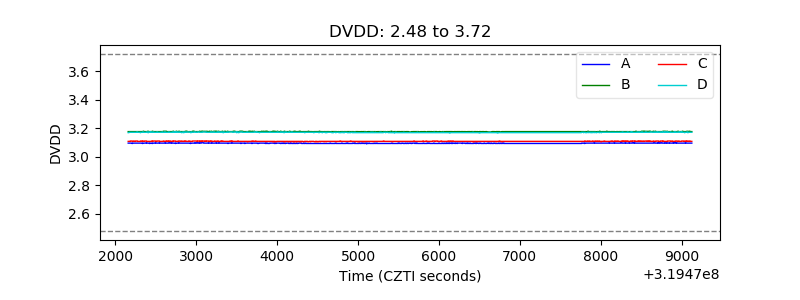 |
| Temperature 1 | 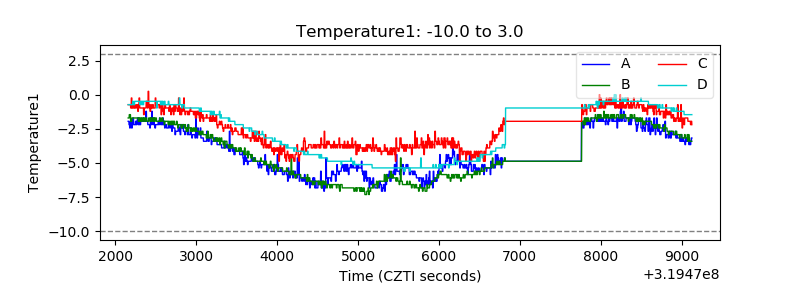 |
| Veto HV Monitor | 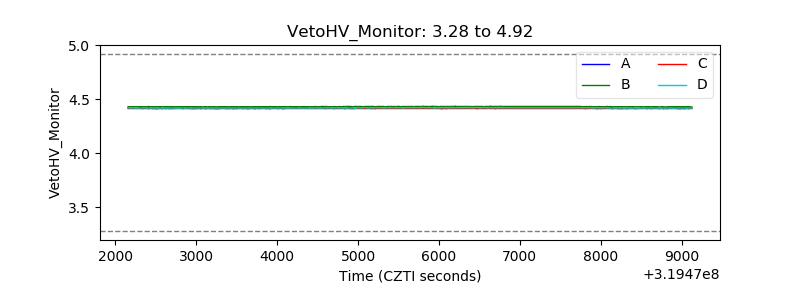 |
| Veto LLD | 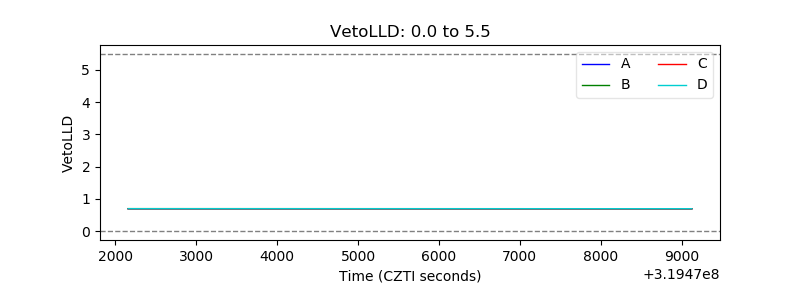 |
| Alpha Counter | 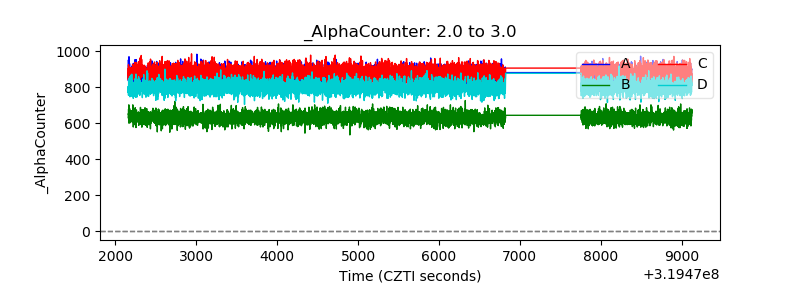 |
| _CPM_Rate | 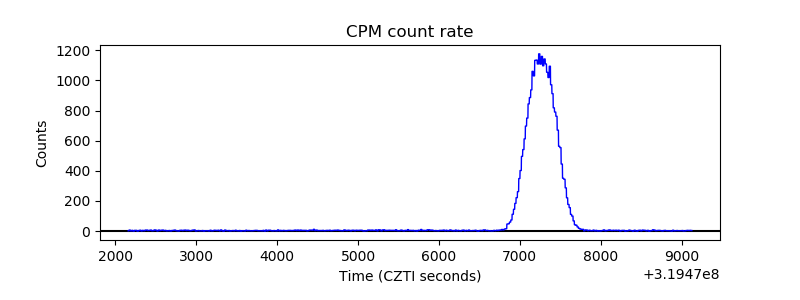 |
| CZT Counter | 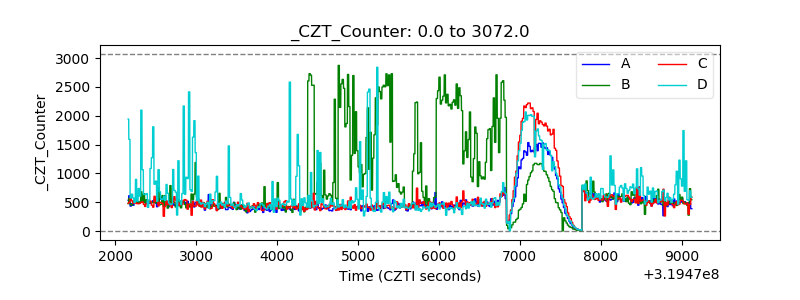 |
| +2.5 Volts monitor | 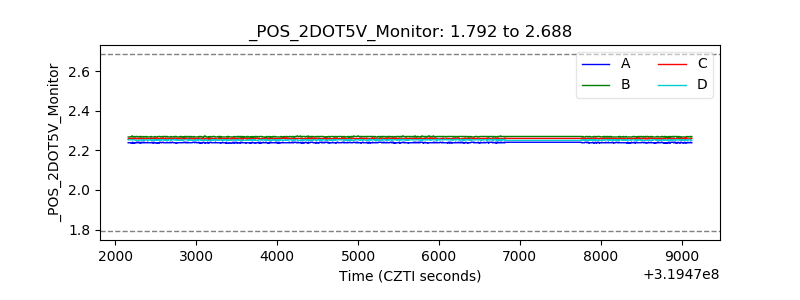 |
| +5 Volts monitor | 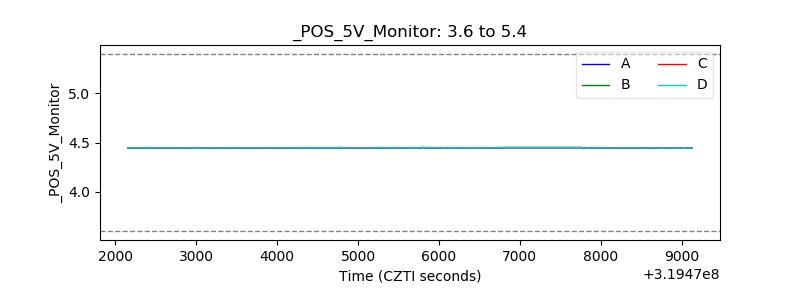 |
| _ROLL_ROT | 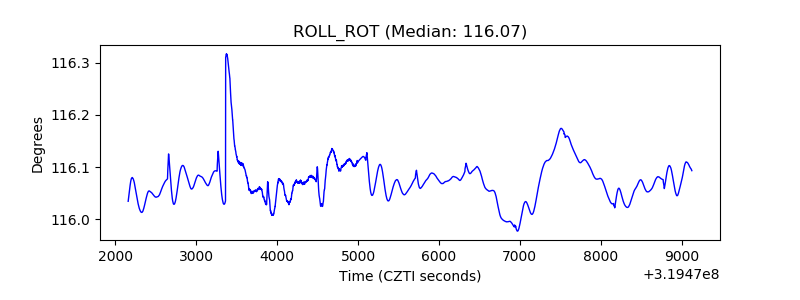 |
| _Roll_DEC | 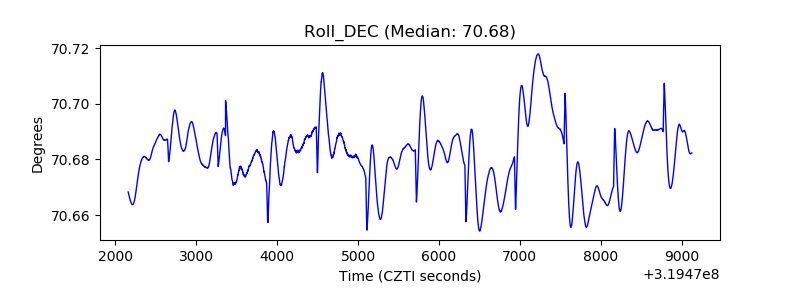 |
| _Roll_RA | 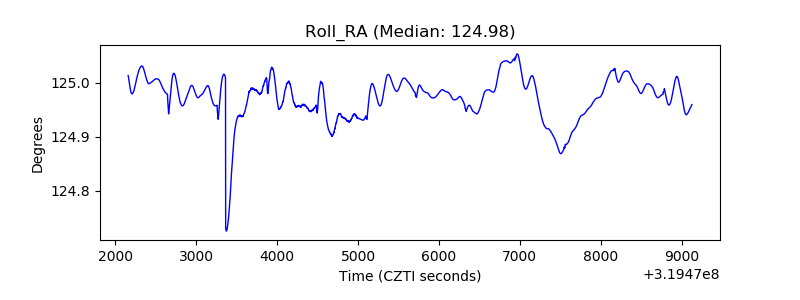 |
| Veto Counter | 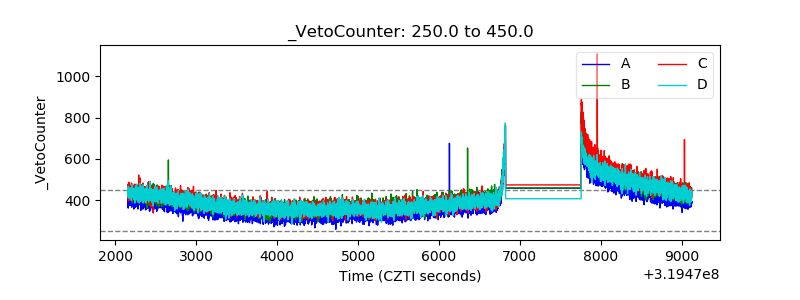 |