| Param | Original file | Final file |
|---|---|---|
| Filename | modeM0/AS1A07_054T01_9000003504_23705cztM0_level2.evt | modeM0/AS1A07_054T01_9000003504_23705cztM0_level2_quad_clean.evt |
| Size (bytes) | 464,402,880 | 130,815,360 |
| Size | 442.9 MB | 124.8 MB |
| Events in quadrant A | 3,116,775 | 893,891 |
| Events in quadrant B | 3,365,172 | 895,534 |
| Events in quadrant C | 3,339,049 | 868,054 |
| Events in quadrant D | 3,797,110 | 846,569 |
| Mode M0 | |||
|---|---|---|---|
| Quadrant | BADHDUFLAG | Total packets | Discarded packets |
| A | 0 | 13785 | 2 |
| B | 0 | 14472 | 2 |
| C | 0 | 14320 | 2 |
| D | 0 | 16038 | 2 |
| Mode SS | |||
|---|---|---|---|
| Quadrant | BADHDUFLAG | Total packets | Discarded packets |
| A | 0 | 134 | 0 |
| B | 0 | 134 | 0 |
| C | 0 | 134 | 0 |
| D | 0 | 134 | 0 |
| Mode M9 | |||
|---|---|---|---|
| Quadrant | BADHDUFLAG | Total packets | Discarded packets |
| A | 0 | 14 | 0 |
| B | 0 | 15 | 0 |
| C | 0 | 15 | 0 |
| D | 0 | 15 | 0 |
| Quadrant | Total seconds | Saturated seconds | Saturation percentage |
|---|---|---|---|
| A | 6570 | 25 | 0.380518% |
| B | 6569 | 64 | 0.974273% |
| C | 6569 | 97 | 1.476633% |
| D | 6569 | 89 | 1.354849% |
Noise dominated data is calculated using 1-second bins in cleaned event files. If a bin has >2000 counts, and if more than 50% of those come from <1% of pixels, then it is considered to be noise-dominated and hence unusable.
| Quadrant | # 1 sec bins | Bins with >0 counts | Bins with >2000 counts | High rate bins dominated by noise | Noise dominated (total time) | Noise dominated (detector-on time) | Marked lightcurve |
|---|---|---|---|---|---|---|---|
| A | 7665 | 6570 | 0 | 0 | 0.00% | 0.00% | 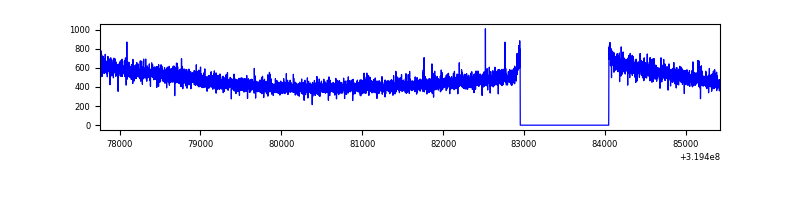 |
| B | 7664 | 6569 | 29 | 29 | 0.38% | 0.44% | 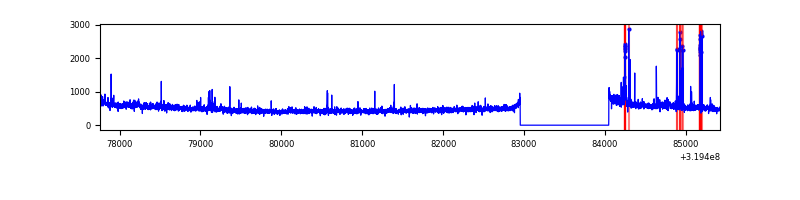 |
| C | 7664 | 6569 | 9 | 9 | 0.12% | 0.14% | 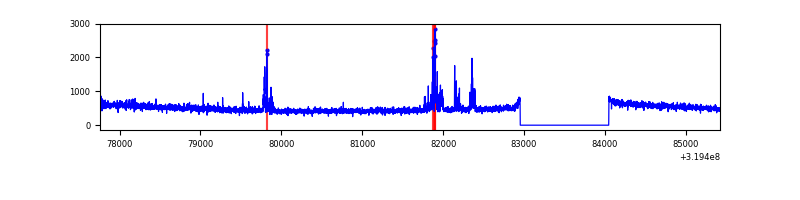 |
| D | 7664 | 6569 | 39 | 39 | 0.51% | 0.59% | 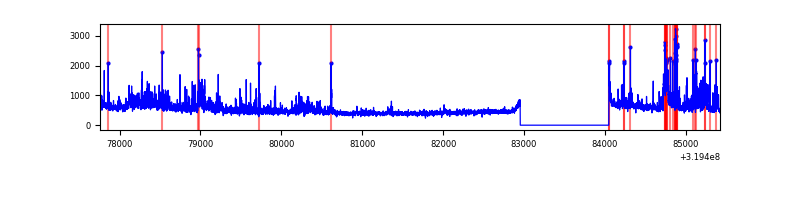 |
Top three noisy pixels from each quadrant. If the there are fewer than three noisy pixels in the level2.evt file, extra rows are filled as -1
| Pixel properties | Quadrant properties | ||||||
|---|---|---|---|---|---|---|---|
| Quadrant | DetID | PixID | Counts | Sigma | Mean | Median | Sigma |
| A | 13 | 254 | 10237 | 59.01 | 808 | 789 | 160.1 |
| A | 3 | 137 | 6988 | 38.72 | 808 | 789 | 160.1 |
| A | 0 | 226 | 6976 | 38.64 | 808 | 789 | 160.1 |
| B | 5 | 172 | 96527 | 638.37 | 800 | 781 | 150.0 |
| B | 0 | 229 | 47714 | 312.92 | 800 | 781 | 150.0 |
| B | 0 | 189 | 35851 | 233.82 | 800 | 781 | 150.0 |
| C | 7 | 247 | 143889 | 784.26 | 784 | 789 | 182.5 |
| C | 14 | 238 | 126416 | 688.49 | 784 | 789 | 182.5 |
| C | 3 | 233 | 5805 | 27.49 | 784 | 789 | 182.5 |
| D | 1 | 52 | 480514 | 2529.88 | 790 | 767 | 189.6 |
| D | 9 | 85 | 171087 | 898.16 | 790 | 767 | 189.6 |
| D | 12 | 233 | 56648 | 294.68 | 790 | 767 | 189.6 |
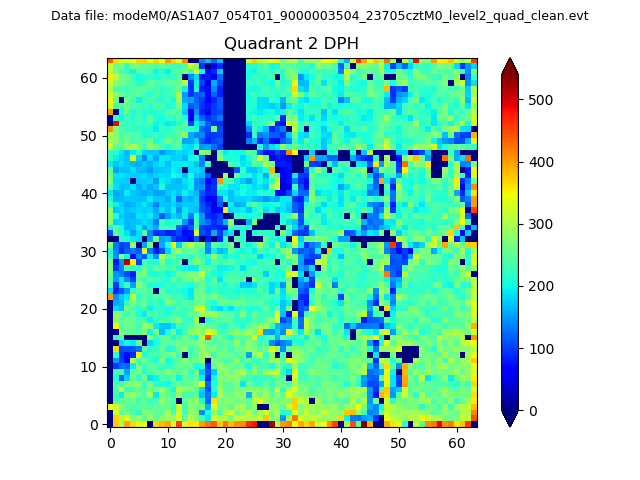
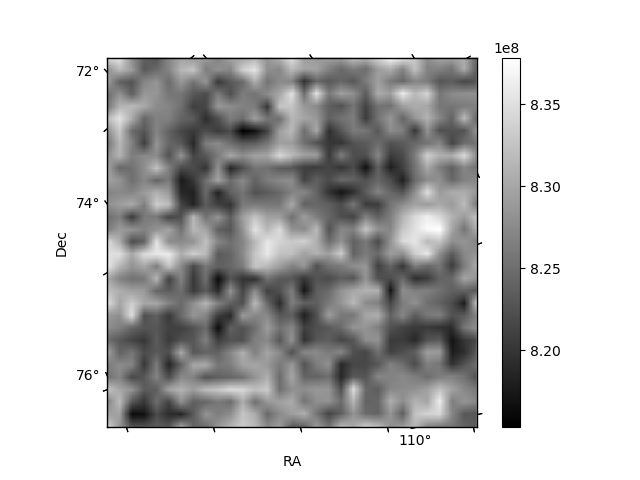
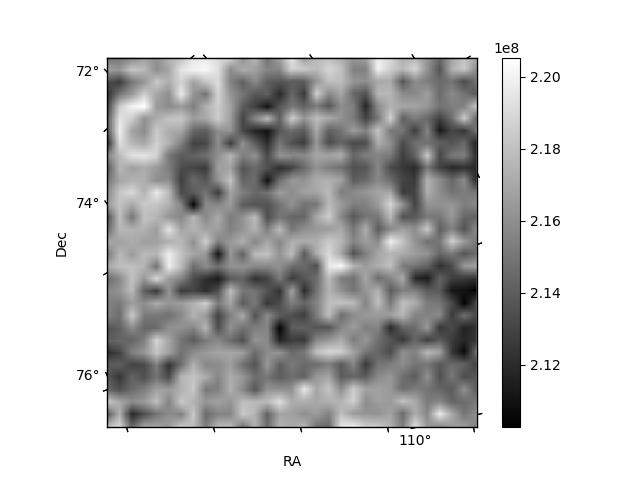
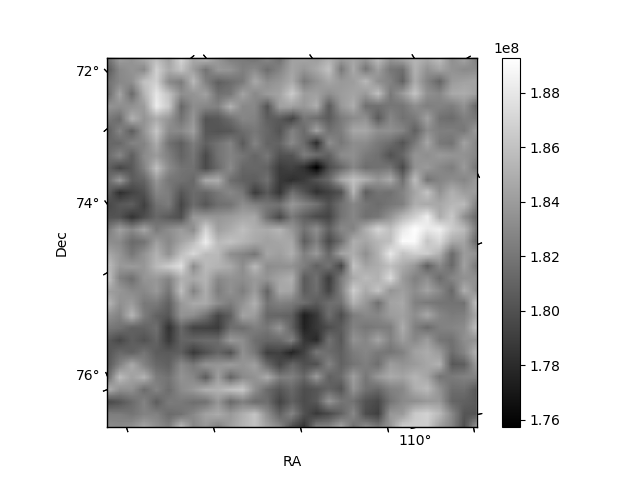
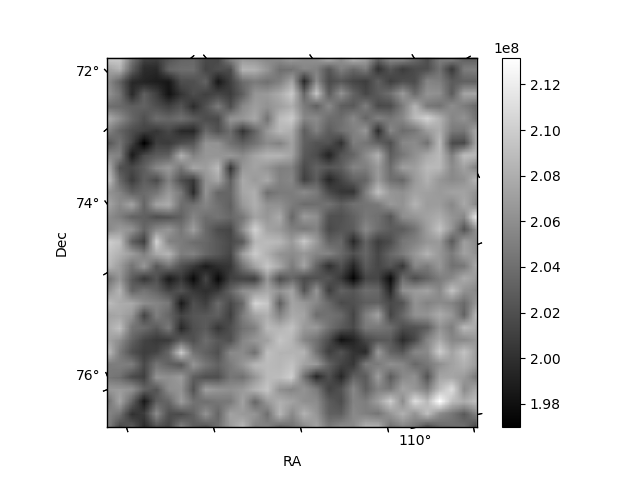
Histogram calculated using DETX and DETY for each event in the final _common_clean file
| Quadrant A | 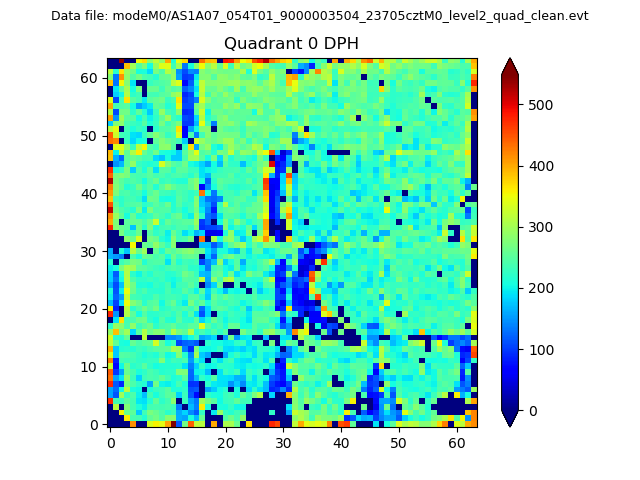 |
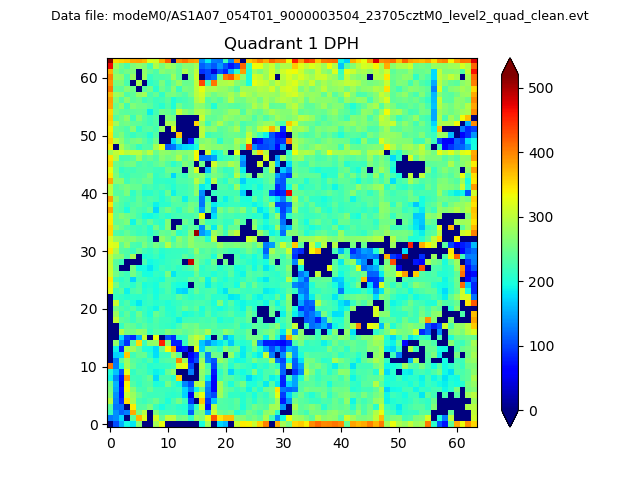 |
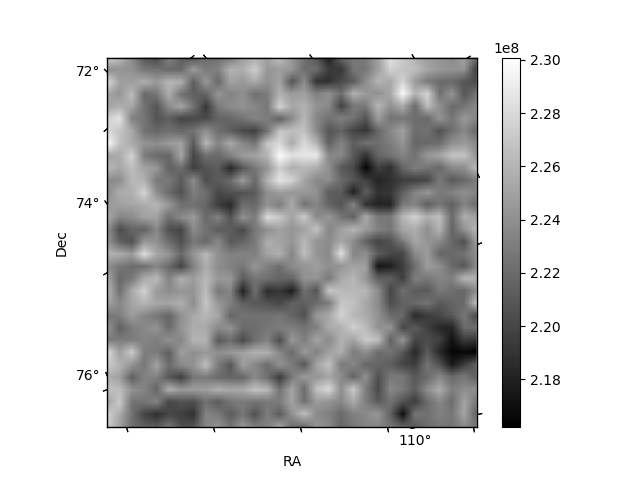
Quadrant B |
|---|---|---|---|
| Quadrant D | 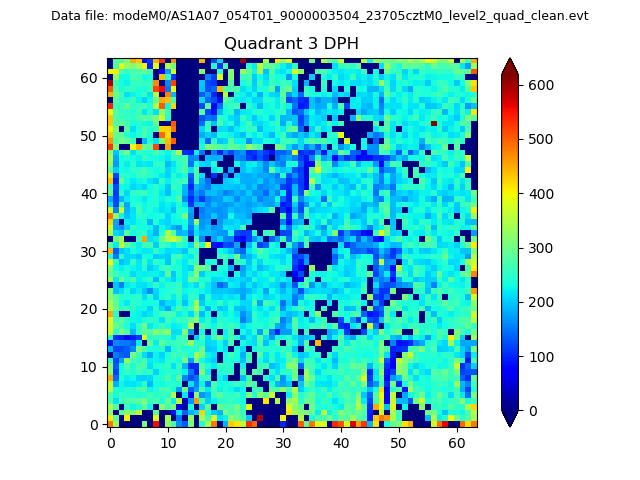 |
 |
Quadrant C |
| Plot type | Count rate plots | Images |
|---|---|---|
| Comparison with Poisson distribution Blue bars denote a histogram of data divided into 1 sec bins. Red curve is a Poisson curve with rate = median count rate of data. |
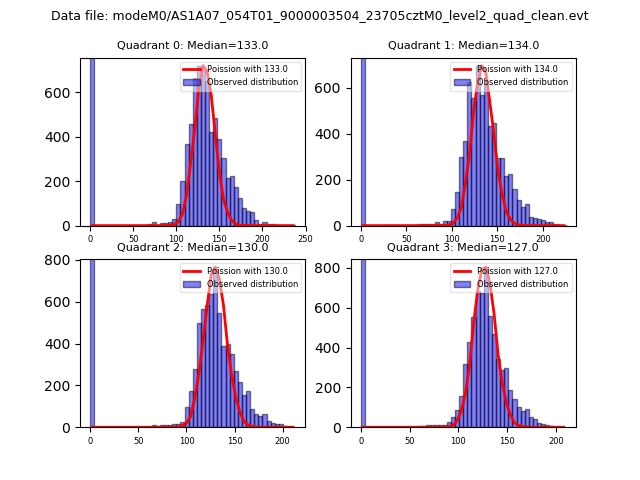 |
 |
| Quadrant-wise count rates Data is divided into 100 sec bins |
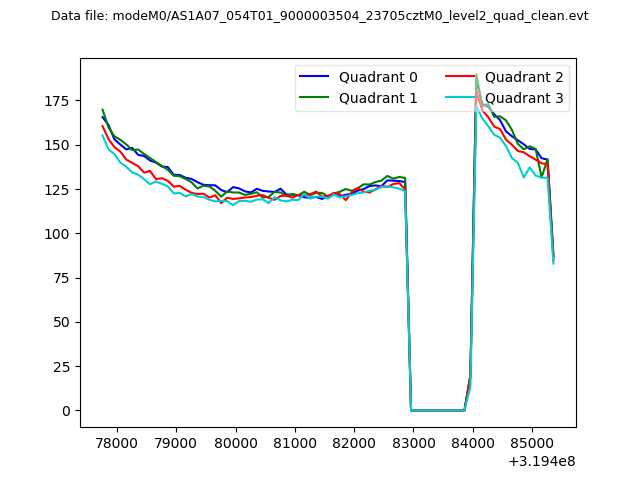 |
|
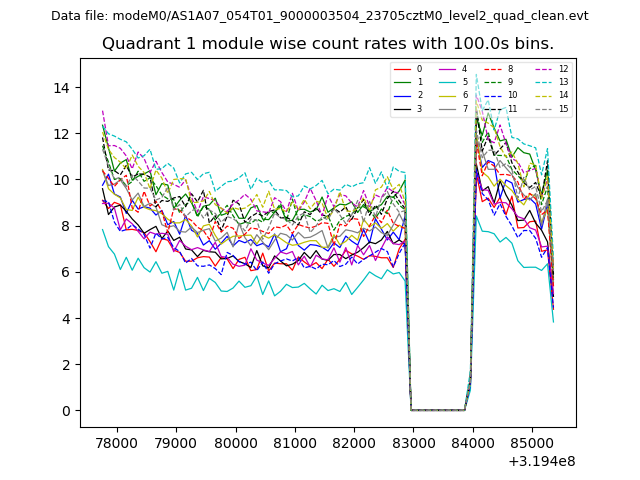
| Module-wise count rates for Quadrant A Data is divided into 100 sec bins |
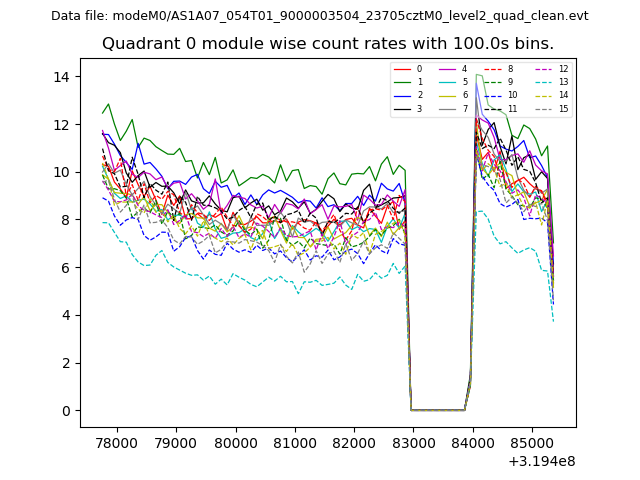 |
 |
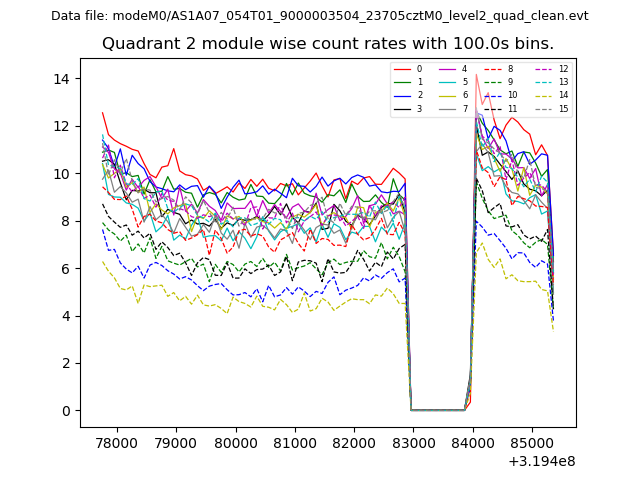
| Module-wise count rates for Quadrant B Data is divided into 100 sec bins |
 |
 |
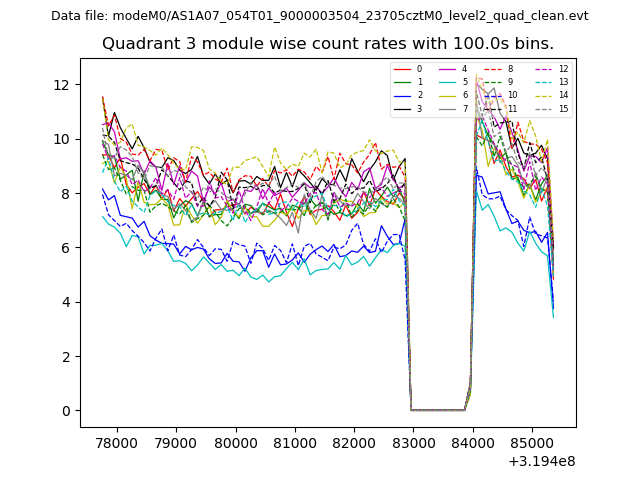
| Module-wise count rates for Quadrant C Data is divided into 100 sec bins |
 |
 |
| Module-wise count rates for Quadrant D Data is divided into 100 sec bins |
 |
 |
| Parameter | Plot |
|---|---|
| CZT HV Monitor | 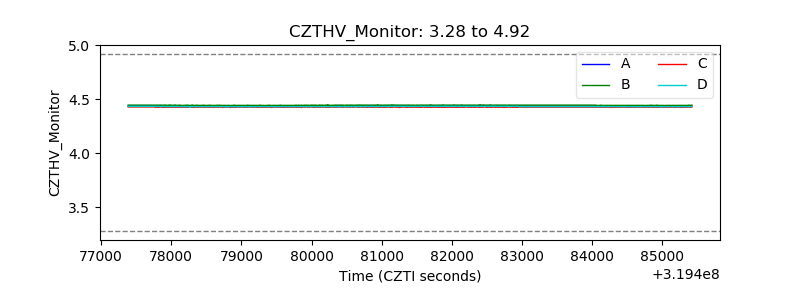 |
| D_VDD | 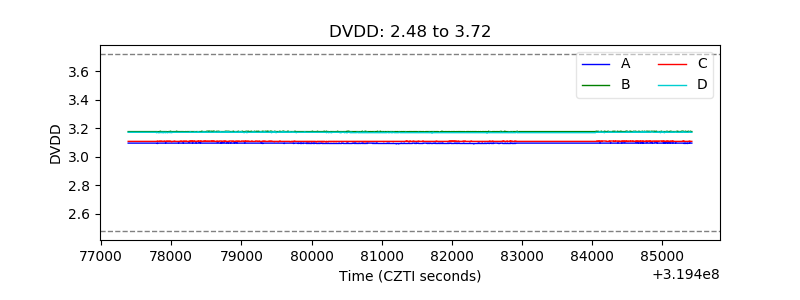 |
| Temperature 1 | 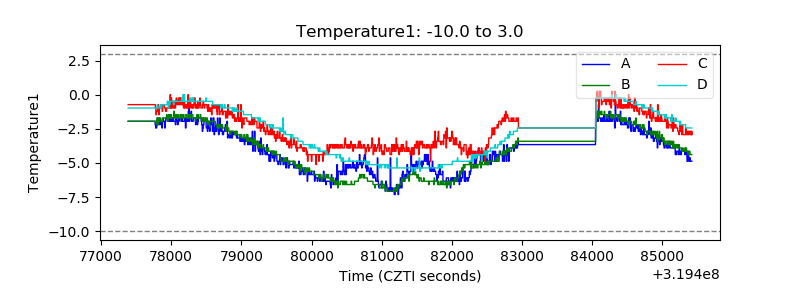 |
| Veto HV Monitor | 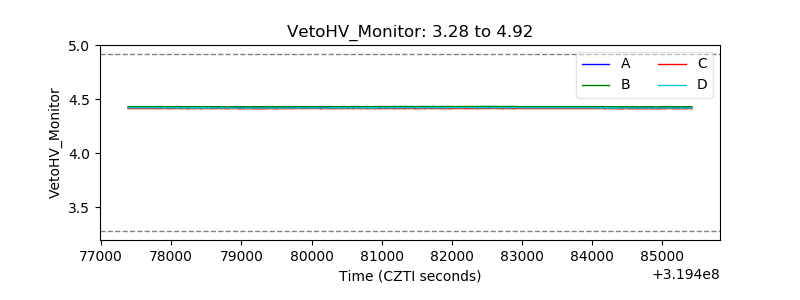 |
| Veto LLD | 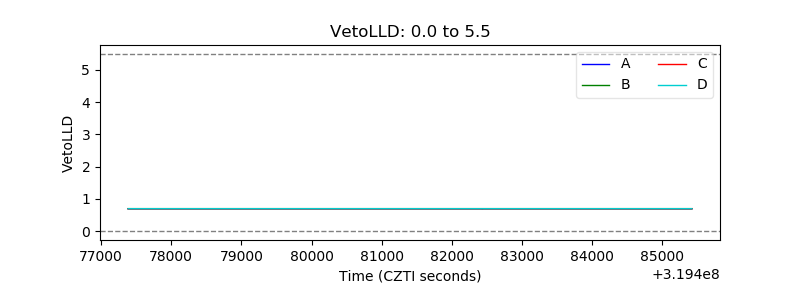 |
| Alpha Counter | 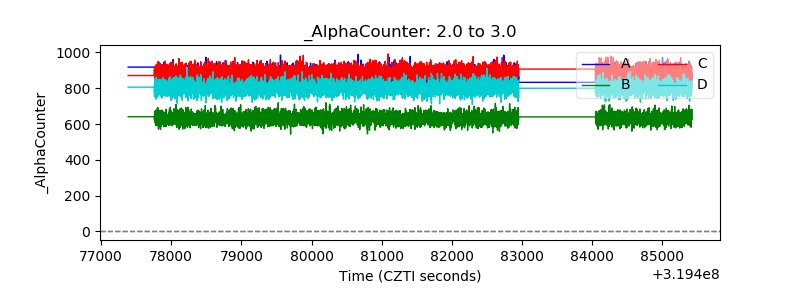 |
| _CPM_Rate | 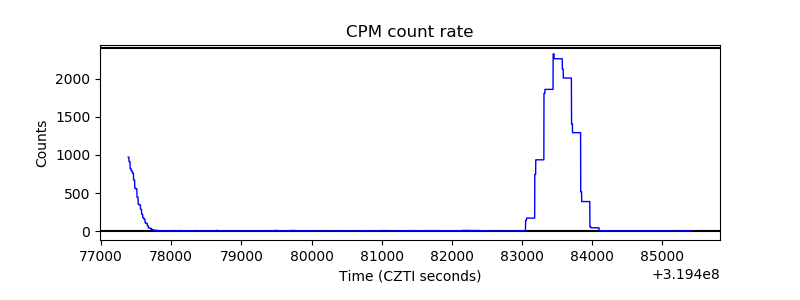 |
| CZT Counter | 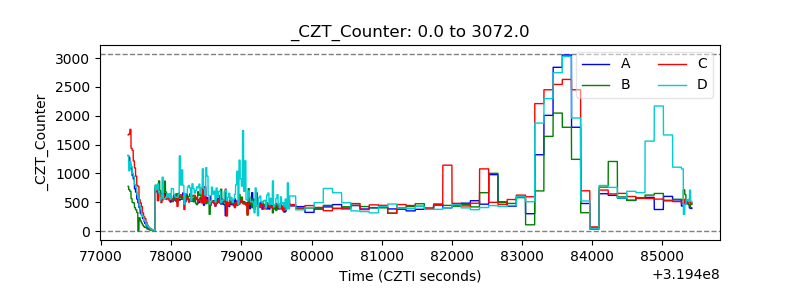 |
| +2.5 Volts monitor | 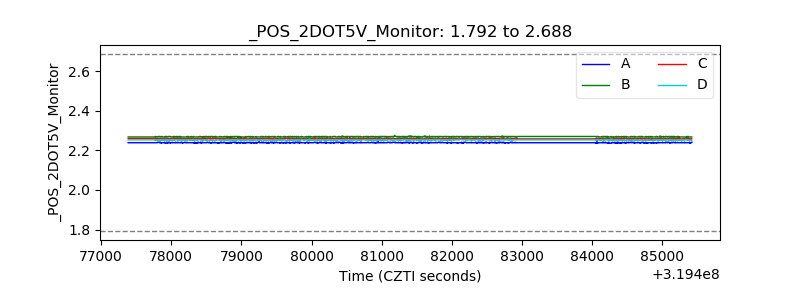 |
| +5 Volts monitor | 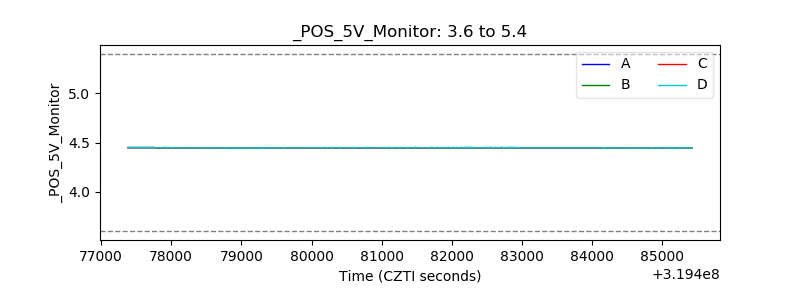 |
| _ROLL_ROT | 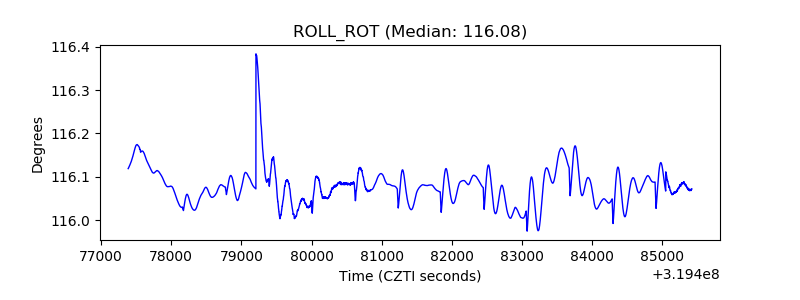 |
| _Roll_DEC | 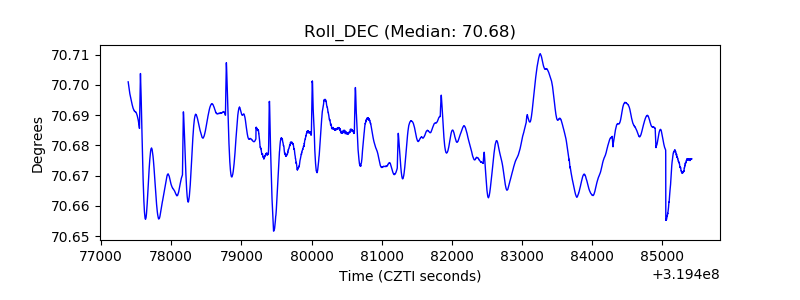 |
| _Roll_RA | 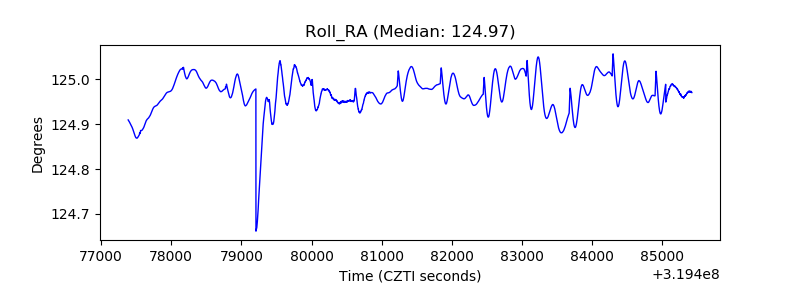 |
| Veto Counter | 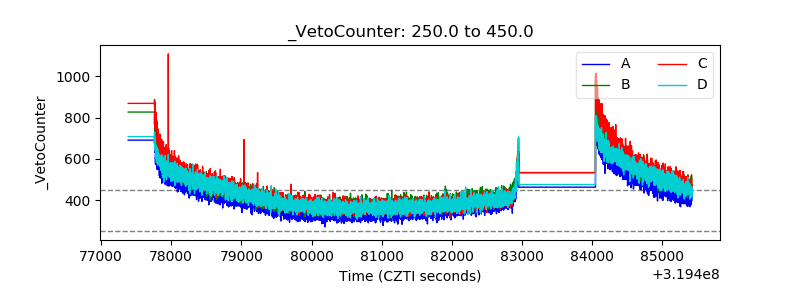 |