| Param | Original file | Final file |
|---|---|---|
| Filename | modeM0/AS1A07_054T01_9000003504_23709cztM0_level2.evt | modeM0/AS1A07_054T01_9000003504_23709cztM0_level2_quad_clean.evt |
| Size (bytes) | 441,855,360 | 137,738,880 |
| Size | 421.4 MB | 131.4 MB |
| Events in quadrant A | 3,056,719 | 934,345 |
| Events in quadrant B | 3,284,633 | 969,064 |
| Events in quadrant C | 3,229,499 | 937,732 |
| Events in quadrant D | 3,385,663 | 894,393 |
| Mode M0 | |||
|---|---|---|---|
| Quadrant | BADHDUFLAG | Total packets | Discarded packets |
| A | 0 | 13163 | 1 |
| B | 0 | 13768 | 1 |
| C | 0 | 13589 | 1 |
| D | 0 | 14348 | 1 |
| Mode SS | |||
|---|---|---|---|
| Quadrant | BADHDUFLAG | Total packets | Discarded packets |
| A | 0 | 126 | 0 |
| B | 0 | 126 | 0 |
| C | 0 | 126 | 0 |
| D | 0 | 126 | 0 |
| Mode M9 | |||
|---|---|---|---|
| Quadrant | BADHDUFLAG | Total packets | Discarded packets |
| A | 0 | 16 | 0 |
| B | 0 | 17 | 0 |
| C | 0 | 17 | 0 |
| D | 0 | 17 | 0 |
| Quadrant | Total seconds | Saturated seconds | Saturation percentage |
|---|---|---|---|
| A | 6261 | 18 | 0.287494% |
| B | 6261 | 38 | 0.606932% |
| C | 6261 | 78 | 1.245807% |
| D | 6260 | 64 | 1.022364% |
Noise dominated data is calculated using 1-second bins in cleaned event files. If a bin has >2000 counts, and if more than 50% of those come from <1% of pixels, then it is considered to be noise-dominated and hence unusable.
| Quadrant | # 1 sec bins | Bins with >0 counts | Bins with >2000 counts | High rate bins dominated by noise | Noise dominated (total time) | Noise dominated (detector-on time) | Marked lightcurve |
|---|---|---|---|---|---|---|---|
| A | 7591 | 6262 | 0 | 0 | 0.00% | 0.00% | 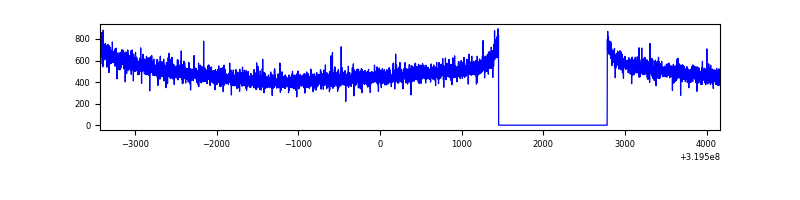 |
| B | 7591 | 6262 | 1 | 1 | 0.01% | 0.02% | 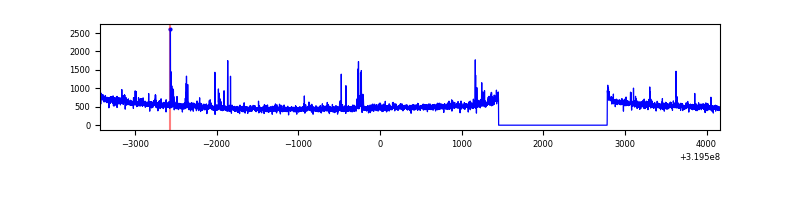 |
| C | 7591 | 6262 | 0 | 0 | 0.00% | 0.00% | 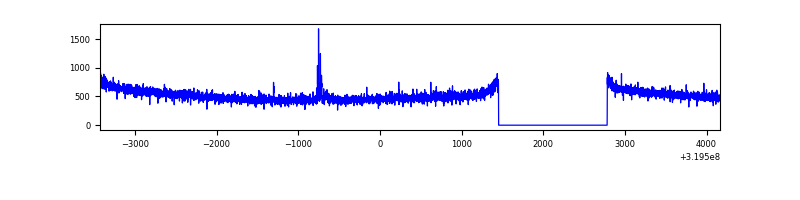 |
| D | 7590 | 6260 | 32 | 32 | 0.42% | 0.51% | 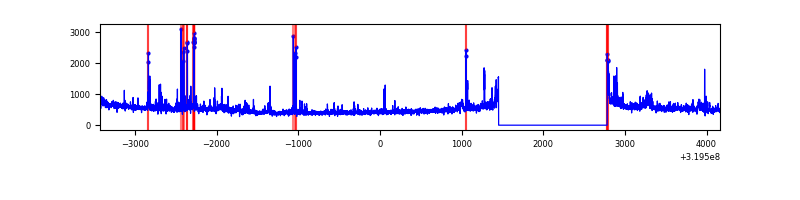 |
Top three noisy pixels from each quadrant. If the there are fewer than three noisy pixels in the level2.evt file, extra rows are filled as -1
| Pixel properties | Quadrant properties | ||||||
|---|---|---|---|---|---|---|---|
| Quadrant | DetID | PixID | Counts | Sigma | Mean | Median | Sigma |
| A | 13 | 254 | 10104 | 59.77 | 792 | 778 | 156.0 |
| A | 0 | 226 | 6920 | 39.36 | 792 | 778 | 156.0 |
| A | 3 | 137 | 6455 | 36.38 | 792 | 778 | 156.0 |
| B | 6 | 36 | 44593 | 298.46 | 806 | 786 | 146.8 |
| B | 0 | 229 | 44236 | 296.03 | 806 | 786 | 146.8 |
| B | 0 | 189 | 29533 | 195.85 | 806 | 786 | 146.8 |
| C | 14 | 238 | 128268 | 703.07 | 788 | 795 | 181.3 |
| C | 7 | 247 | 20029 | 106.08 | 788 | 795 | 181.3 |
| C | 10 | 9 | 5831 | 27.78 | 788 | 795 | 181.3 |
| D | 1 | 52 | 213271 | 1141.26 | 778 | 758 | 186.2 |
| D | 9 | 85 | 124331 | 663.62 | 778 | 758 | 186.2 |
| D | 13 | 174 | 62567 | 331.93 | 778 | 758 | 186.2 |
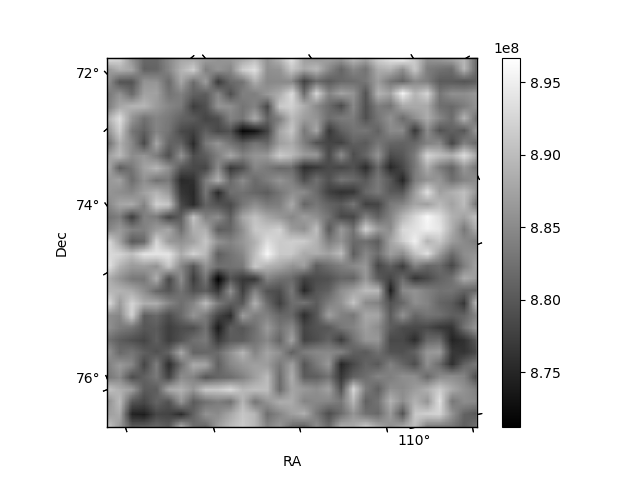
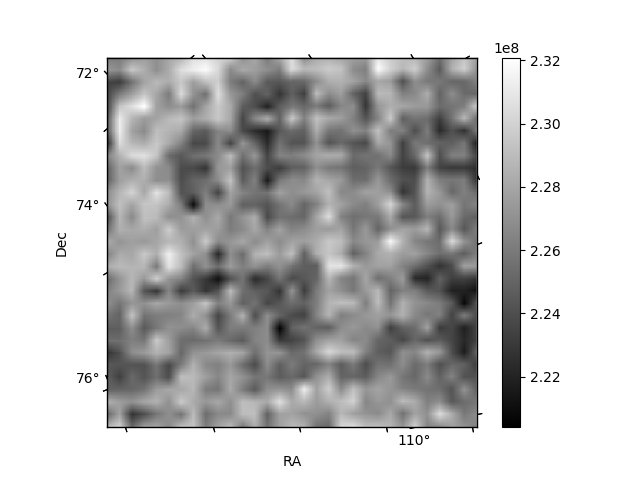
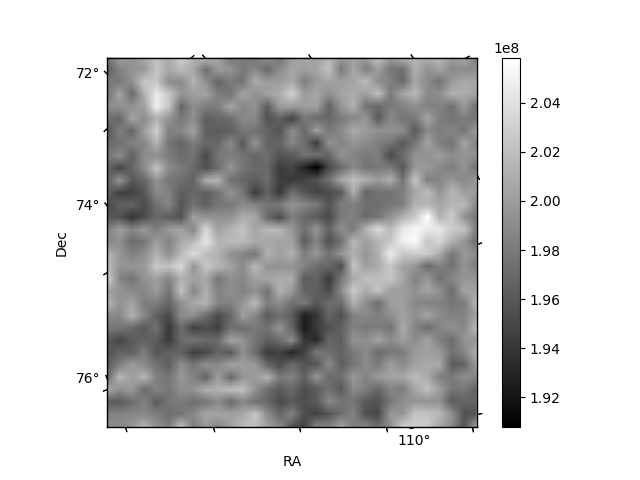
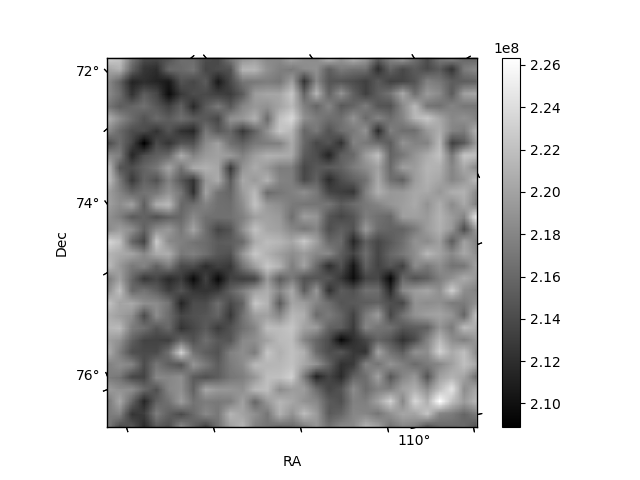
Histogram calculated using DETX and DETY for each event in the final _common_clean file
| Quadrant A | 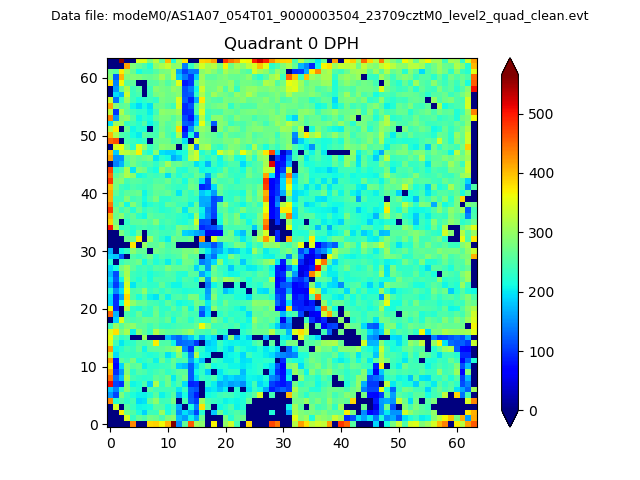 |
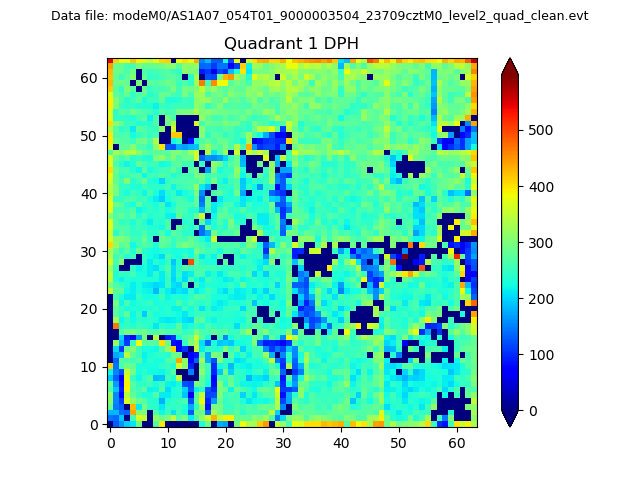 |
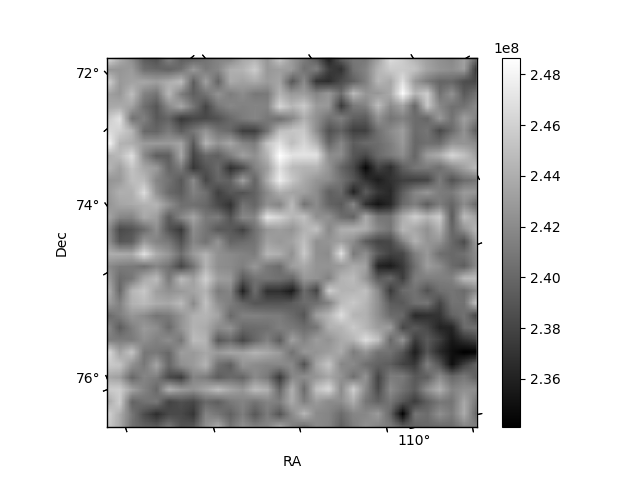
Quadrant B |
|---|---|---|---|
| Quadrant D | 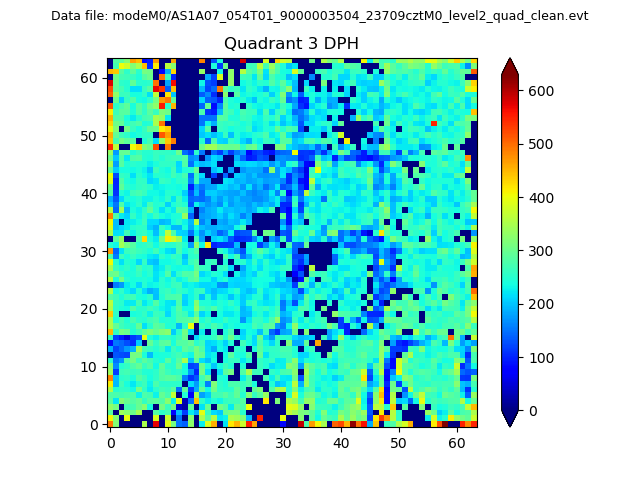 |
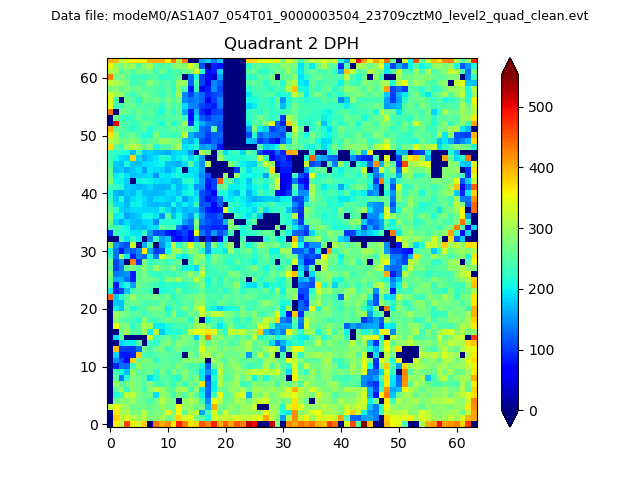 |
Quadrant C |
| Plot type | Count rate plots | Images |
|---|---|---|
| Comparison with Poisson distribution Blue bars denote a histogram of data divided into 1 sec bins. Red curve is a Poisson curve with rate = median count rate of data. |
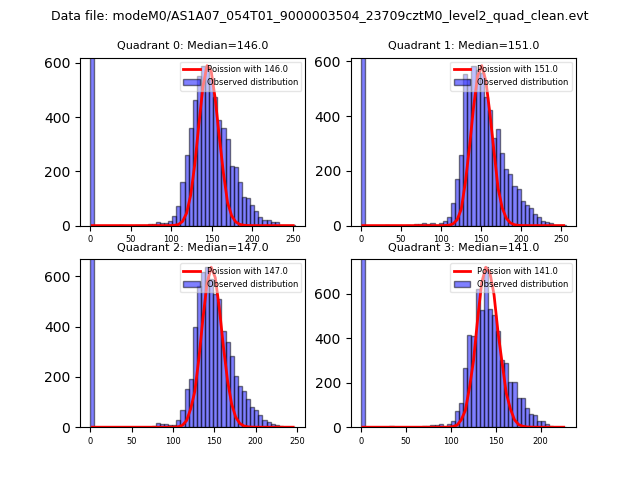 |
 |
| Quadrant-wise count rates Data is divided into 100 sec bins |
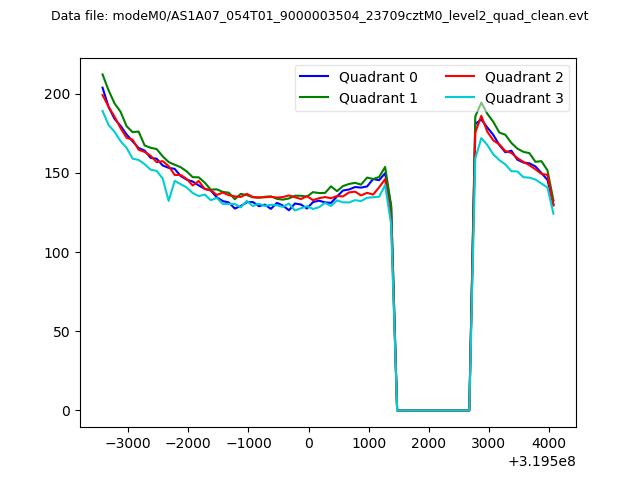 |
|
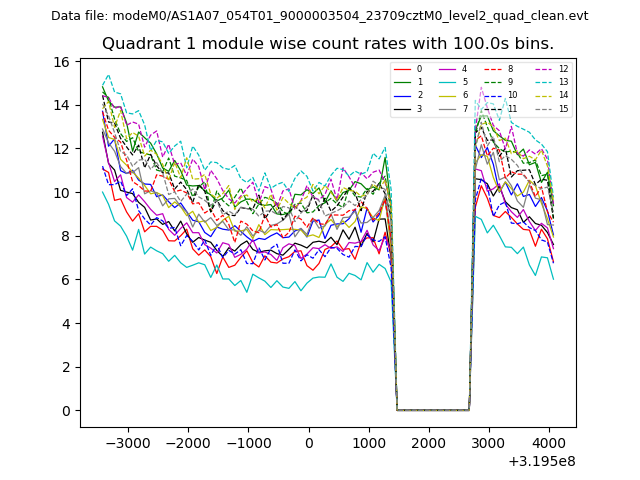
| Module-wise count rates for Quadrant A Data is divided into 100 sec bins |
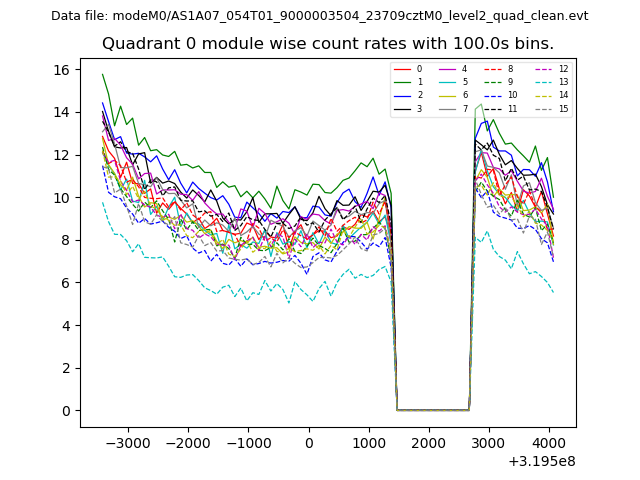 |
 |
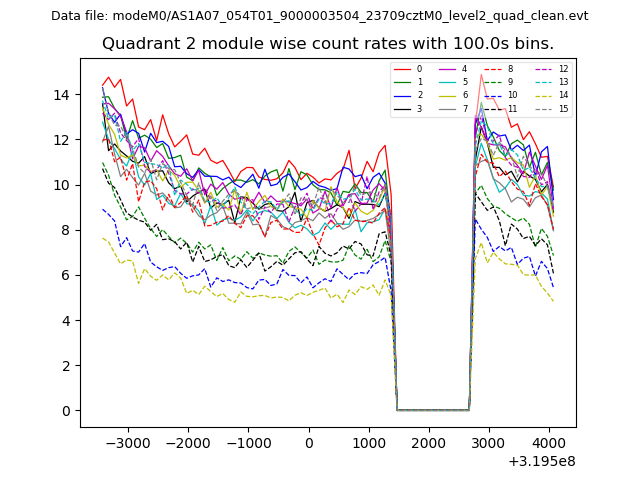
| Module-wise count rates for Quadrant B Data is divided into 100 sec bins |
 |
 |
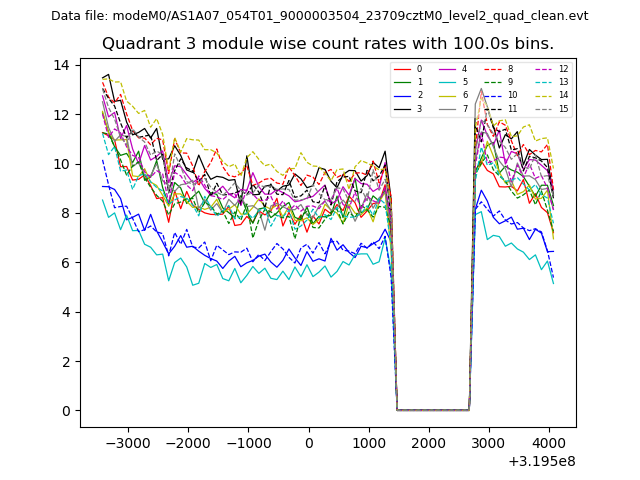
| Module-wise count rates for Quadrant C Data is divided into 100 sec bins |
 |
 |
| Module-wise count rates for Quadrant D Data is divided into 100 sec bins |
 |
 |
| Parameter | Plot |
|---|---|
| CZT HV Monitor | 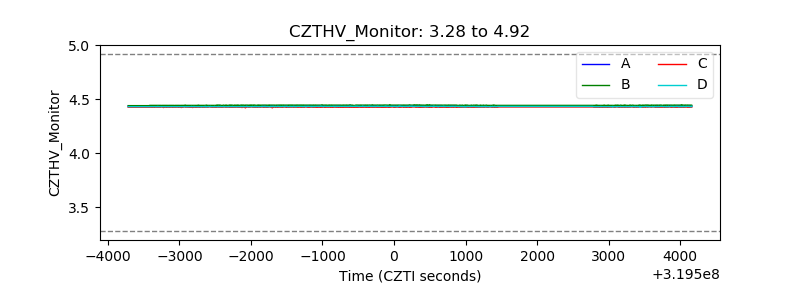 |
| D_VDD | 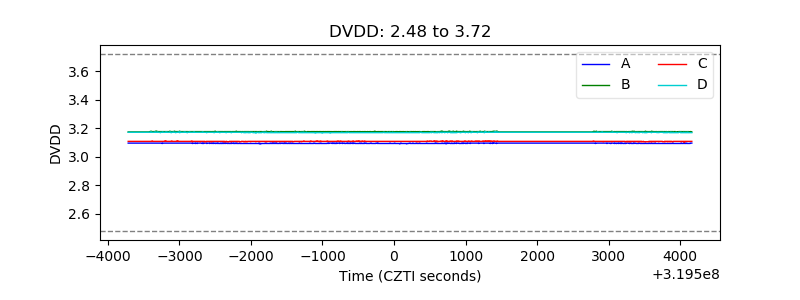 |
| Temperature 1 | 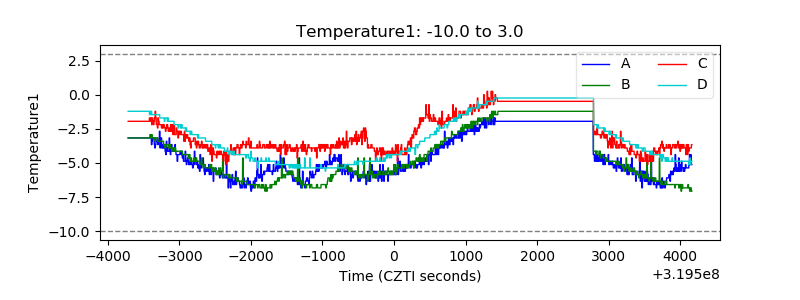 |
| Veto HV Monitor | 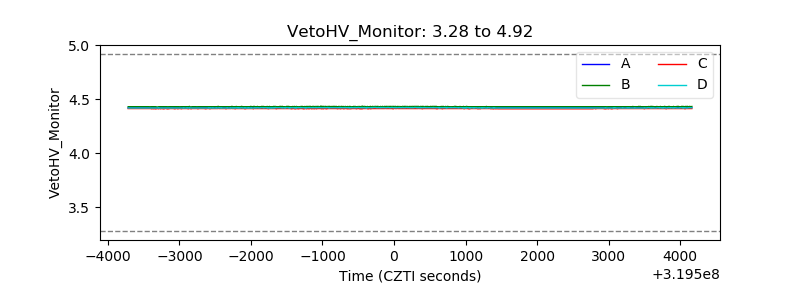 |
| Veto LLD | 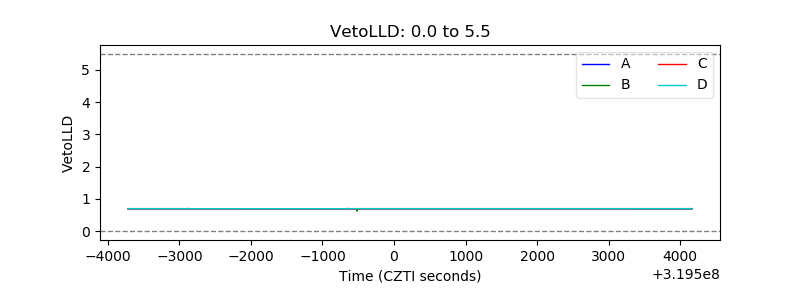 |
| Alpha Counter | 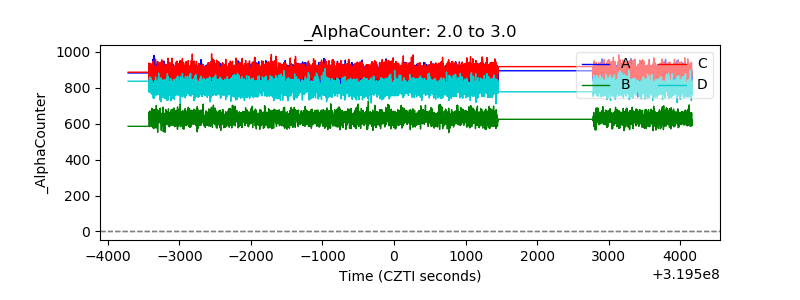 |
| _CPM_Rate | 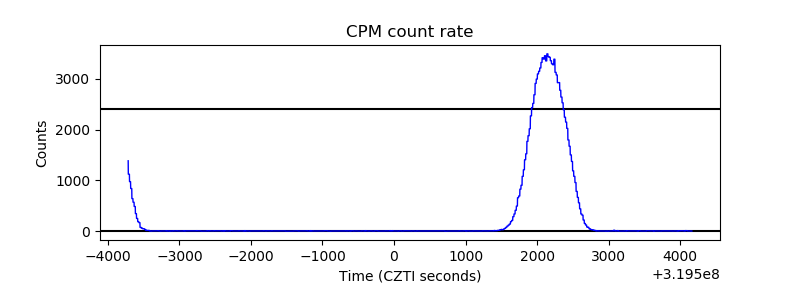 |
| CZT Counter | 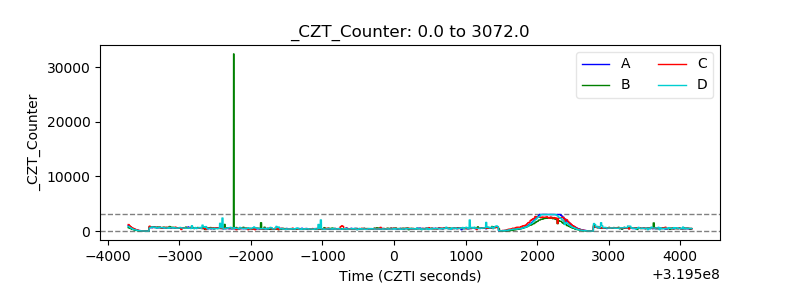 |
| +2.5 Volts monitor | 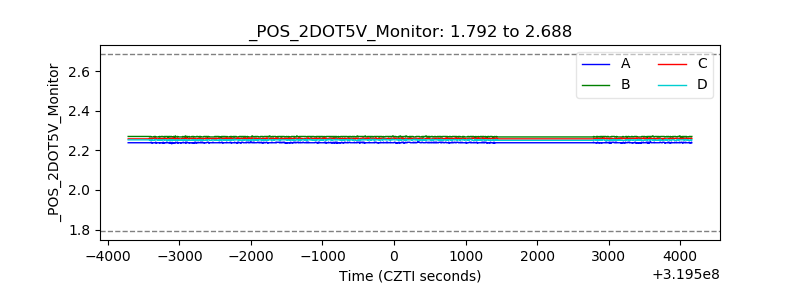 |
| +5 Volts monitor | 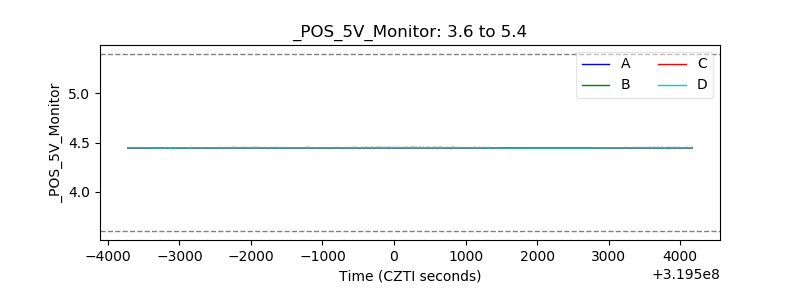 |
| _ROLL_ROT | 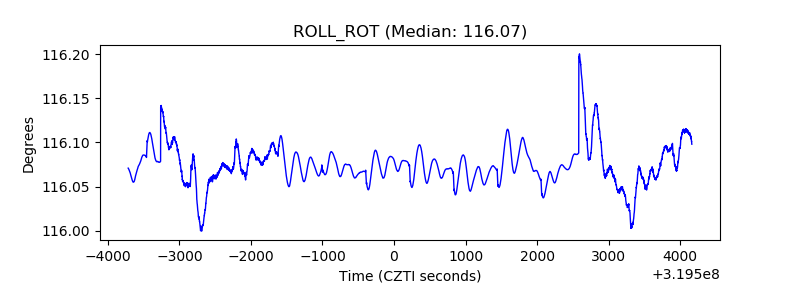 |
| _Roll_DEC | 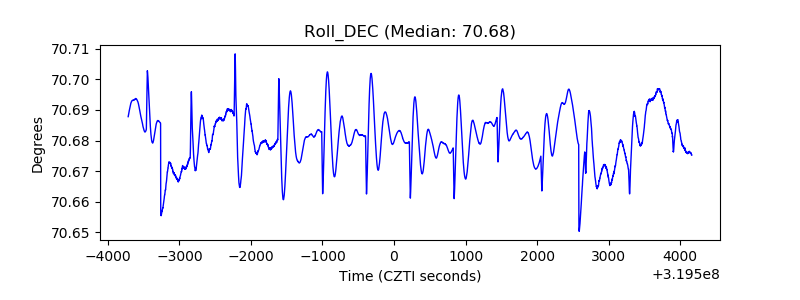 |
| _Roll_RA | 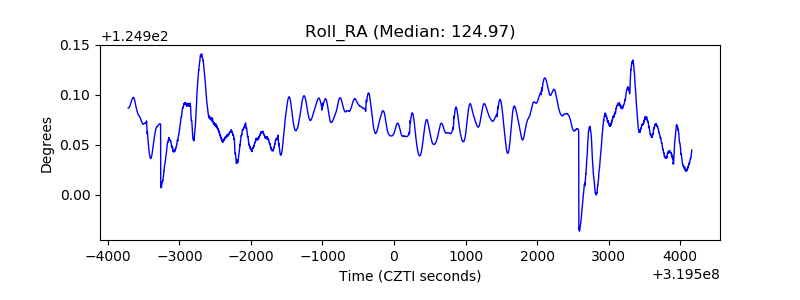 |
| Veto Counter | 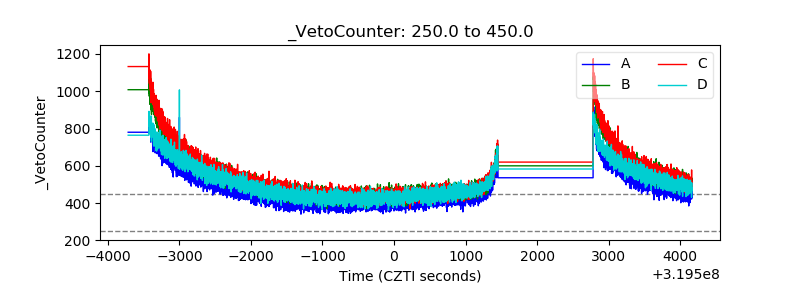 |