| Param | Original file | Final file |
|---|---|---|
| Filename | modeM0/AS1A07_054T01_9000003504_23710cztM0_level2.evt | modeM0/AS1A07_054T01_9000003504_23710cztM0_level2_quad_clean.evt |
| Size (bytes) | 454,193,280 | 133,845,120 |
| Size | 433.2 MB | 127.6 MB |
| Events in quadrant A | 2,994,744 | 911,533 |
| Events in quadrant B | 3,255,924 | 944,358 |
| Events in quadrant C | 3,118,875 | 905,827 |
| Events in quadrant D | 3,960,241 | 855,248 |
| Mode M0 | |||
|---|---|---|---|
| Quadrant | BADHDUFLAG | Total packets | Discarded packets |
| A | 0 | 12934 | 1 |
| B | 0 | 13655 | 1 |
| C | 0 | 13182 | 1 |
| D | 0 | 16146 | 1 |
| Mode SS | |||
|---|---|---|---|
| Quadrant | BADHDUFLAG | Total packets | Discarded packets |
| A | 0 | 128 | 0 |
| B | 0 | 128 | 0 |
| C | 0 | 128 | 0 |
| D | 0 | 128 | 0 |
| Mode M9 | |||
|---|---|---|---|
| Quadrant | BADHDUFLAG | Total packets | Discarded packets |
| A | 0 | 15 | 0 |
| B | 0 | 16 | 0 |
| C | 0 | 16 | 0 |
| D | 0 | 16 | 0 |
| Quadrant | Total seconds | Saturated seconds | Saturation percentage |
|---|---|---|---|
| A | 6260 | 21 | 0.335463% |
| B | 6260 | 36 | 0.575080% |
| C | 6260 | 60 | 0.958466% |
| D | 6260 | 152 | 2.428115% |
Noise dominated data is calculated using 1-second bins in cleaned event files. If a bin has >2000 counts, and if more than 50% of those come from <1% of pixels, then it is considered to be noise-dominated and hence unusable.
| Quadrant | # 1 sec bins | Bins with >0 counts | Bins with >2000 counts | High rate bins dominated by noise | Noise dominated (total time) | Noise dominated (detector-on time) | Marked lightcurve |
|---|---|---|---|---|---|---|---|
| A | 7605 | 6261 | 0 | 0 | 0.00% | 0.00% | 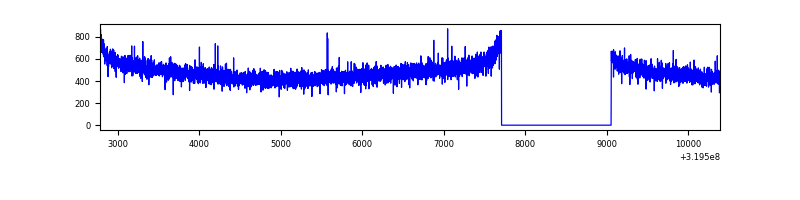 |
| B | 7605 | 6261 | 0 | 0 | 0.00% | 0.00% | 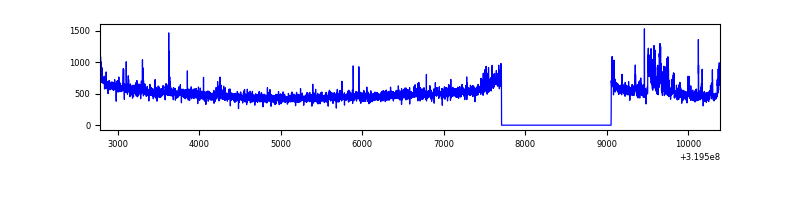 |
| C | 7605 | 6260 | 0 | 0 | 0.00% | 0.00% | 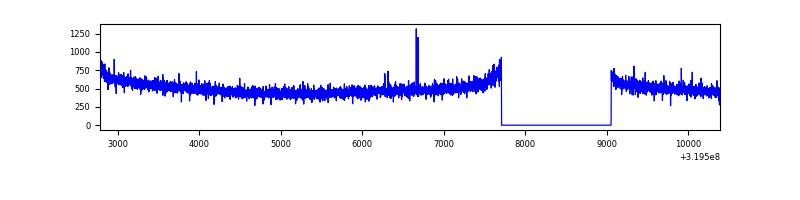 |
| D | 7605 | 6261 | 106 | 106 | 1.39% | 1.69% | 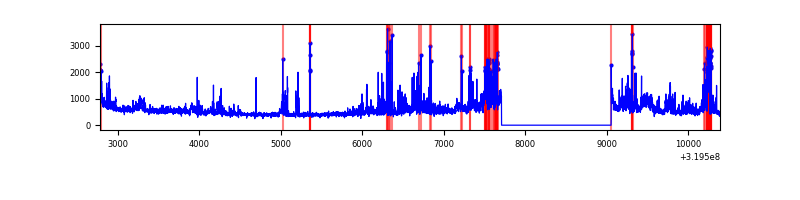 |
Top three noisy pixels from each quadrant. If the there are fewer than three noisy pixels in the level2.evt file, extra rows are filled as -1
| Pixel properties | Quadrant properties | ||||||
|---|---|---|---|---|---|---|---|
| Quadrant | DetID | PixID | Counts | Sigma | Mean | Median | Sigma |
| A | 13 | 254 | 9377 | 56.05 | 777 | 762 | 153.7 |
| A | 0 | 226 | 6603 | 38.0 | 777 | 762 | 153.7 |
| A | 3 | 137 | 6513 | 37.42 | 777 | 762 | 153.7 |
| B | 0 | 229 | 132272 | 916.84 | 789 | 771 | 143.4 |
| B | 0 | 189 | 22822 | 153.74 | 789 | 771 | 143.4 |
| B | 12 | 111 | 17034 | 113.39 | 789 | 771 | 143.4 |
| C | 14 | 238 | 124881 | 705.12 | 765 | 771 | 176.0 |
| C | 7 | 247 | 6456 | 32.3 | 765 | 771 | 176.0 |
| C | 13 | 61 | 5450 | 26.58 | 765 | 771 | 176.0 |
| D | 1 | 52 | 1050735 | 5844.61 | 751 | 730 | 179.7 |
| D | 9 | 85 | 39827 | 217.62 | 751 | 730 | 179.7 |
| D | 2 | 234 | 25909 | 140.15 | 751 | 730 | 179.7 |
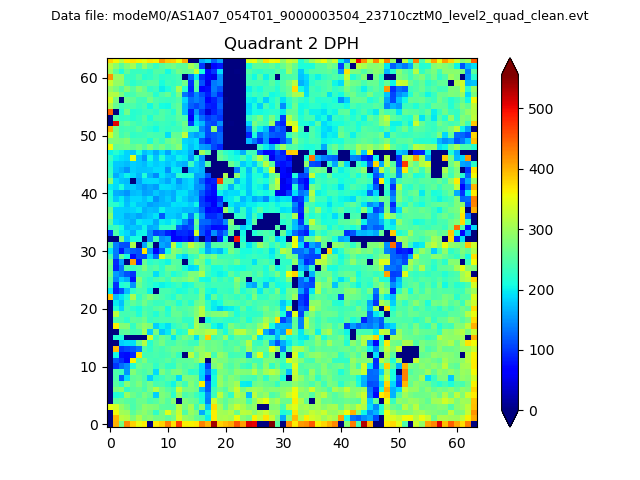
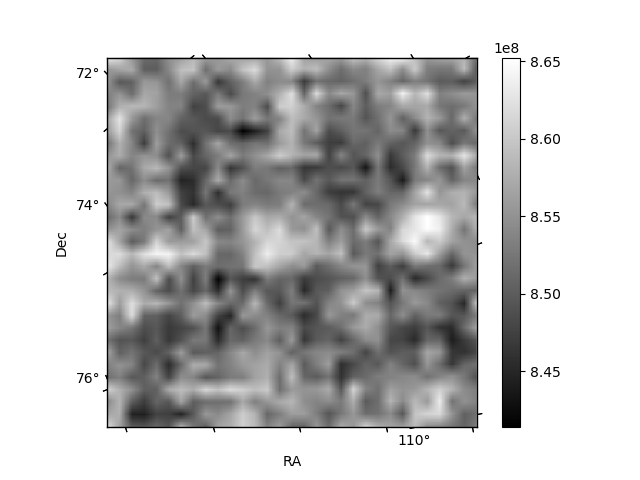
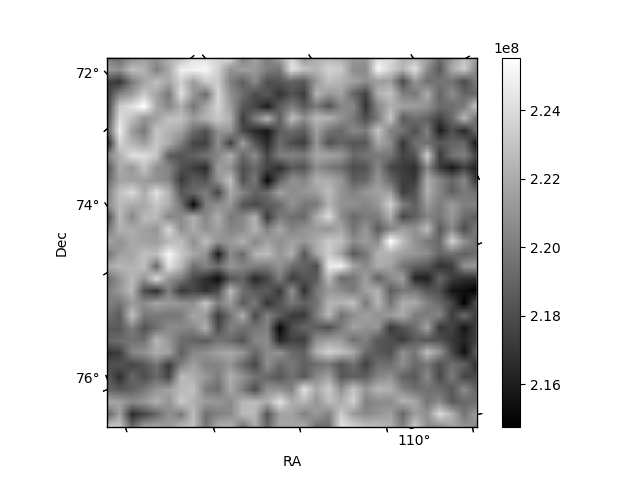
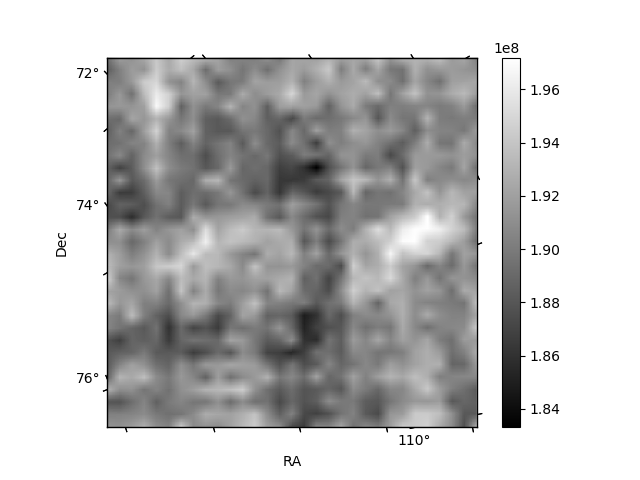
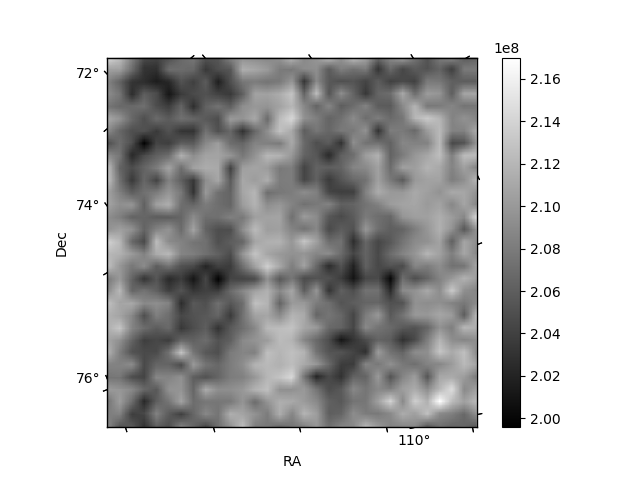
Histogram calculated using DETX and DETY for each event in the final _common_clean file
| Quadrant A | 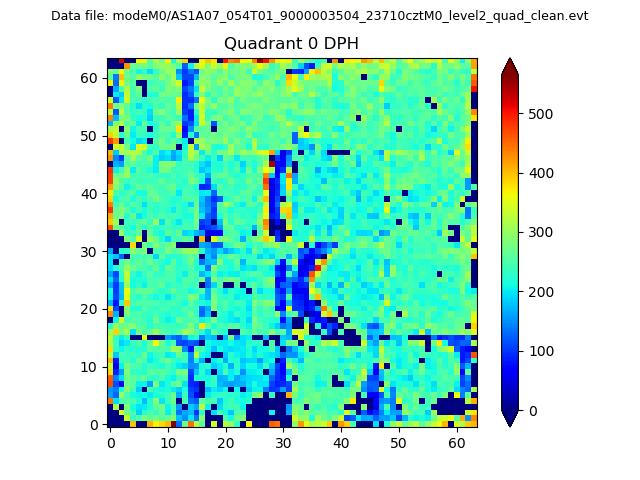 |
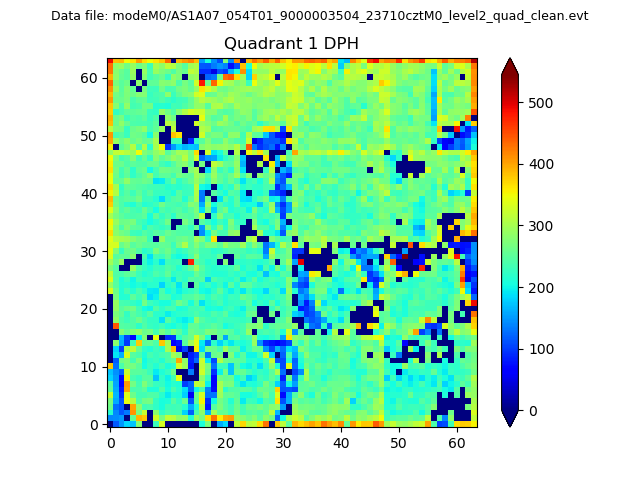 |
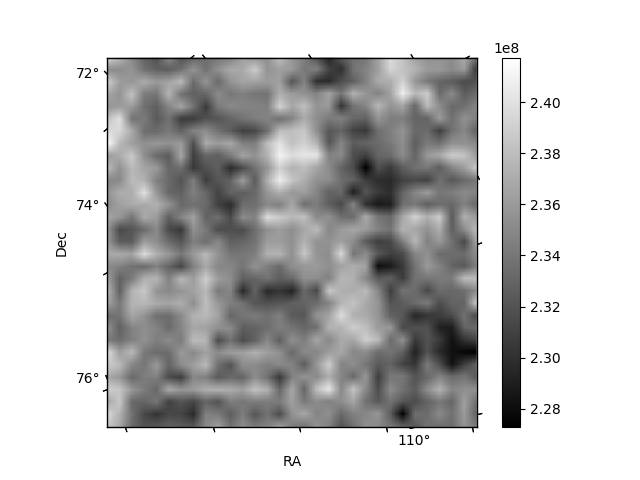
Quadrant B |
|---|---|---|---|
| Quadrant D | 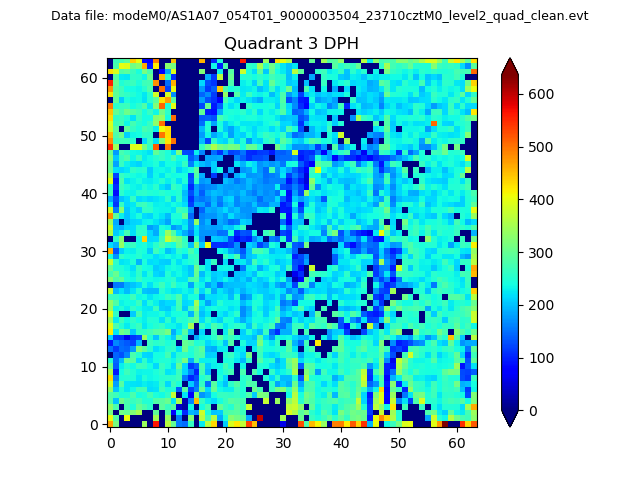 |
 |
Quadrant C |
| Plot type | Count rate plots | Images |
|---|---|---|
| Comparison with Poisson distribution Blue bars denote a histogram of data divided into 1 sec bins. Red curve is a Poisson curve with rate = median count rate of data. |
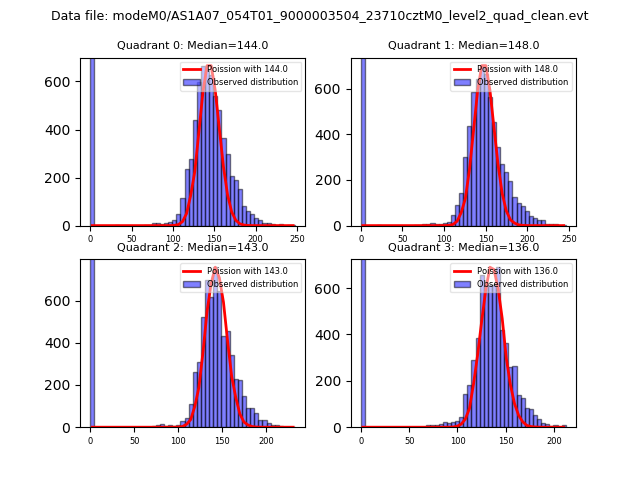 |
 |
| Quadrant-wise count rates Data is divided into 100 sec bins |
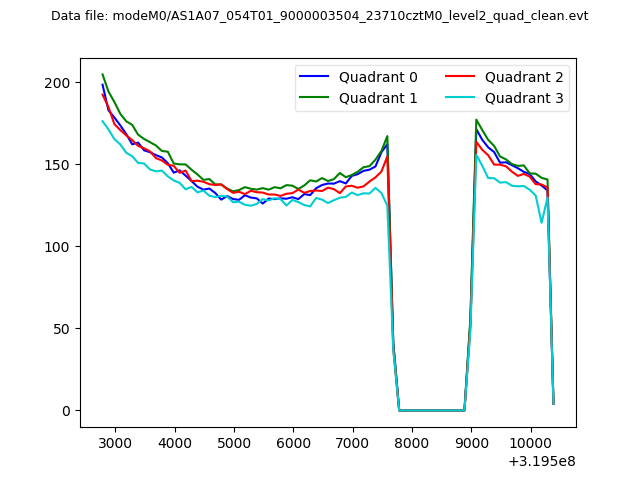 |
|
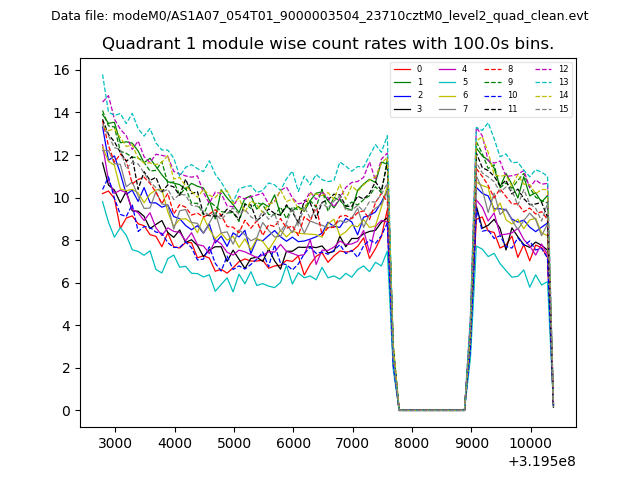
| Module-wise count rates for Quadrant A Data is divided into 100 sec bins |
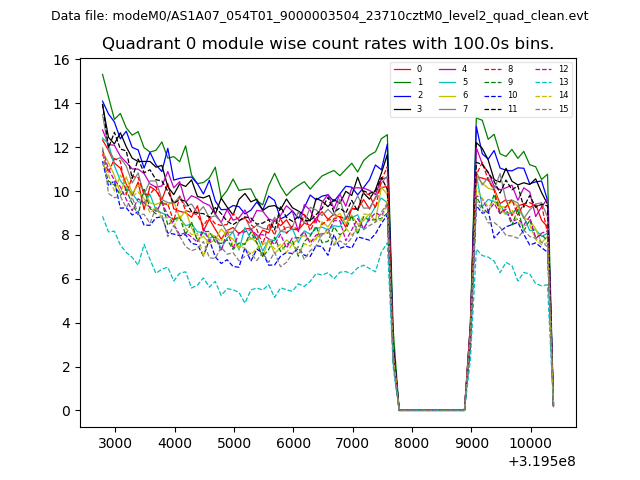 |
 |
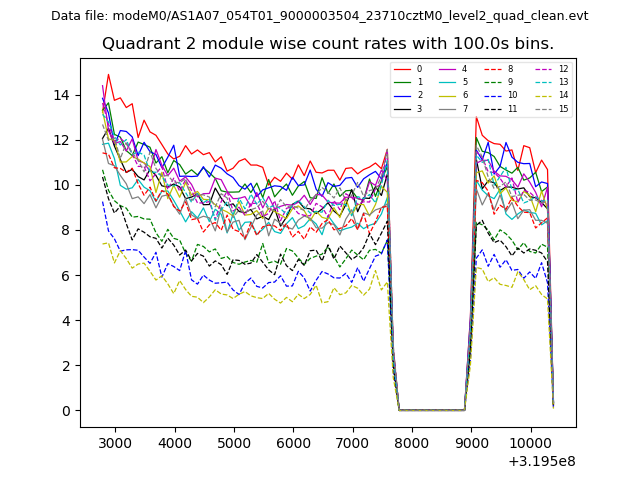
| Module-wise count rates for Quadrant B Data is divided into 100 sec bins |
 |
 |
| Module-wise count rates for Quadrant C Data is divided into 100 sec bins |
 |
 |
| Module-wise count rates for Quadrant D Data is divided into 100 sec bins |
 |
 |
| Parameter | Plot |
|---|---|
| CZT HV Monitor |  |
| D_VDD | 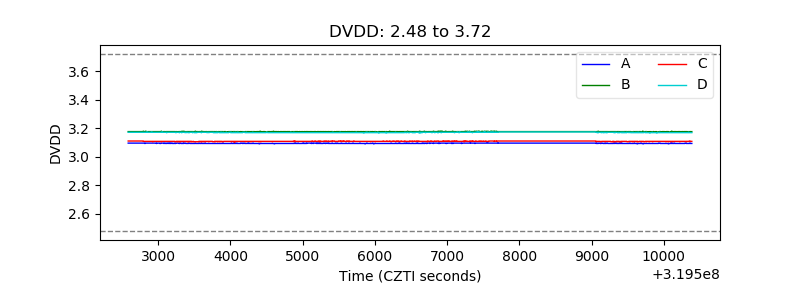 |
| Temperature 1 | 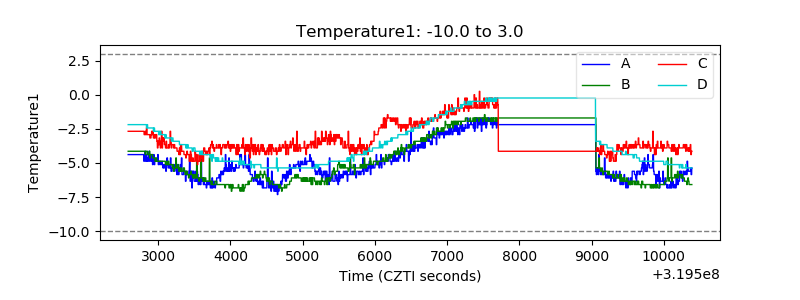 |
| Veto HV Monitor | 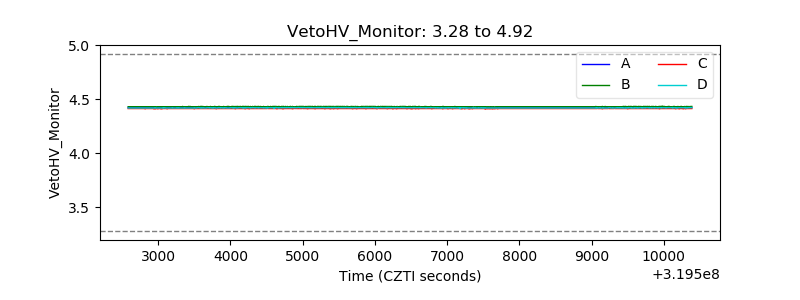 |
| Veto LLD |  |
| Alpha Counter | 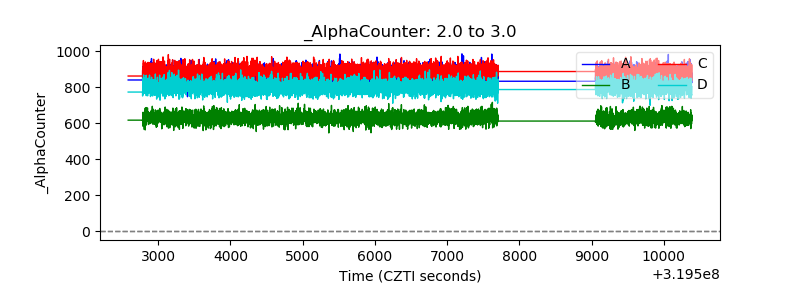 |
| _CPM_Rate | 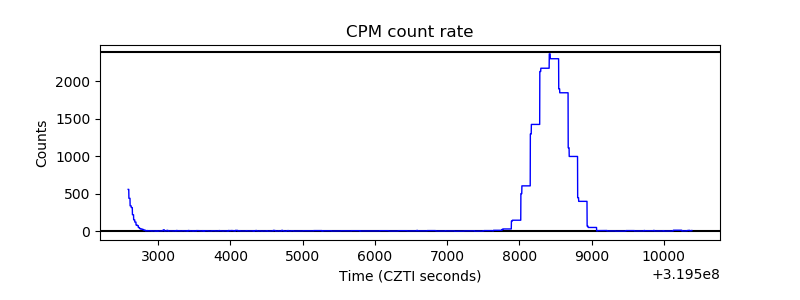 |
| CZT Counter | 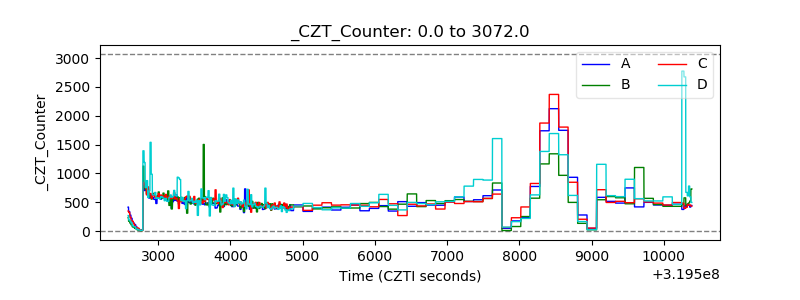 |
| +2.5 Volts monitor |  |
| +5 Volts monitor |  |
| _ROLL_ROT |  |
| _Roll_DEC | 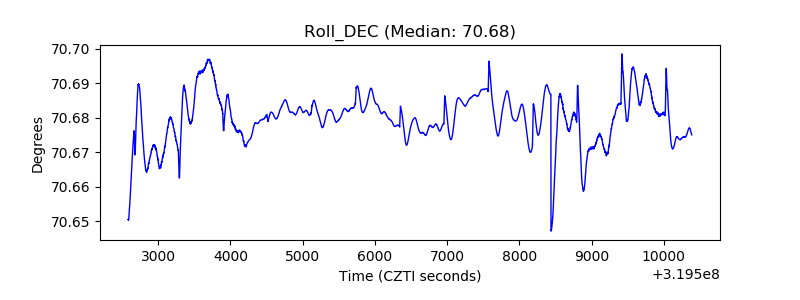 |
| _Roll_RA | 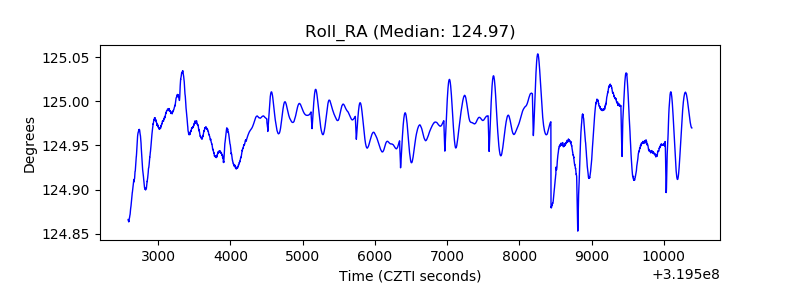 |
| Veto Counter | 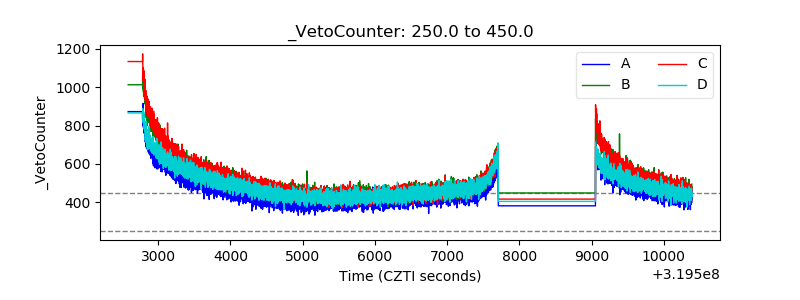 |