| Param | Original file | Final file |
|---|---|---|
| Filename | modeM0/AS1A07_054T01_9000003504_23711cztM0_level2.evt | modeM0/AS1A07_054T01_9000003504_23711cztM0_level2_quad_clean.evt |
| Size (bytes) | 486,100,800 | 130,279,680 |
| Size | 463.6 MB | 124.2 MB |
| Events in quadrant A | 2,982,761 | 888,279 |
| Events in quadrant B | 3,246,541 | 912,063 |
| Events in quadrant C | 3,087,033 | 873,518 |
| Events in quadrant D | 4,967,120 | 821,743 |
| Mode M0 | |||
|---|---|---|---|
| Quadrant | BADHDUFLAG | Total packets | Discarded packets |
| A | 0 | 13177 | 2 |
| B | 0 | 13881 | 2 |
| C | 0 | 13305 | 2 |
| D | 0 | 19210 | 2 |
| Mode SS | |||
|---|---|---|---|
| Quadrant | BADHDUFLAG | Total packets | Discarded packets |
| A | 0 | 132 | 0 |
| B | 0 | 132 | 0 |
| C | 0 | 132 | 0 |
| D | 0 | 132 | 0 |
| Mode M9 | |||
|---|---|---|---|
| Quadrant | BADHDUFLAG | Total packets | Discarded packets |
| A | 0 | 15 | 0 |
| B | 0 | 16 | 0 |
| C | 0 | 16 | 0 |
| D | 0 | 16 | 0 |
| Quadrant | Total seconds | Saturated seconds | Saturation percentage |
|---|---|---|---|
| A | 6453 | 10 | 0.154967% |
| B | 6453 | 34 | 0.526887% |
| C | 6453 | 63 | 0.976290% |
| D | 6453 | 211 | 3.269797% |
Noise dominated data is calculated using 1-second bins in cleaned event files. If a bin has >2000 counts, and if more than 50% of those come from <1% of pixels, then it is considered to be noise-dominated and hence unusable.
| Quadrant | # 1 sec bins | Bins with >0 counts | Bins with >2000 counts | High rate bins dominated by noise | Noise dominated (total time) | Noise dominated (detector-on time) | Marked lightcurve |
|---|---|---|---|---|---|---|---|
| A | 7623 | 6454 | 0 | 0 | 0.00% | 0.00% | 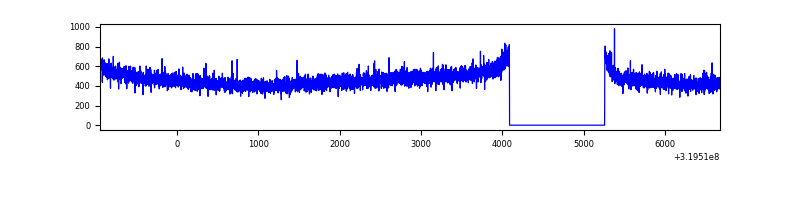 |
| B | 7623 | 6454 | 4 | 4 | 0.05% | 0.06% | 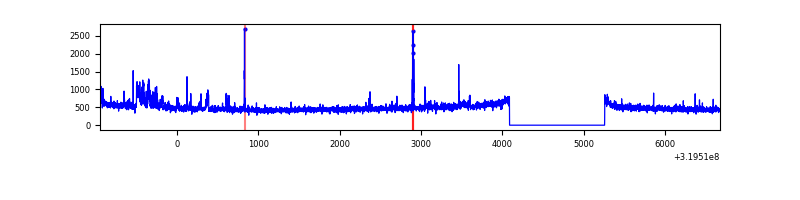 |
| C | 7623 | 6454 | 0 | 0 | 0.00% | 0.00% | 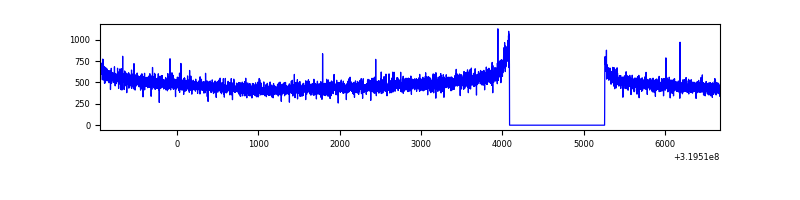 |
| D | 7623 | 6454 | 155 | 155 | 2.03% | 2.40% | 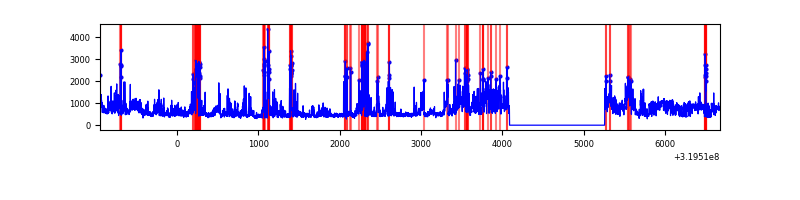 |
Top three noisy pixels from each quadrant. If the there are fewer than three noisy pixels in the level2.evt file, extra rows are filled as -1
| Pixel properties | Quadrant properties | ||||||
|---|---|---|---|---|---|---|---|
| Quadrant | DetID | PixID | Counts | Sigma | Mean | Median | Sigma |
| A | 13 | 254 | 10181 | 61.49 | 773 | 757 | 153.3 |
| A | 3 | 137 | 6650 | 38.45 | 773 | 757 | 153.3 |
| A | 0 | 226 | 6643 | 38.41 | 773 | 757 | 153.3 |
| B | 0 | 229 | 133670 | 914.04 | 783 | 765 | 145.4 |
| B | 14 | 207 | 18382 | 121.16 | 783 | 765 | 145.4 |
| B | 12 | 111 | 17142 | 112.63 | 783 | 765 | 145.4 |
| C | 14 | 238 | 122890 | 698.24 | 756 | 764 | 174.9 |
| C | 10 | 23 | 12501 | 67.1 | 756 | 764 | 174.9 |
| C | 13 | 61 | 5475 | 26.93 | 756 | 764 | 174.9 |
| D | 1 | 52 | 1969697 | 11043.1 | 741 | 719 | 178.3 |
| D | 12 | 233 | 83996 | 467.06 | 741 | 719 | 178.3 |
| D | 9 | 35 | 80737 | 448.78 | 741 | 719 | 178.3 |
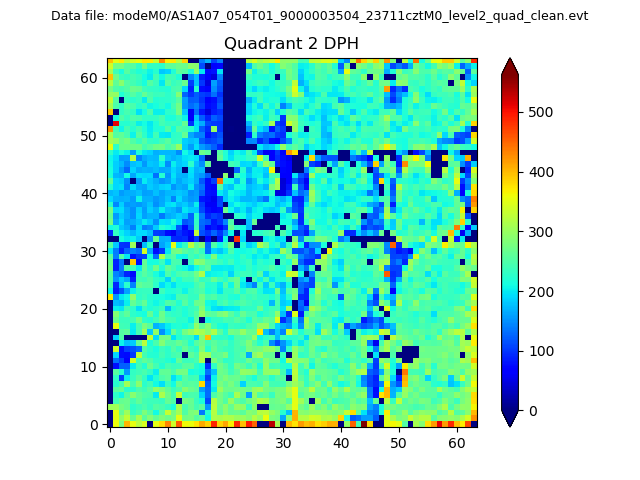
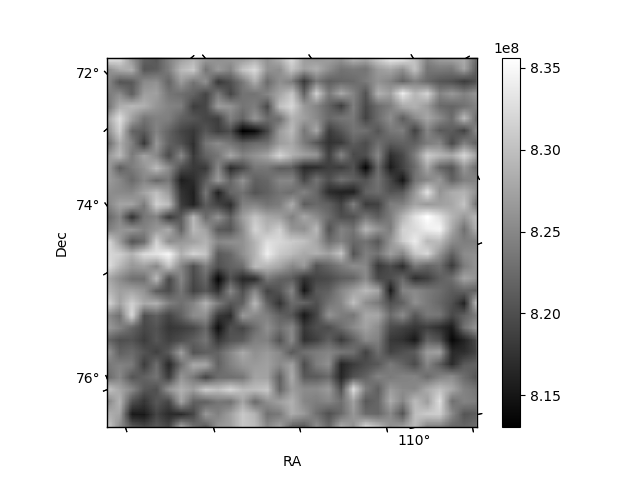
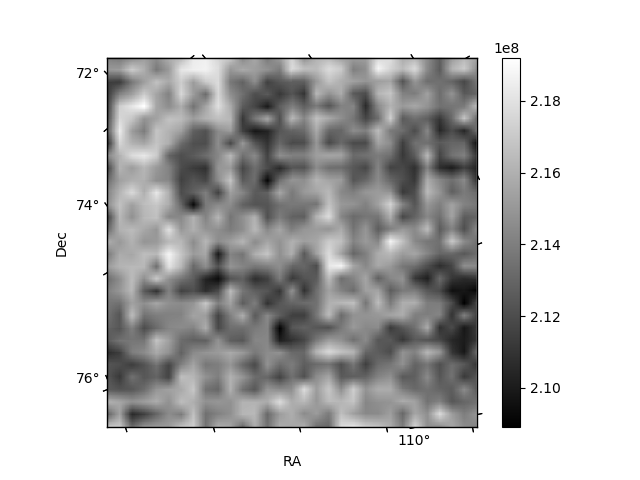
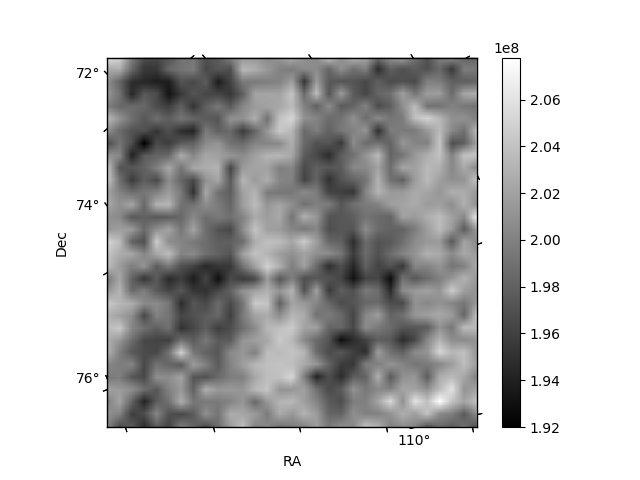
Histogram calculated using DETX and DETY for each event in the final _common_clean file
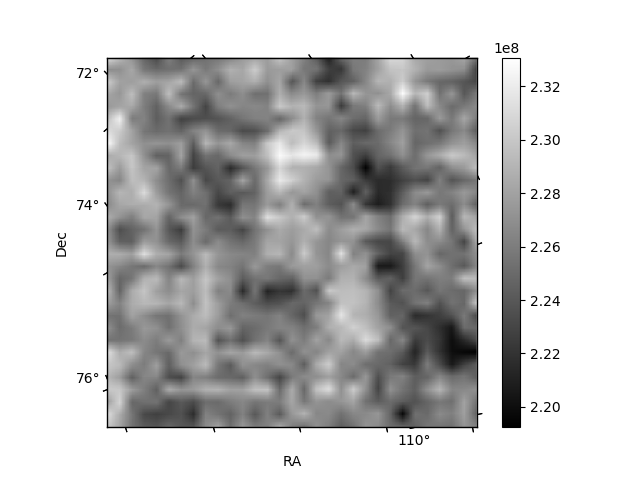
| Quadrant A | 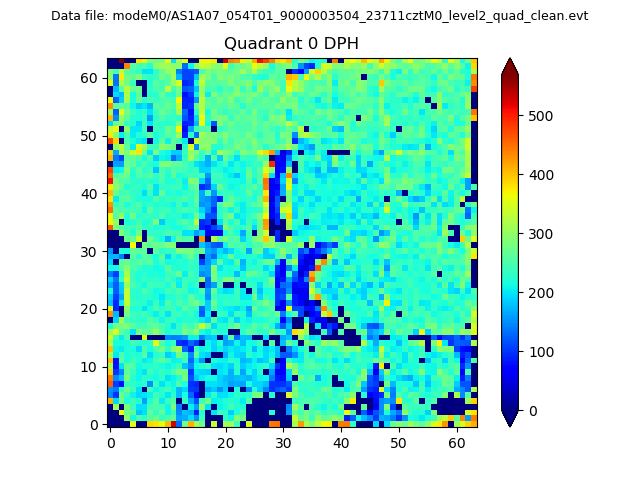 |
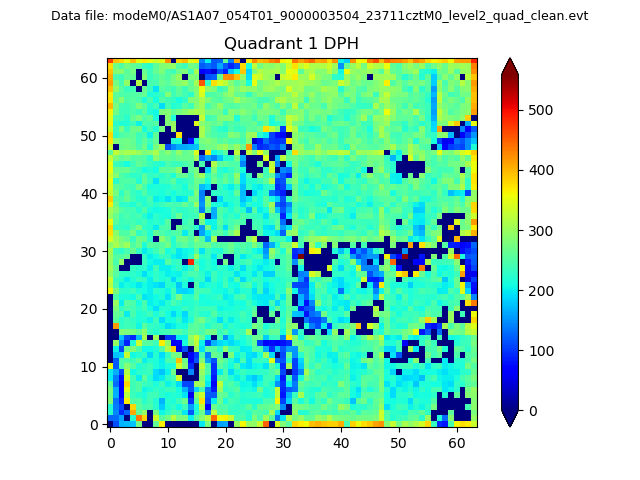 |
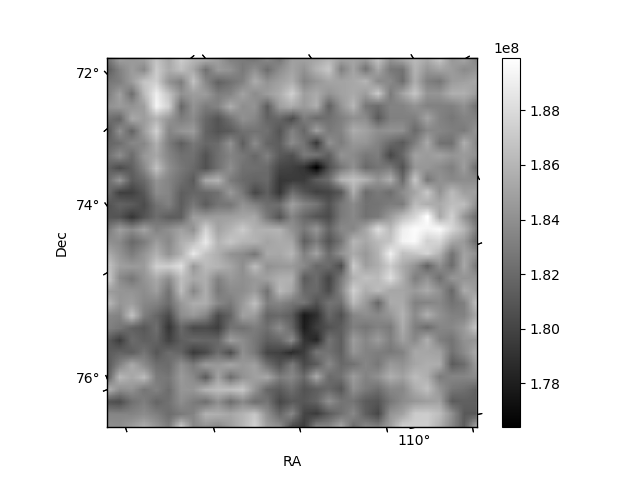
Quadrant B |
|---|---|---|---|
| Quadrant D | 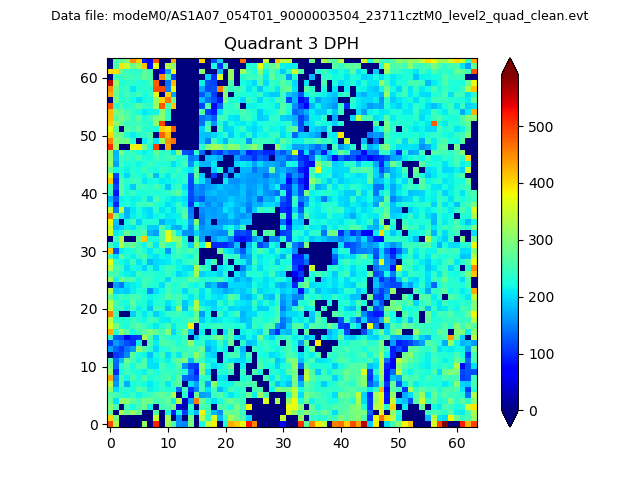 |
 |
Quadrant C |
| Plot type | Count rate plots | Images |
|---|---|---|
| Comparison with Poisson distribution Blue bars denote a histogram of data divided into 1 sec bins. Red curve is a Poisson curve with rate = median count rate of data. |
 |
 |
| Quadrant-wise count rates Data is divided into 100 sec bins |
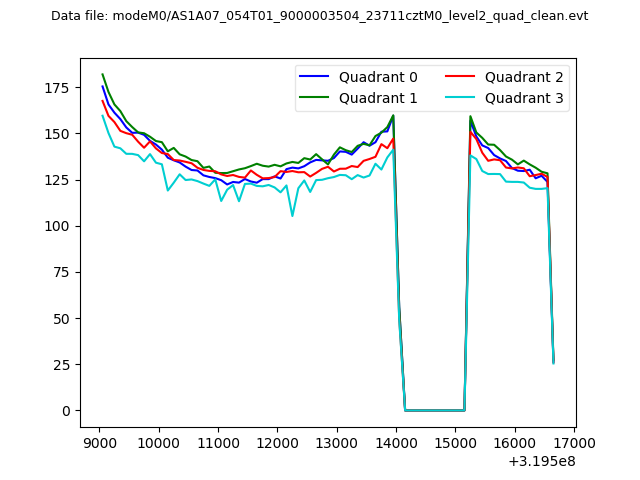 |
|
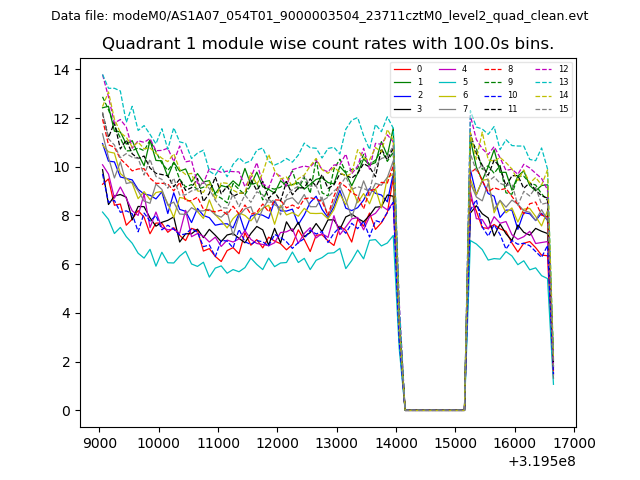
| Module-wise count rates for Quadrant A Data is divided into 100 sec bins |
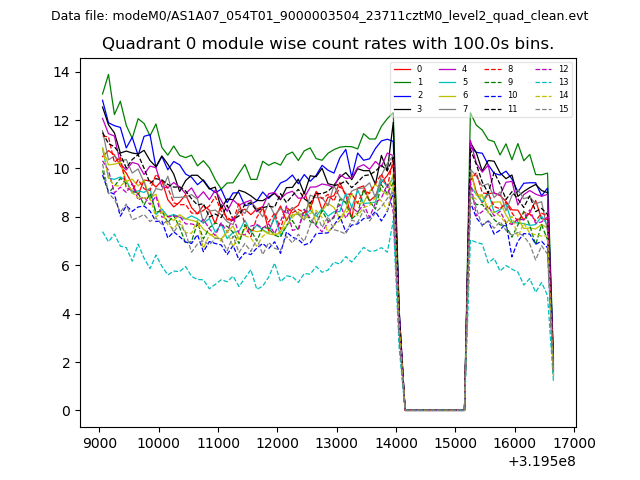 |
 |
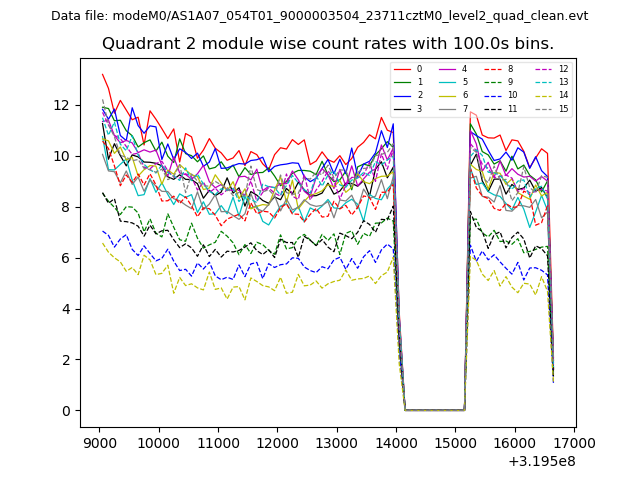
| Module-wise count rates for Quadrant B Data is divided into 100 sec bins |
 |
 |
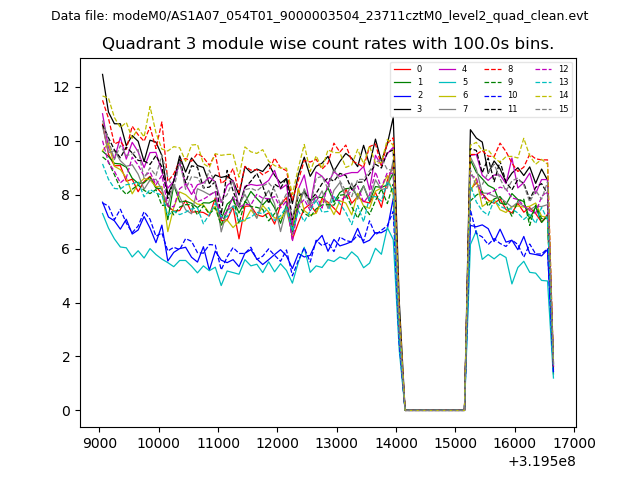
| Module-wise count rates for Quadrant C Data is divided into 100 sec bins |
 |
 |
| Module-wise count rates for Quadrant D Data is divided into 100 sec bins |
 |
 |
| Parameter | Plot |
|---|---|
| CZT HV Monitor | 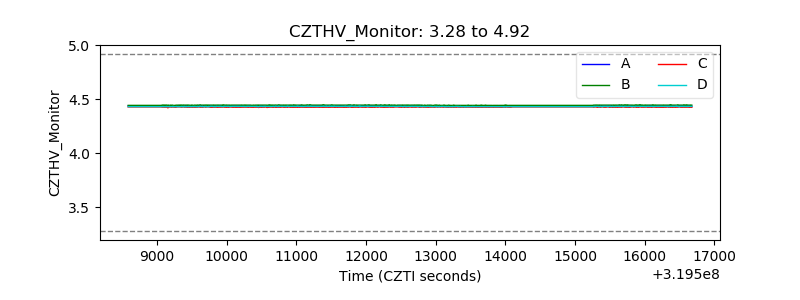 |
| D_VDD | 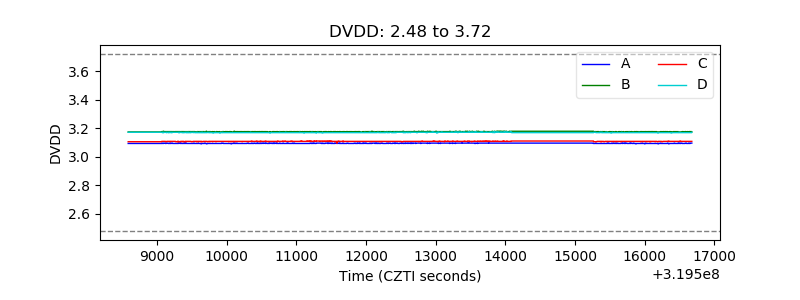 |
| Temperature 1 | 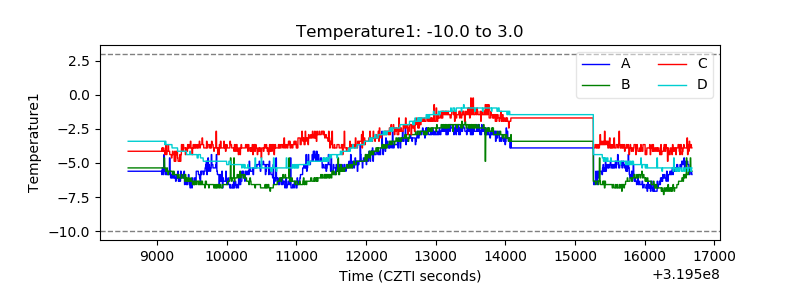 |
| Veto HV Monitor | 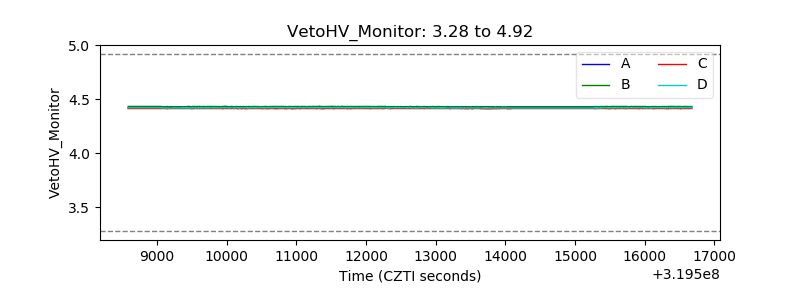 |
| Veto LLD | 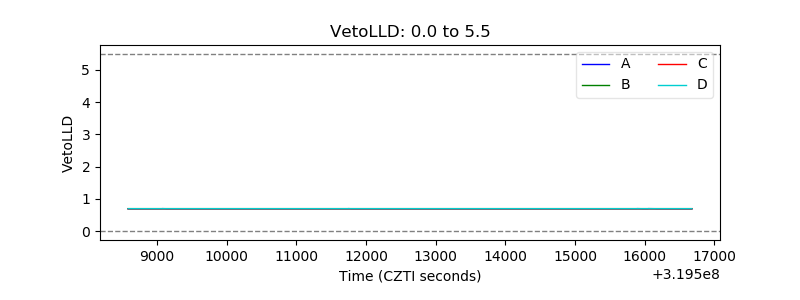 |
| Alpha Counter | 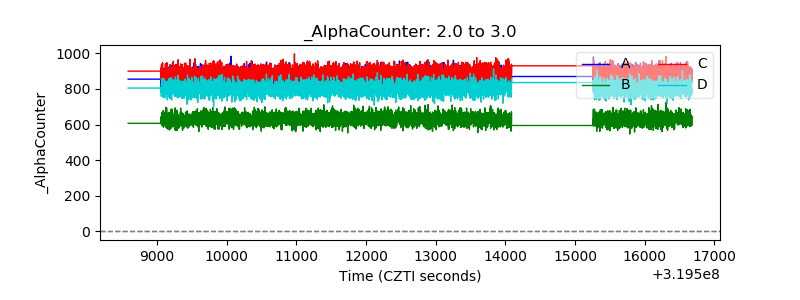 |
| _CPM_Rate | 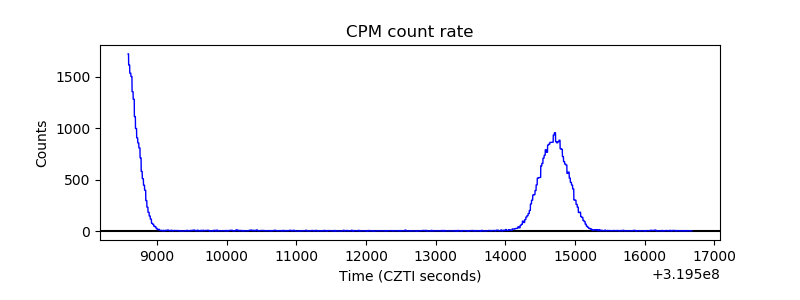 |
| CZT Counter | 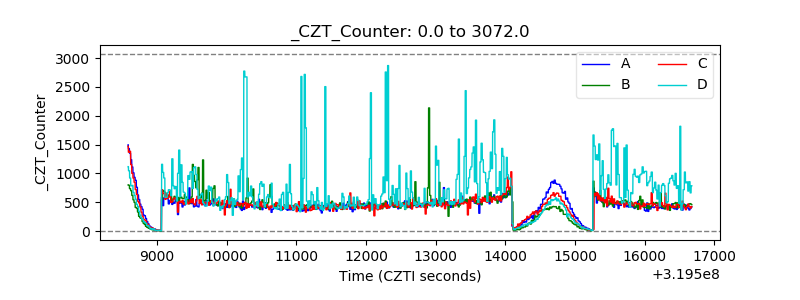 |
| +2.5 Volts monitor |  |
| +5 Volts monitor | 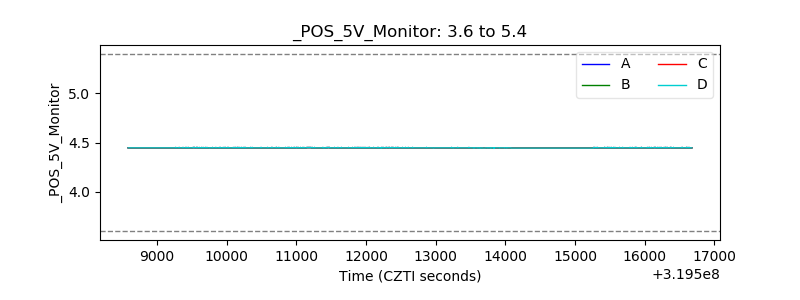 |
| _ROLL_ROT | 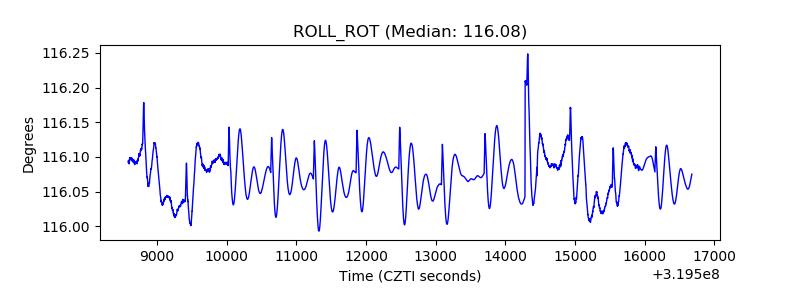 |
| _Roll_DEC | 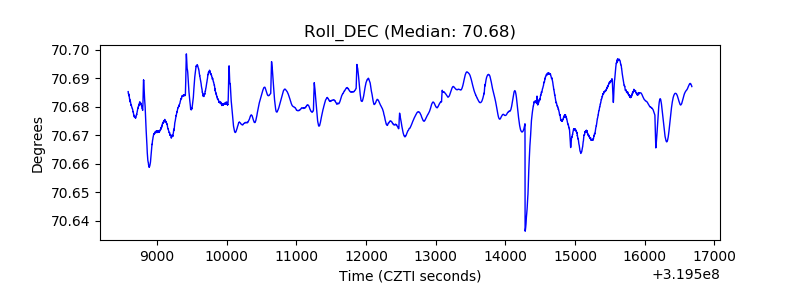 |
| _Roll_RA | 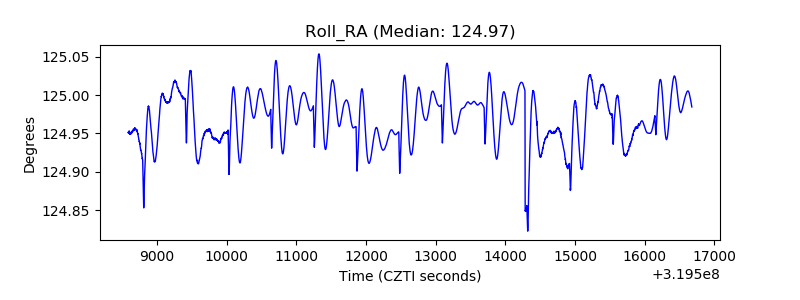 |
| Veto Counter | 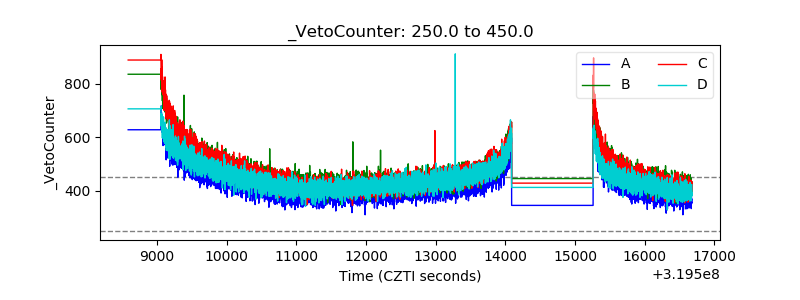 |