| Param | Original file | Final file |
|---|---|---|
| Filename | modeM0/AS1A07_054T01_9000003504_23712cztM0_level2.evt | modeM0/AS1A07_054T01_9000003504_23712cztM0_level2_quad_clean.evt |
| Size (bytes) | 504,103,680 | 134,876,160 |
| Size | 480.8 MB | 128.6 MB |
| Events in quadrant A | 3,162,717 | 910,807 |
| Events in quadrant B | 3,313,864 | 930,775 |
| Events in quadrant C | 3,309,938 | 898,570 |
| Events in quadrant D | 5,002,521 | 854,823 |
| Mode M0 | |||
|---|---|---|---|
| Quadrant | BADHDUFLAG | Total packets | Discarded packets |
| A | 0 | 14290 | 2 |
| B | 0 | 14574 | 2 |
| C | 0 | 14598 | 2 |
| D | 0 | 19855 | 2 |
| Mode SS | |||
|---|---|---|---|
| Quadrant | BADHDUFLAG | Total packets | Discarded packets |
| A | 0 | 144 | 0 |
| B | 0 | 144 | 0 |
| C | 0 | 144 | 0 |
| D | 0 | 144 | 0 |
| Mode M9 | |||
|---|---|---|---|
| Quadrant | BADHDUFLAG | Total packets | Discarded packets |
| A | 0 | 13 | 0 |
| B | 0 | 14 | 0 |
| C | 0 | 14 | 0 |
| D | 0 | 14 | 0 |
| Quadrant | Total seconds | Saturated seconds | Saturation percentage |
|---|---|---|---|
| A | 7034 | 28 | 0.398067% |
| B | 7034 | 67 | 0.952516% |
| C | 7034 | 106 | 1.506966% |
| D | 7034 | 140 | 1.990333% |
Noise dominated data is calculated using 1-second bins in cleaned event files. If a bin has >2000 counts, and if more than 50% of those come from <1% of pixels, then it is considered to be noise-dominated and hence unusable.
| Quadrant | # 1 sec bins | Bins with >0 counts | Bins with >2000 counts | High rate bins dominated by noise | Noise dominated (total time) | Noise dominated (detector-on time) | Marked lightcurve |
|---|---|---|---|---|---|---|---|
| A | 7889 | 7035 | 0 | 0 | 0.00% | 0.00% | 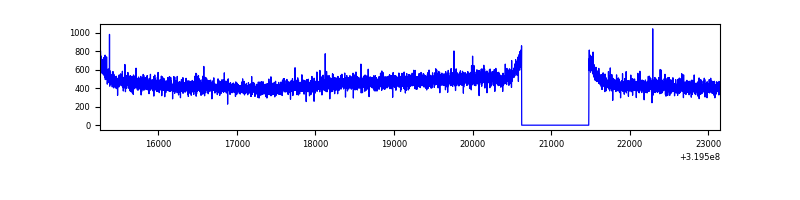 |
| B | 7889 | 7035 | 4 | 4 | 0.05% | 0.06% | 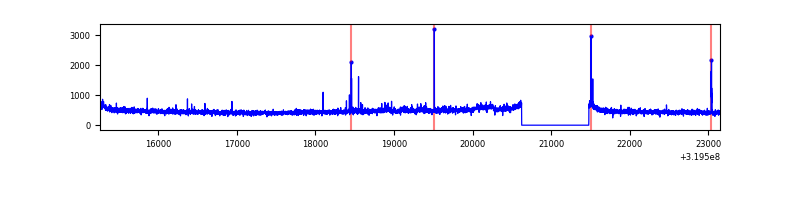 |
| C | 7889 | 7034 | 6 | 6 | 0.08% | 0.09% | 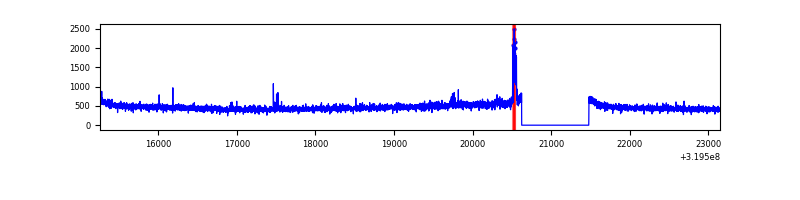 |
| D | 7889 | 7034 | 104 | 104 | 1.32% | 1.48% | 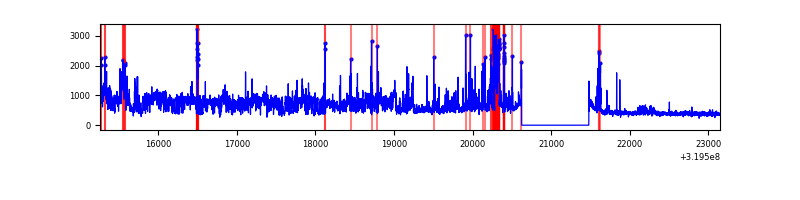 |
Top three noisy pixels from each quadrant. If the there are fewer than three noisy pixels in the level2.evt file, extra rows are filled as -1
| Pixel properties | Quadrant properties | ||||||
|---|---|---|---|---|---|---|---|
| Quadrant | DetID | PixID | Counts | Sigma | Mean | Median | Sigma |
| A | 13 | 254 | 10895 | 61.62 | 819 | 802 | 163.8 |
| A | 3 | 137 | 7213 | 39.14 | 819 | 802 | 163.8 |
| A | 0 | 226 | 7041 | 38.09 | 819 | 802 | 163.8 |
| B | 4 | 200 | 22096 | 138.4 | 825 | 804 | 153.8 |
| B | 12 | 111 | 18906 | 117.67 | 825 | 804 | 153.8 |
| B | 11 | 111 | 16580 | 102.55 | 825 | 804 | 153.8 |
| C | 14 | 238 | 130698 | 706.58 | 794 | 800 | 183.8 |
| C | 7 | 247 | 83412 | 449.37 | 794 | 800 | 183.8 |
| C | 13 | 61 | 5508 | 25.61 | 794 | 800 | 183.8 |
| D | 1 | 52 | 1825868 | 9732.74 | 787 | 764 | 187.5 |
| D | 9 | 35 | 107405 | 568.68 | 787 | 764 | 187.5 |
| D | 12 | 233 | 39365 | 205.85 | 787 | 764 | 187.5 |
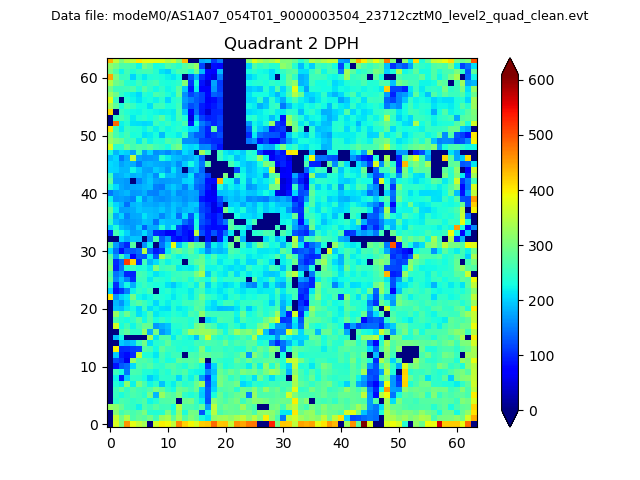
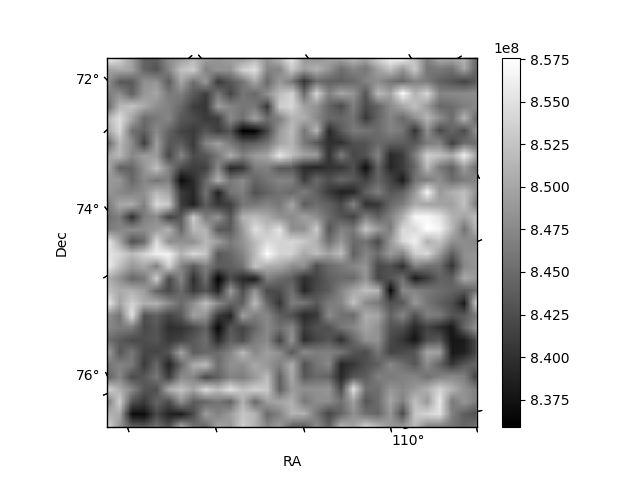
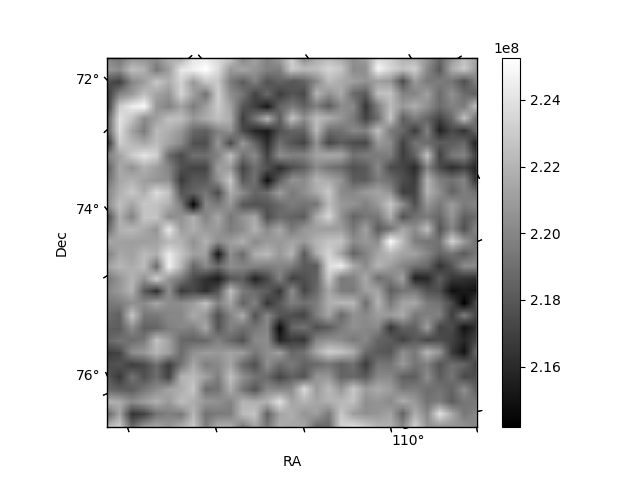
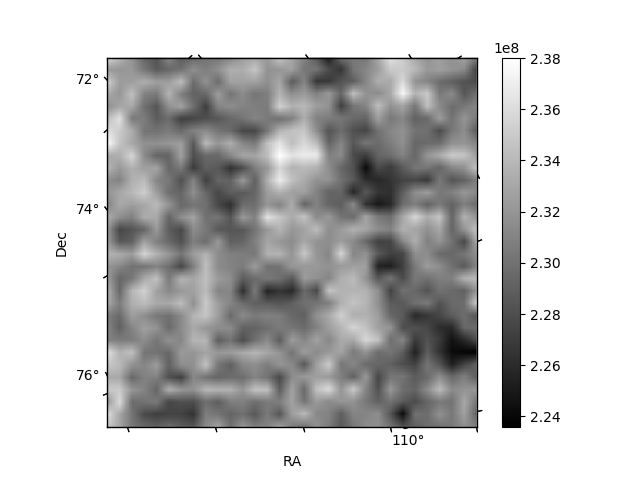
Histogram calculated using DETX and DETY for each event in the final _common_clean file
| Quadrant A | 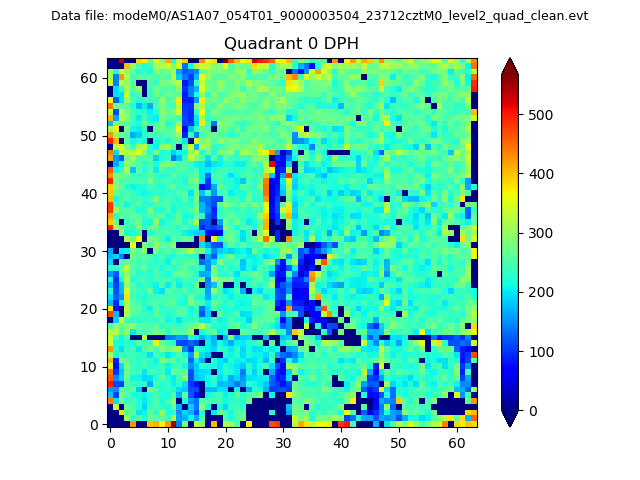 |
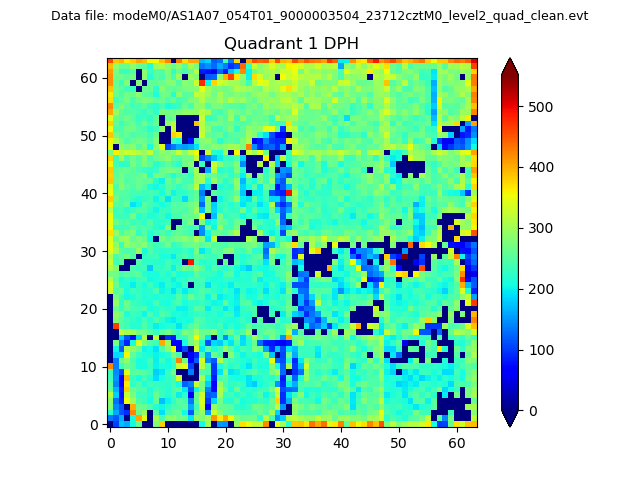 |
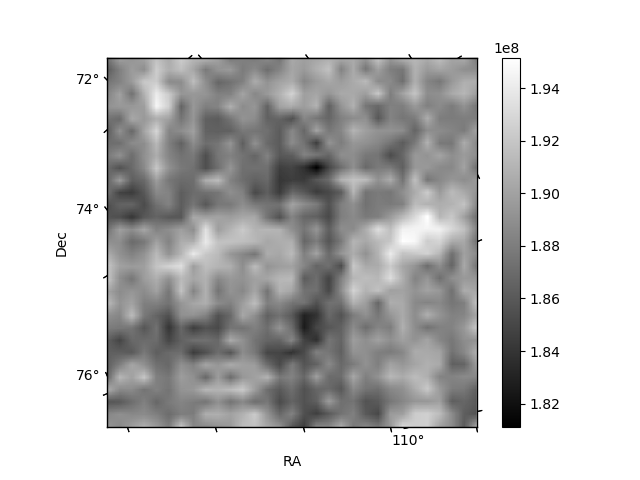
Quadrant B |
|---|---|---|---|
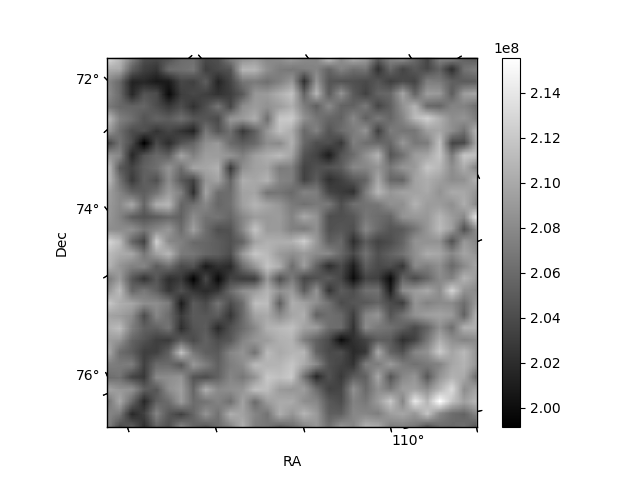
| Quadrant D | 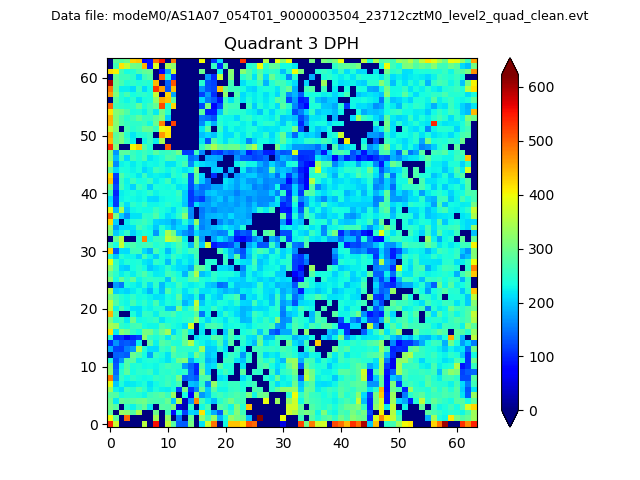 |
 |
Quadrant C |
| Plot type | Count rate plots | Images |
|---|---|---|
| Comparison with Poisson distribution Blue bars denote a histogram of data divided into 1 sec bins. Red curve is a Poisson curve with rate = median count rate of data. |
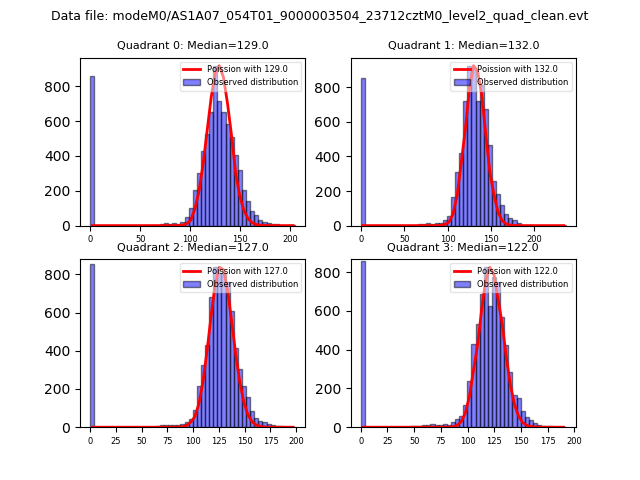 |
 |
| Quadrant-wise count rates Data is divided into 100 sec bins |
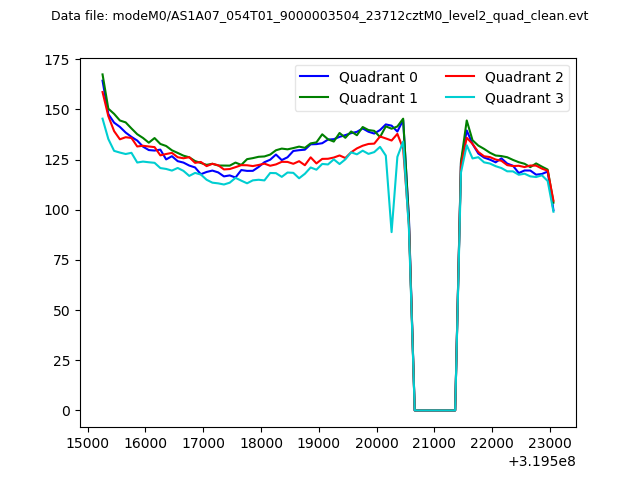 |
|
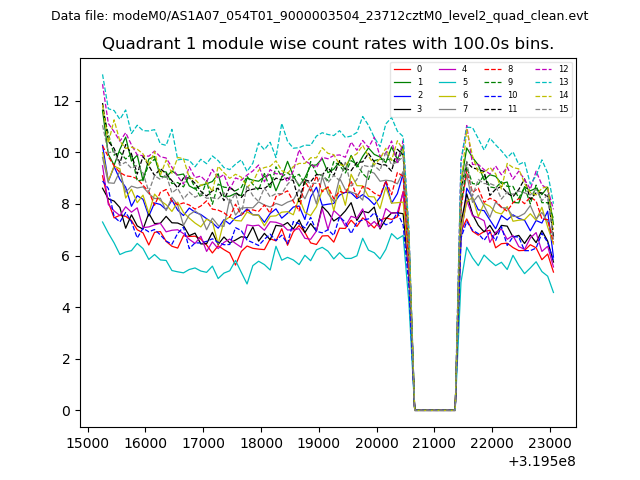
| Module-wise count rates for Quadrant A Data is divided into 100 sec bins |
 |
 |
| Module-wise count rates for Quadrant B Data is divided into 100 sec bins |
 |
 |
| Module-wise count rates for Quadrant C Data is divided into 100 sec bins |
 |
 |
| Module-wise count rates for Quadrant D Data is divided into 100 sec bins |
 |
 |
| Parameter | Plot |
|---|---|
| CZT HV Monitor | 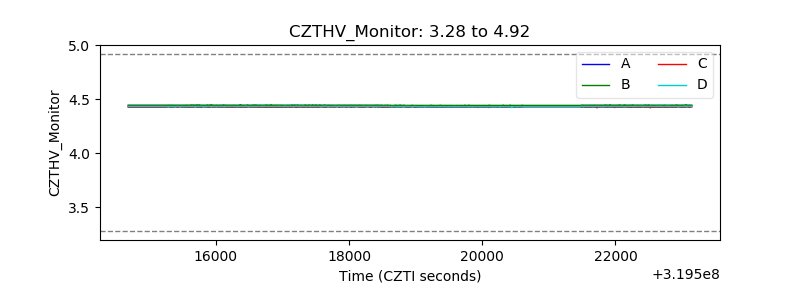 |
| D_VDD | 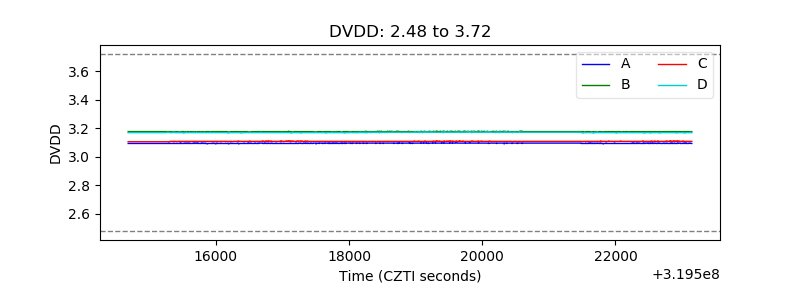 |
| Temperature 1 |  |
| Veto HV Monitor | 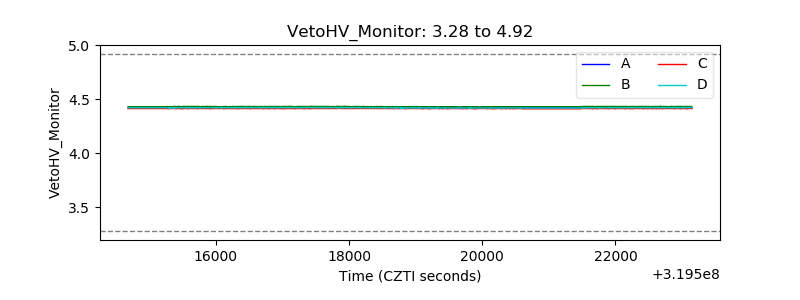 |
| Veto LLD |  |
| Alpha Counter | 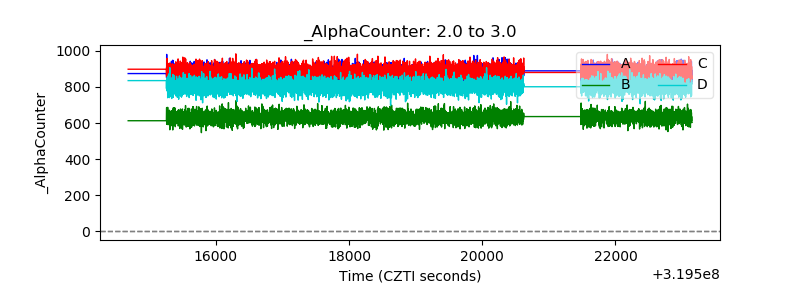 |
| _CPM_Rate | 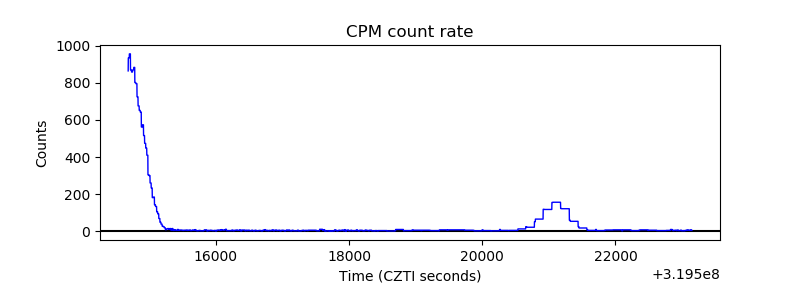 |
| CZT Counter | 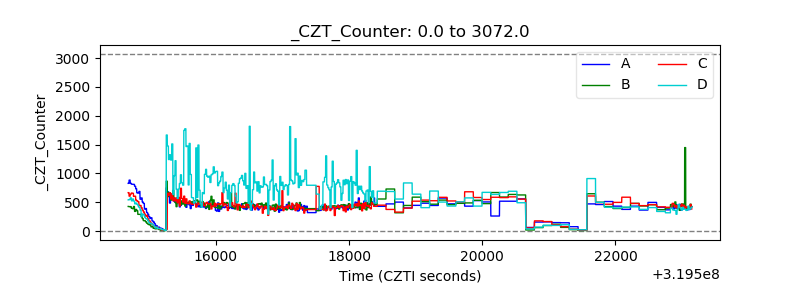 |
| +2.5 Volts monitor |  |
| +5 Volts monitor |  |
| _ROLL_ROT | 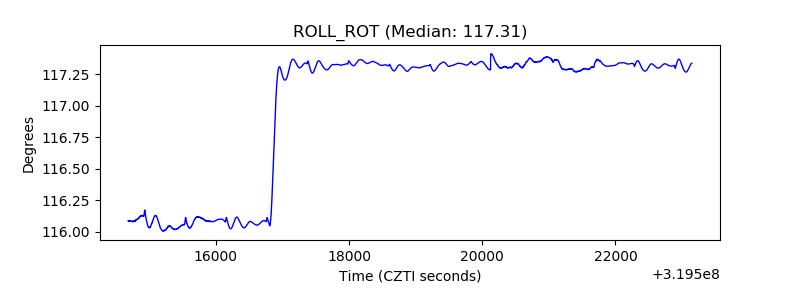 |
| _Roll_DEC | 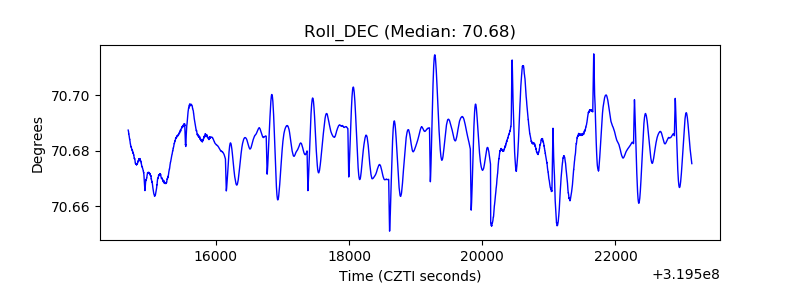 |
| _Roll_RA | 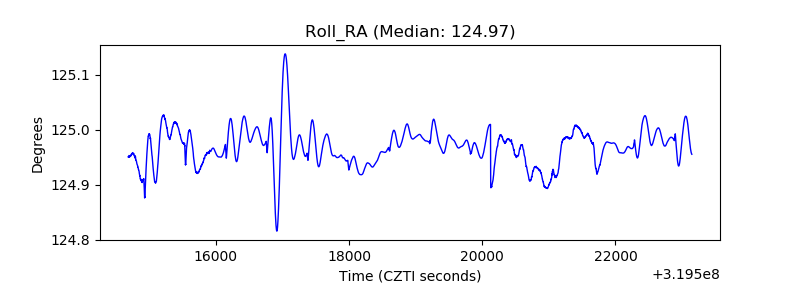 |
| Veto Counter | 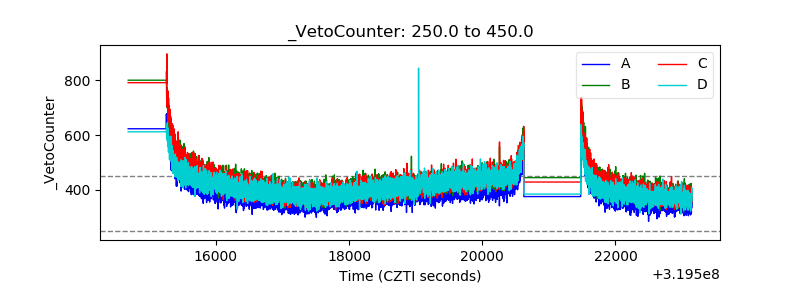 |