| Param | Original file | Final file |
|---|---|---|
| Filename | modeM0/AS1A07_054T01_9000003504_23713cztM0_level2.evt | modeM0/AS1A07_054T01_9000003504_23713cztM0_level2_quad_clean.evt |
| Size (bytes) | 511,312,320 | 138,746,880 |
| Size | 487.6 MB | 132.3 MB |
| Events in quadrant A | 3,322,092 | 930,964 |
| Events in quadrant B | 3,528,306 | 951,576 |
| Events in quadrant C | 3,427,611 | 919,784 |
| Events in quadrant D | 4,702,909 | 883,296 |
| Mode M0 | |||
|---|---|---|---|
| Quadrant | BADHDUFLAG | Total packets | Discarded packets |
| A | 0 | 15088 | 2 |
| B | 0 | 15468 | 2 |
| C | 0 | 15200 | 2 |
| D | 0 | 19400 | 2 |
| Mode SS | |||
|---|---|---|---|
| Quadrant | BADHDUFLAG | Total packets | Discarded packets |
| A | 0 | 152 | 0 |
| B | 0 | 152 | 0 |
| C | 0 | 152 | 0 |
| D | 0 | 152 | 0 |
| Mode M9 | |||
|---|---|---|---|
| Quadrant | BADHDUFLAG | Total packets | Discarded packets |
| A | 0 | 12 | 0 |
| B | 0 | 13 | 0 |
| C | 0 | 13 | 0 |
| D | 0 | 13 | 0 |
| Quadrant | Total seconds | Saturated seconds | Saturation percentage |
|---|---|---|---|
| A | 7427 | 69 | 0.929043% |
| B | 7427 | 125 | 1.683048% |
| C | 7427 | 93 | 1.252188% |
| D | 7427 | 122 | 1.642655% |
Noise dominated data is calculated using 1-second bins in cleaned event files. If a bin has >2000 counts, and if more than 50% of those come from <1% of pixels, then it is considered to be noise-dominated and hence unusable.
| Quadrant | # 1 sec bins | Bins with >0 counts | Bins with >2000 counts | High rate bins dominated by noise | Noise dominated (total time) | Noise dominated (detector-on time) | Marked lightcurve |
|---|---|---|---|---|---|---|---|
| A | 7872 | 7427 | 0 | 0 | 0.00% | 0.00% | 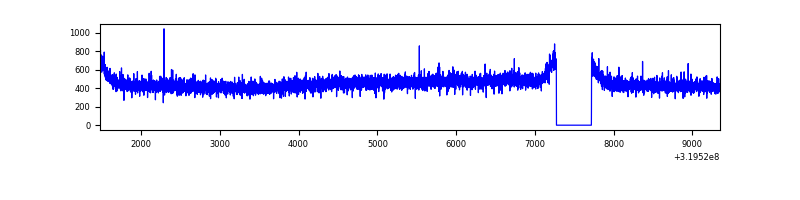 |
| B | 7872 | 7427 | 7 | 7 | 0.09% | 0.09% | 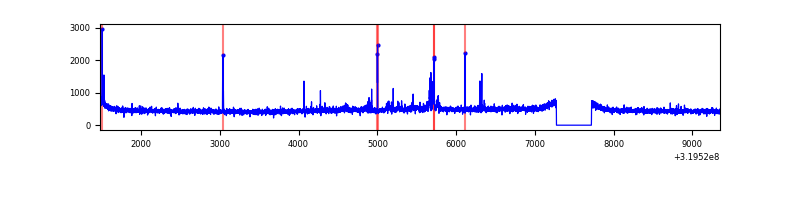 |
| C | 7872 | 7427 | 0 | 0 | 0.00% | 0.00% | 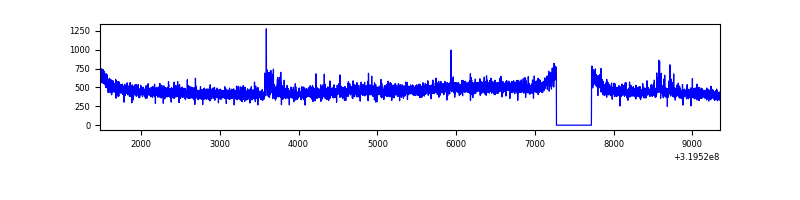 |
| D | 7872 | 7427 | 47 | 47 | 0.60% | 0.63% | 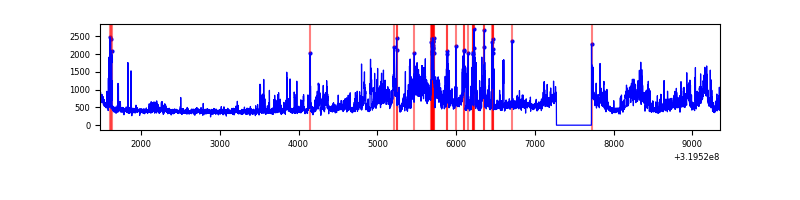 |
Top three noisy pixels from each quadrant. If the there are fewer than three noisy pixels in the level2.evt file, extra rows are filled as -1
| Pixel properties | Quadrant properties | ||||||
|---|---|---|---|---|---|---|---|
| Quadrant | DetID | PixID | Counts | Sigma | Mean | Median | Sigma |
| A | 13 | 254 | 11847 | 63.7 | 861 | 841 | 172.8 |
| A | 3 | 137 | 7694 | 39.67 | 861 | 841 | 172.8 |
| A | 0 | 226 | 7322 | 37.51 | 861 | 841 | 172.8 |
| B | 0 | 245 | 52746 | 316.87 | 863 | 838 | 163.8 |
| B | 0 | 189 | 41738 | 249.67 | 863 | 838 | 163.8 |
| B | 5 | 172 | 20940 | 122.71 | 863 | 838 | 163.8 |
| C | 14 | 238 | 131622 | 675.77 | 833 | 837 | 193.5 |
| C | 7 | 247 | 46040 | 233.57 | 833 | 837 | 193.5 |
| C | 13 | 61 | 5799 | 25.64 | 833 | 837 | 193.5 |
| D | 7 | 238 | 969309 | 4813.16 | 833 | 806 | 201.2 |
| D | 13 | 174 | 288063 | 1427.58 | 833 | 806 | 201.2 |
| D | 1 | 52 | 223065 | 1104.56 | 833 | 806 | 201.2 |
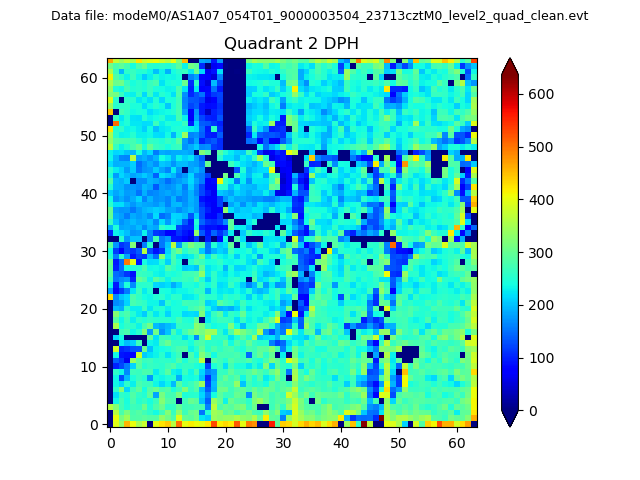
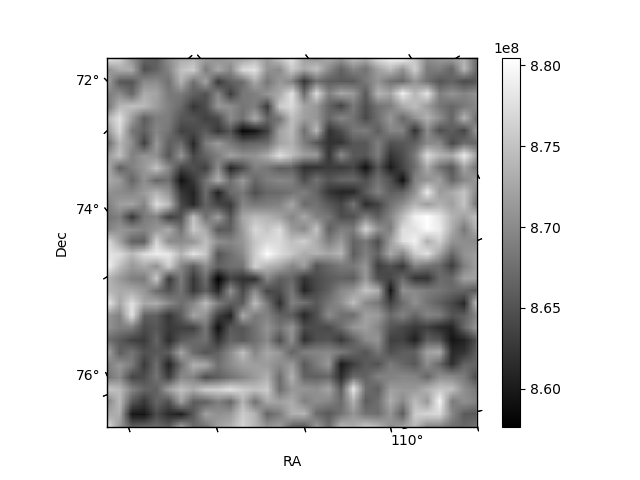
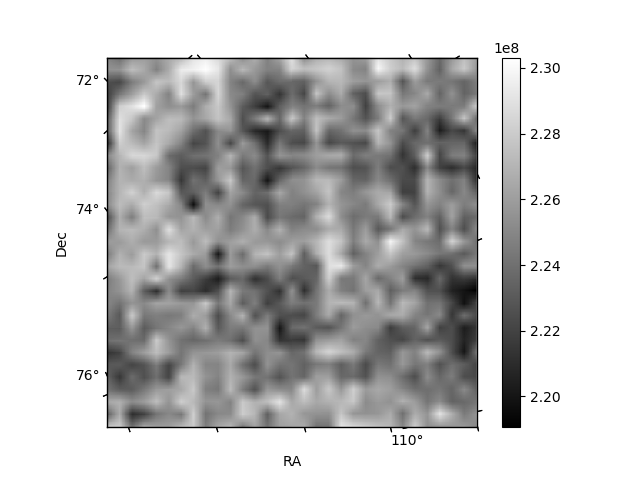
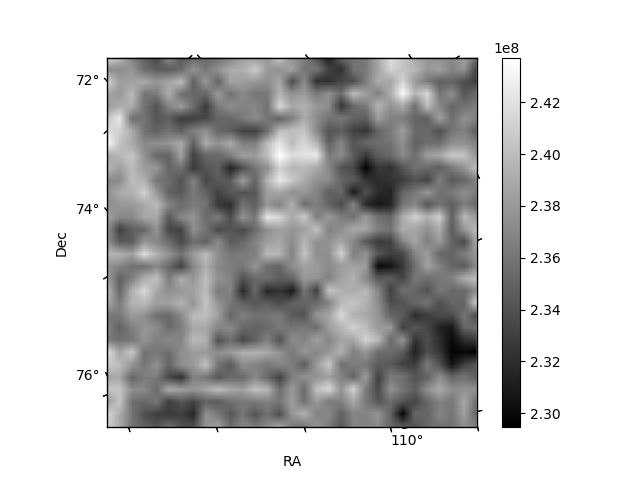
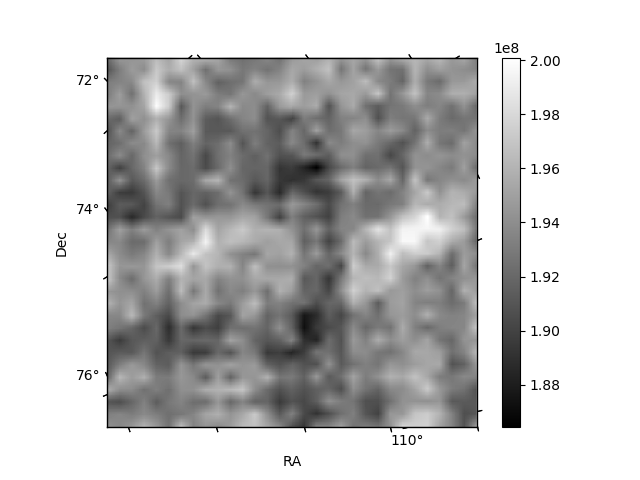
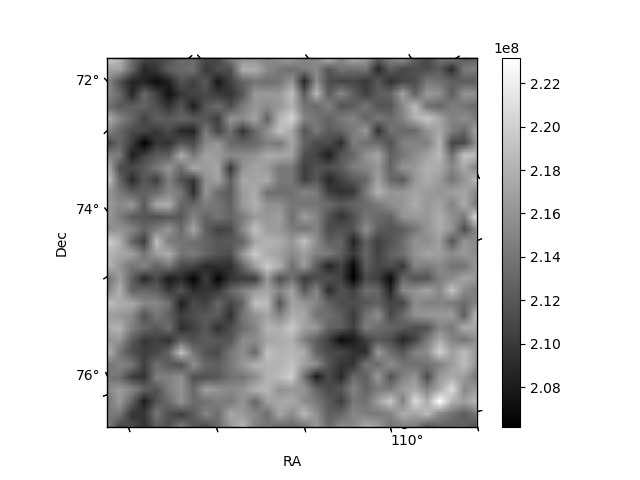
Histogram calculated using DETX and DETY for each event in the final _common_clean file
| Quadrant A | 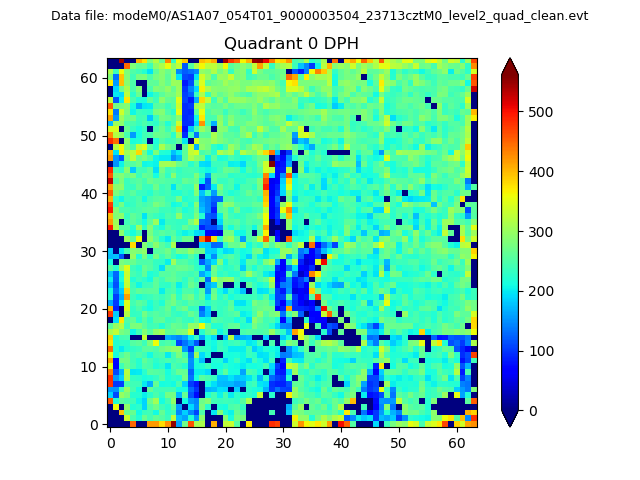 |
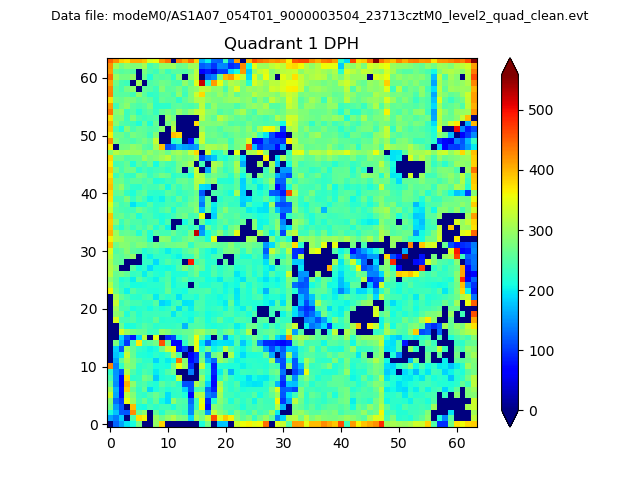 |
Quadrant B |
|---|---|---|---|
| Quadrant D | 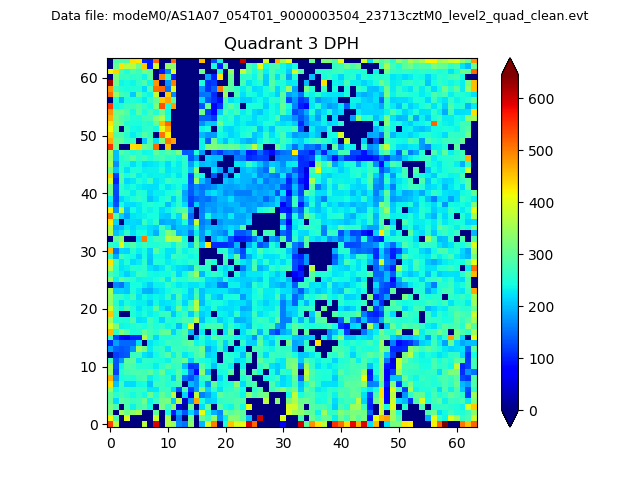 |
 |
Quadrant C |
| Plot type | Count rate plots | Images |
|---|---|---|
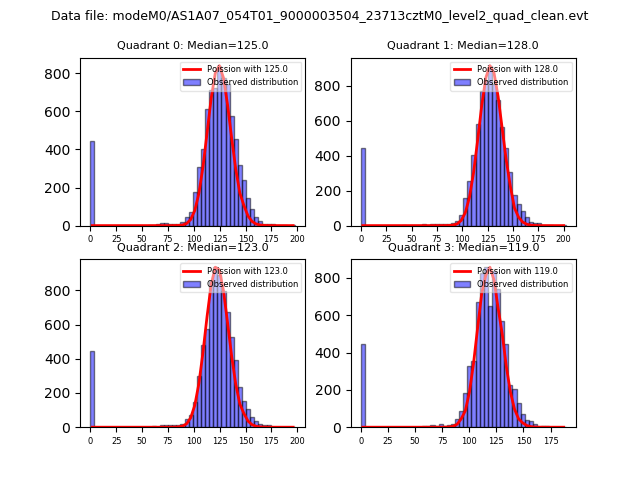
| Comparison with Poisson distribution Blue bars denote a histogram of data divided into 1 sec bins. Red curve is a Poisson curve with rate = median count rate of data. |
 |
 |
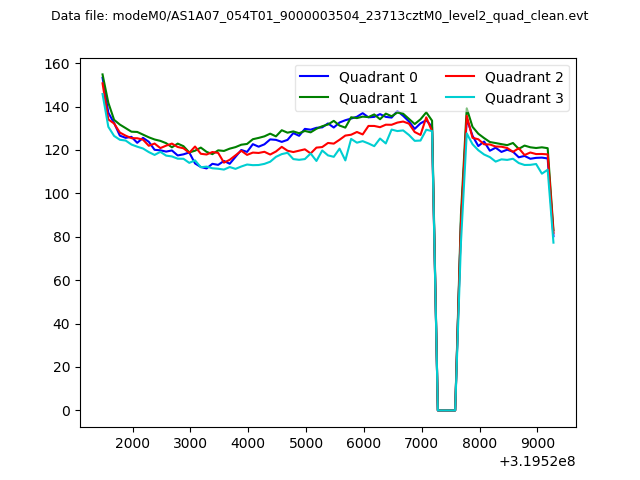
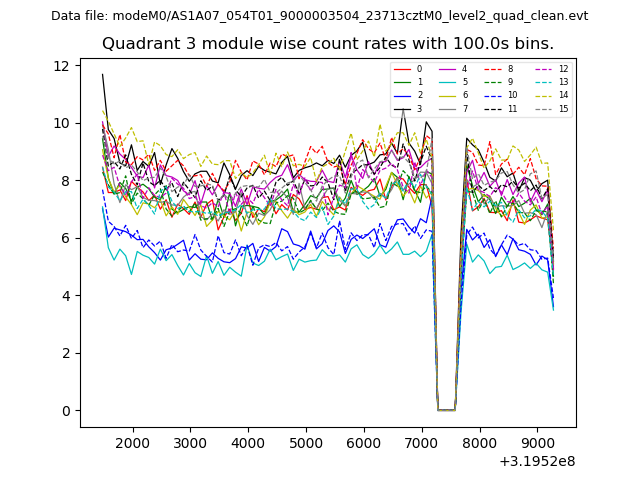
| Quadrant-wise count rates Data is divided into 100 sec bins |
 |
|
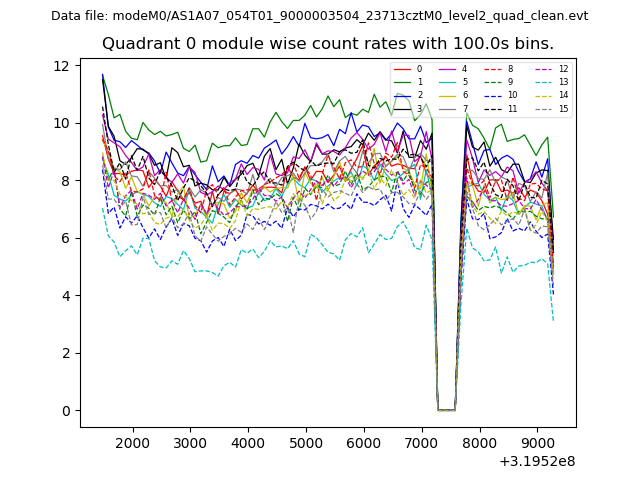
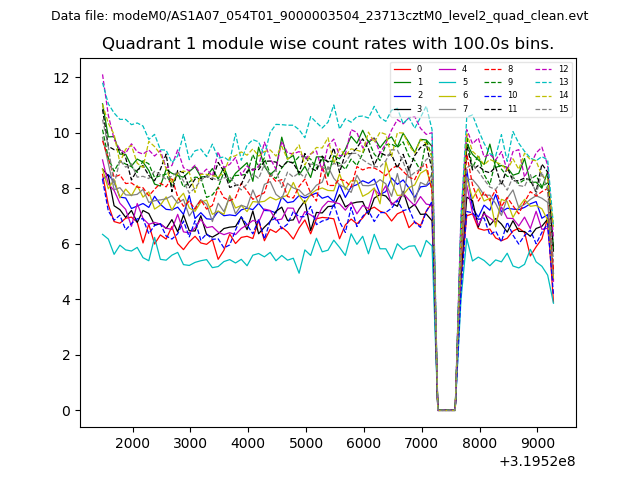
| Module-wise count rates for Quadrant A Data is divided into 100 sec bins |
 |
 |
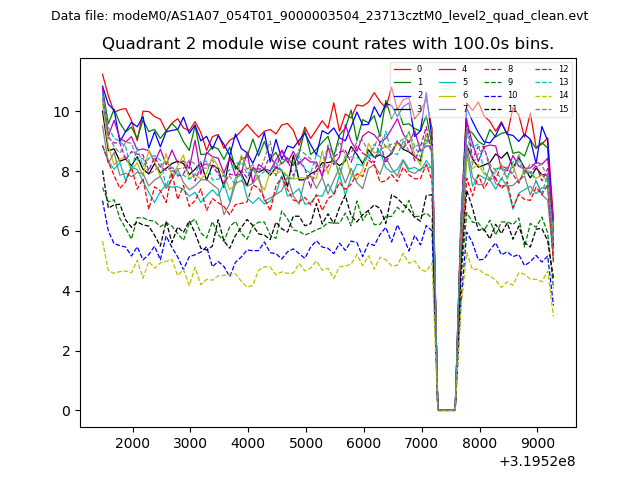
| Module-wise count rates for Quadrant B Data is divided into 100 sec bins |
 |
 |
| Module-wise count rates for Quadrant C Data is divided into 100 sec bins |
 |
 |
| Module-wise count rates for Quadrant D Data is divided into 100 sec bins |
 |
 |
| Parameter | Plot |
|---|---|
| CZT HV Monitor | 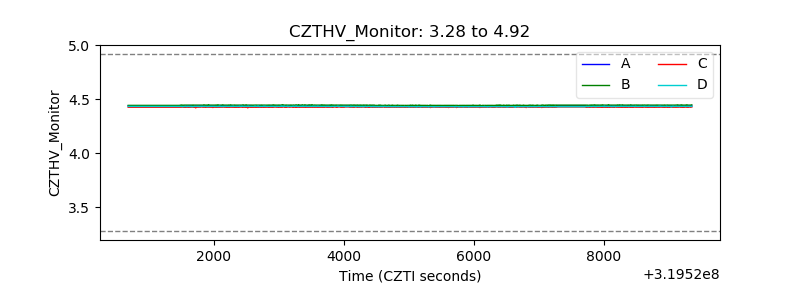 |
| D_VDD | 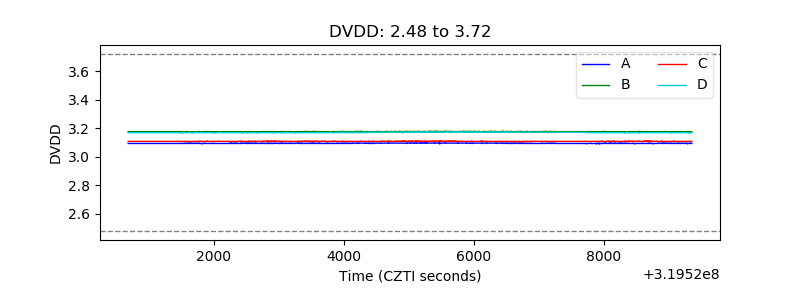 |
| Temperature 1 | 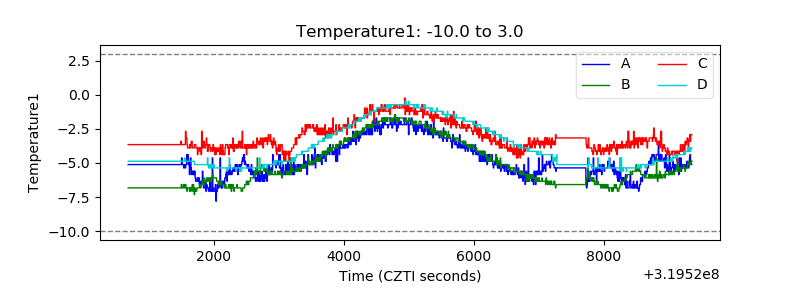 |
| Veto HV Monitor | 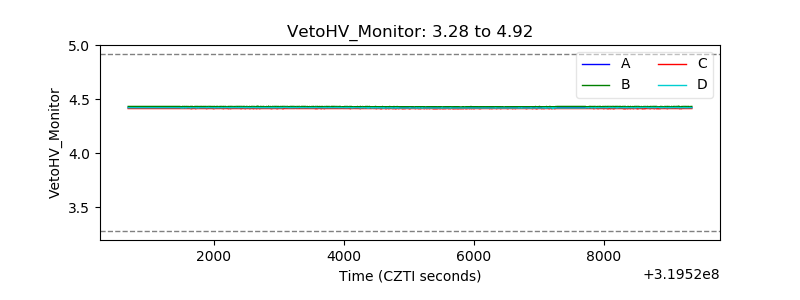 |
| Veto LLD |  |
| Alpha Counter | 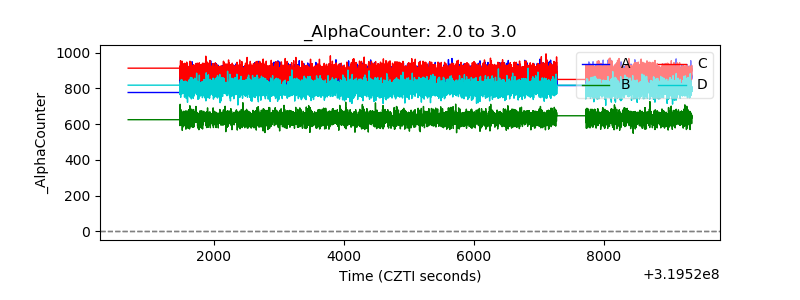 |
| _CPM_Rate | 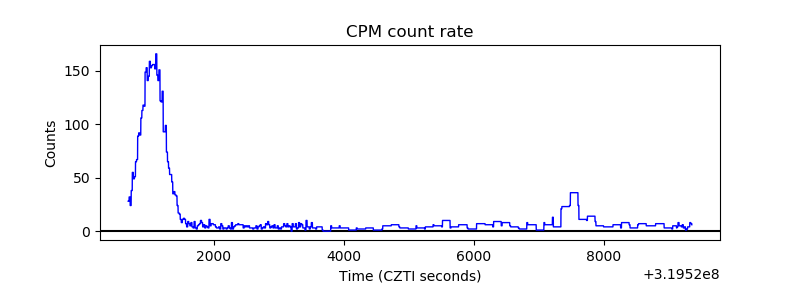 |
| CZT Counter | 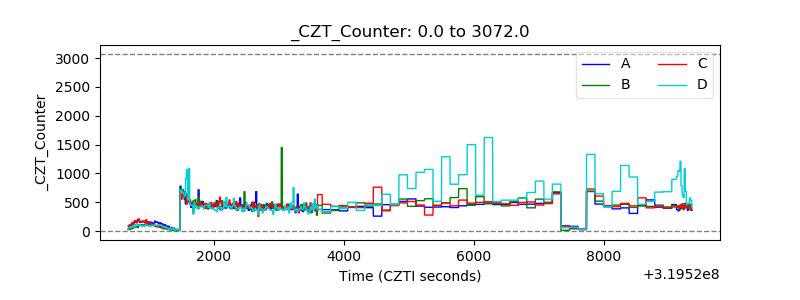 |
| +2.5 Volts monitor |  |
| +5 Volts monitor | 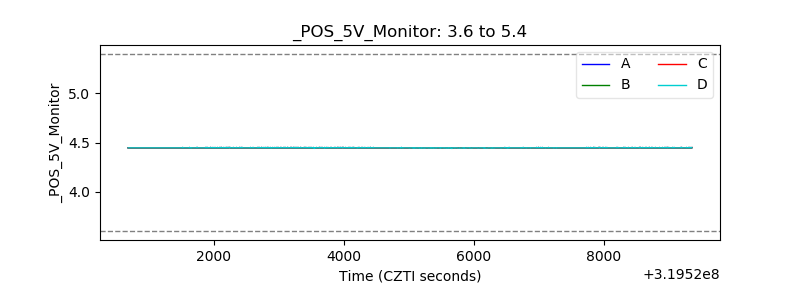 |
| _ROLL_ROT | 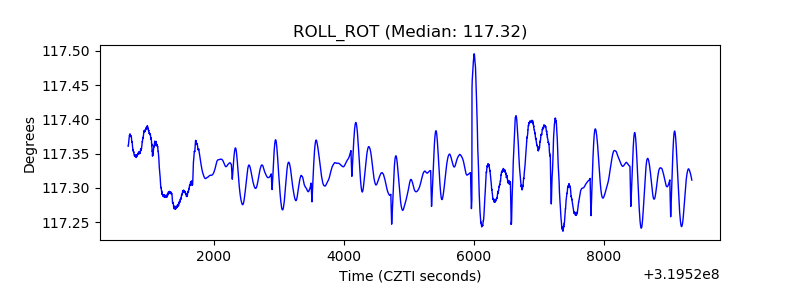 |
| _Roll_DEC | 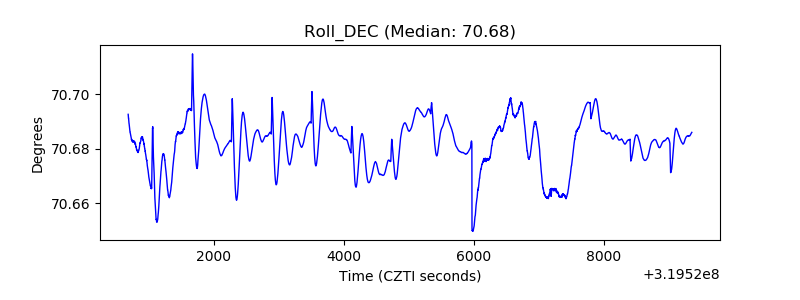 |
| _Roll_RA |  |
| Veto Counter | 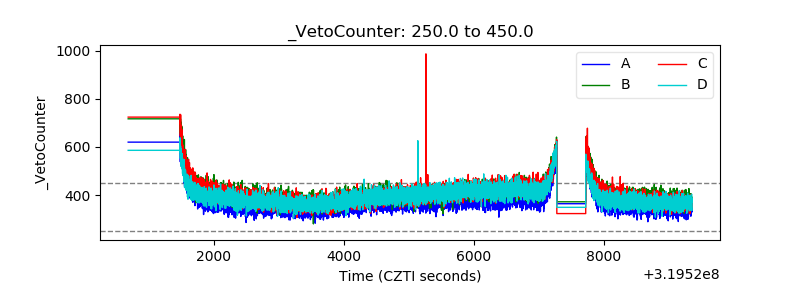 |