| Param | Original file | Final file |
|---|---|---|
| Filename | modeM0/AS1A07_054T01_9000003504_23714cztM0_level2.evt | modeM0/AS1A07_054T01_9000003504_23714cztM0_level2_quad_clean.evt |
| Size (bytes) | 509,806,080 | 126,705,600 |
| Size | 486.2 MB | 120.8 MB |
| Events in quadrant A | 3,104,839 | 853,136 |
| Events in quadrant B | 3,490,861 | 866,729 |
| Events in quadrant C | 3,289,515 | 835,986 |
| Events in quadrant D | 5,084,565 | 799,630 |
| Mode M0 | |||
|---|---|---|---|
| Quadrant | BADHDUFLAG | Total packets | Discarded packets |
| A | 0 | 14058 | 2 |
| B | 0 | 15023 | 2 |
| C | 0 | 14342 | 2 |
| D | 0 | 19840 | 2 |
| Mode SS | |||
|---|---|---|---|
| Quadrant | BADHDUFLAG | Total packets | Discarded packets |
| A | 0 | 142 | 0 |
| B | 0 | 142 | 0 |
| C | 0 | 142 | 0 |
| D | 0 | 142 | 0 |
| Mode M9 | |||
|---|---|---|---|
| Quadrant | BADHDUFLAG | Total packets | Discarded packets |
| A | 0 | 2 | 0 |
| B | 0 | 2 | 0 |
| C | 0 | 2 | 0 |
| D | 0 | 2 | 0 |
| Quadrant | Total seconds | Saturated seconds | Saturation percentage |
|---|---|---|---|
| A | 6916 | 144 | 2.082128% |
| B | 6917 | 215 | 3.108284% |
| C | 6917 | 162 | 2.342056% |
| D | 6917 | 311 | 4.496169% |
Noise dominated data is calculated using 1-second bins in cleaned event files. If a bin has >2000 counts, and if more than 50% of those come from <1% of pixels, then it is considered to be noise-dominated and hence unusable.
| Quadrant | # 1 sec bins | Bins with >0 counts | Bins with >2000 counts | High rate bins dominated by noise | Noise dominated (total time) | Noise dominated (detector-on time) | Marked lightcurve |
|---|---|---|---|---|---|---|---|
| A | 7086 | 6917 | 0 | 0 | 0.00% | 0.00% | 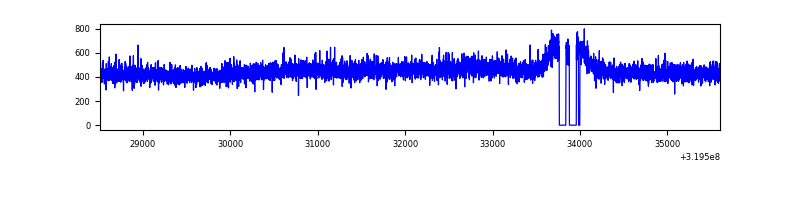 |
| B | 7087 | 6917 | 32 | 32 | 0.45% | 0.46% | 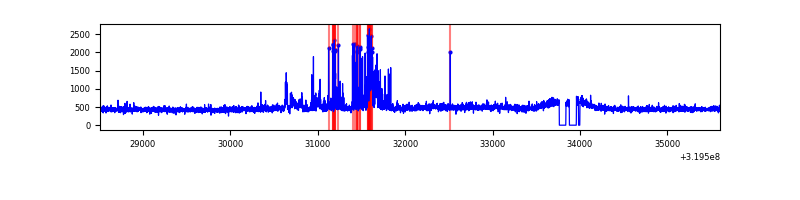 |
| C | 7087 | 6918 | 0 | 0 | 0.00% | 0.00% | 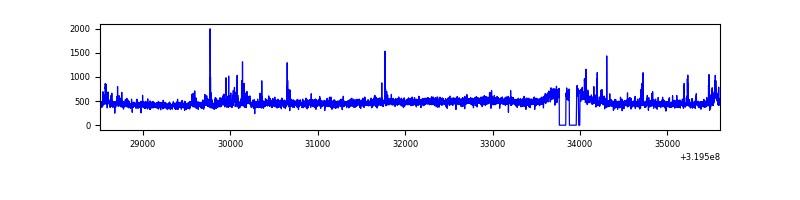 |
| D | 7087 | 6919 | 189 | 189 | 2.67% | 2.73% | 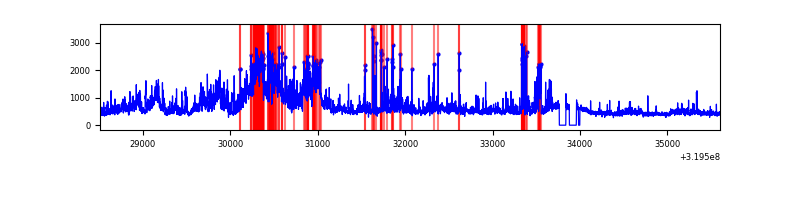 |
Top three noisy pixels from each quadrant. If the there are fewer than three noisy pixels in the level2.evt file, extra rows are filled as -1
| Pixel properties | Quadrant properties | ||||||
|---|---|---|---|---|---|---|---|
| Quadrant | DetID | PixID | Counts | Sigma | Mean | Median | Sigma |
| A | 13 | 254 | 11729 | 67.74 | 804 | 786 | 161.5 |
| A | 3 | 137 | 7332 | 40.52 | 804 | 786 | 161.5 |
| A | 0 | 226 | 6850 | 37.54 | 804 | 786 | 161.5 |
| B | 15 | 33 | 272931 | 1783.25 | 804 | 783 | 152.6 |
| B | 0 | 189 | 48345 | 311.65 | 804 | 783 | 152.6 |
| B | 12 | 111 | 18703 | 117.42 | 804 | 783 | 152.6 |
| C | 7 | 247 | 130199 | 718.38 | 775 | 779 | 180.2 |
| C | 14 | 238 | 123904 | 683.44 | 775 | 779 | 180.2 |
| C | 3 | 233 | 7950 | 39.8 | 775 | 779 | 180.2 |
| D | 7 | 238 | 1207913 | 6452.1 | 773 | 749 | 187.1 |
| D | 1 | 52 | 538320 | 2873.23 | 773 | 749 | 187.1 |
| D | 13 | 174 | 195082 | 1038.68 | 773 | 749 | 187.1 |
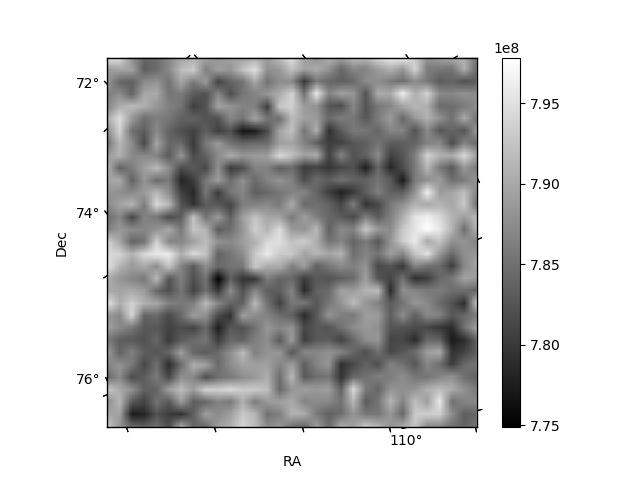
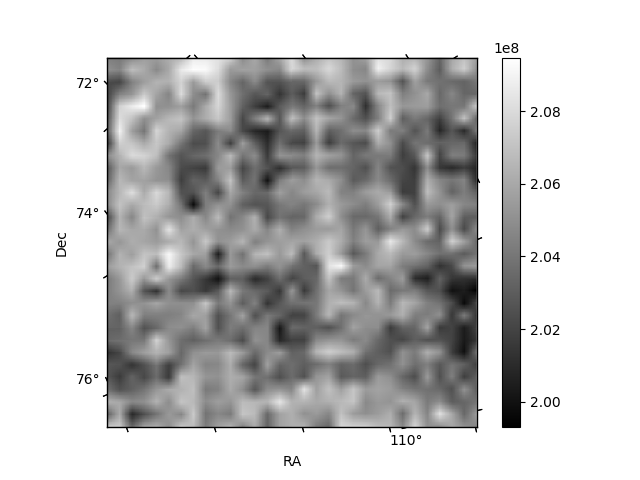
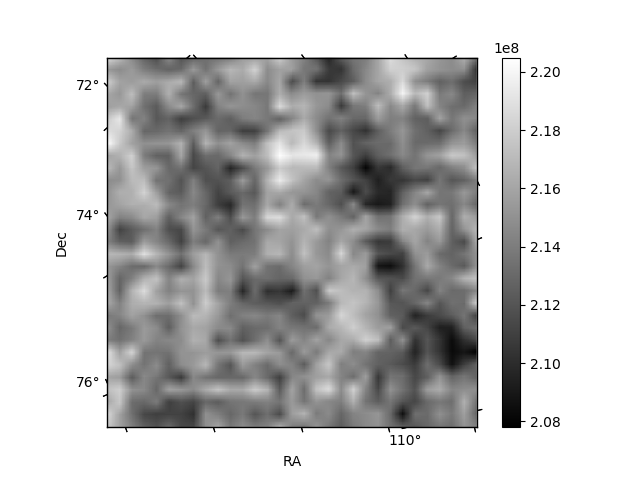
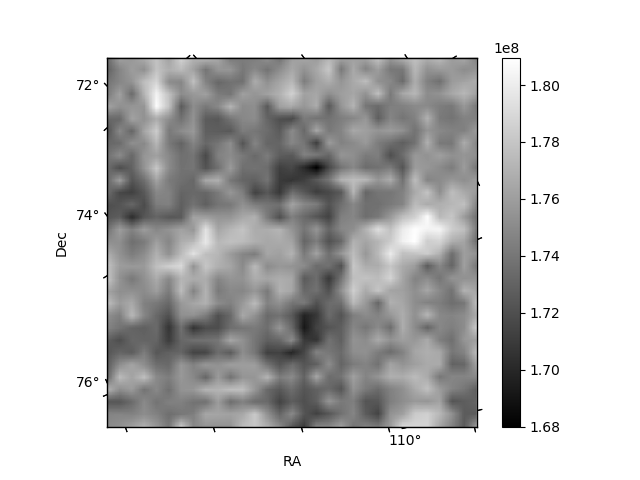
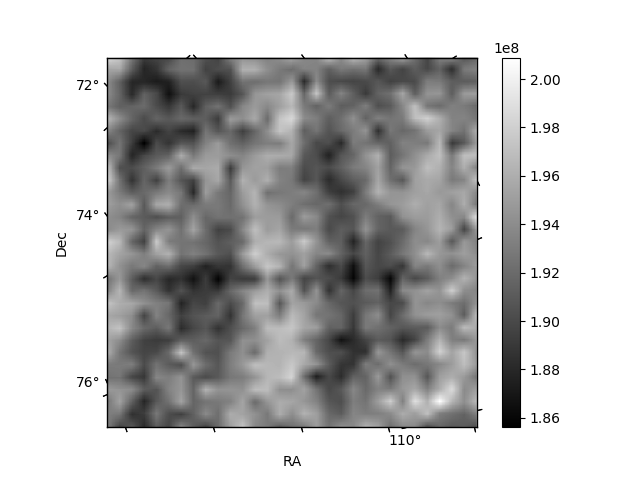
Histogram calculated using DETX and DETY for each event in the final _common_clean file
| Quadrant A | 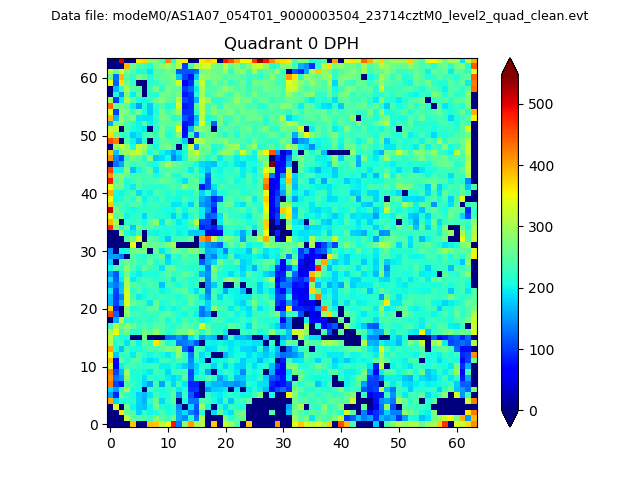 |
 |
Quadrant B |
|---|---|---|---|
| Quadrant D | 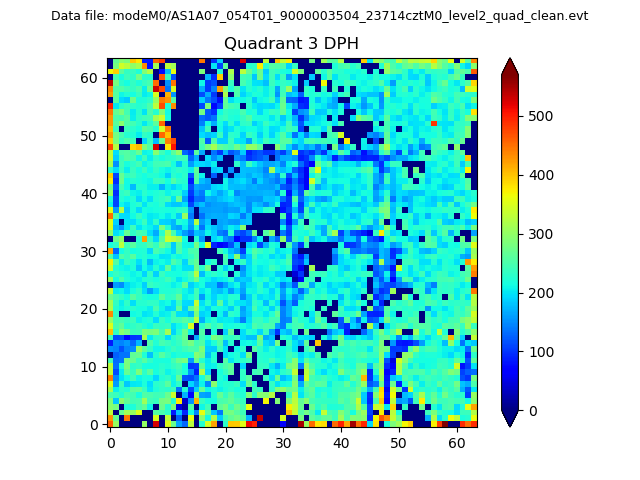 |
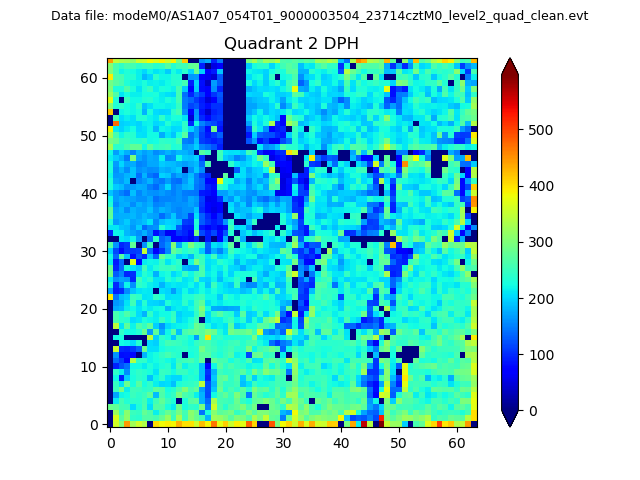 |
Quadrant C |
| Plot type | Count rate plots | Images |
|---|---|---|
| Comparison with Poisson distribution Blue bars denote a histogram of data divided into 1 sec bins. Red curve is a Poisson curve with rate = median count rate of data. |
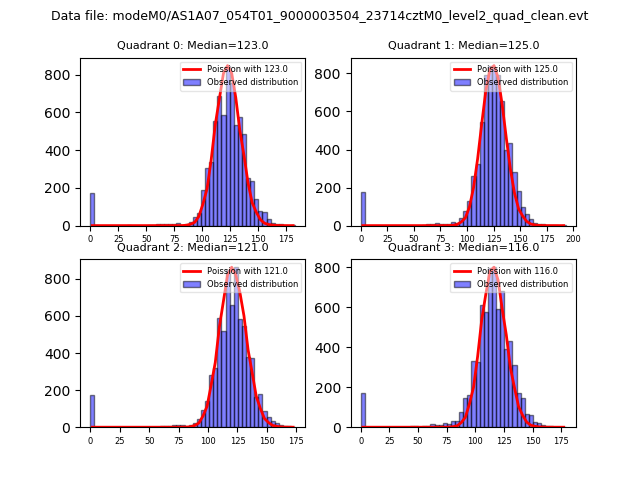 |
 |
| Quadrant-wise count rates Data is divided into 100 sec bins |
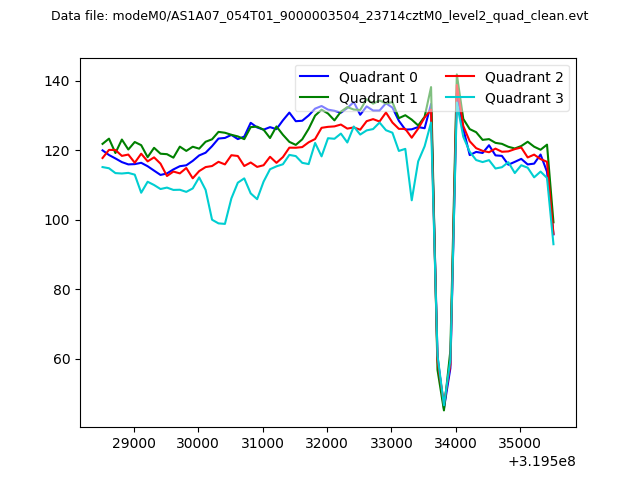 |
|
| Module-wise count rates for Quadrant A Data is divided into 100 sec bins |
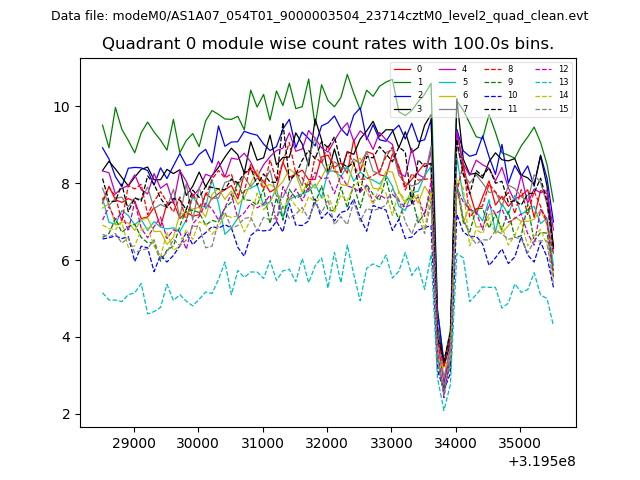 |
 |
| Module-wise count rates for Quadrant B Data is divided into 100 sec bins |
 |
 |
| Module-wise count rates for Quadrant C Data is divided into 100 sec bins |
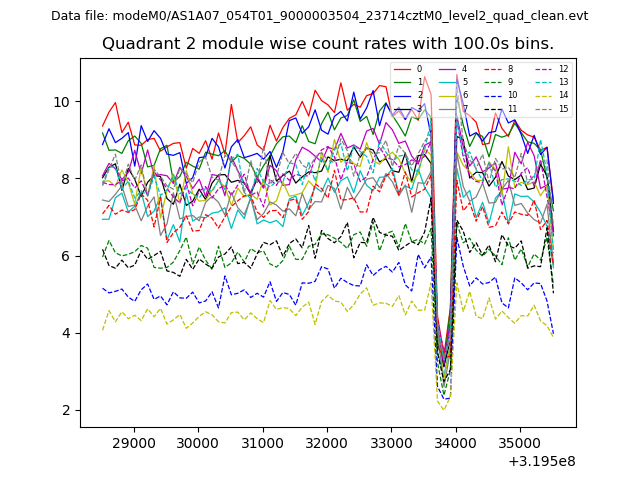 |
 |
| Module-wise count rates for Quadrant D Data is divided into 100 sec bins |
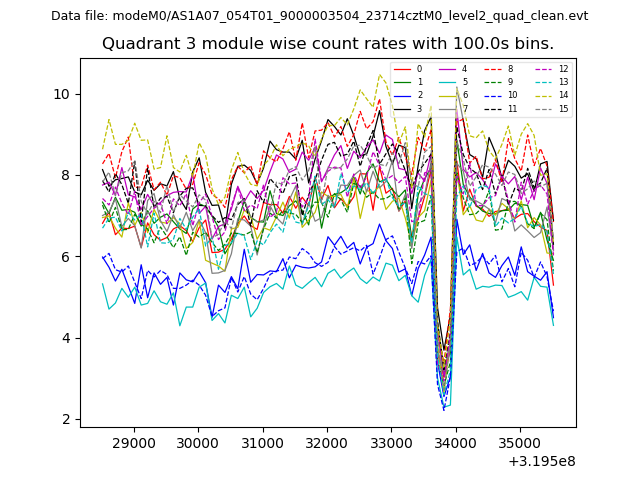 |
 |
| Parameter | Plot |
|---|---|
| CZT HV Monitor |  |
| D_VDD | 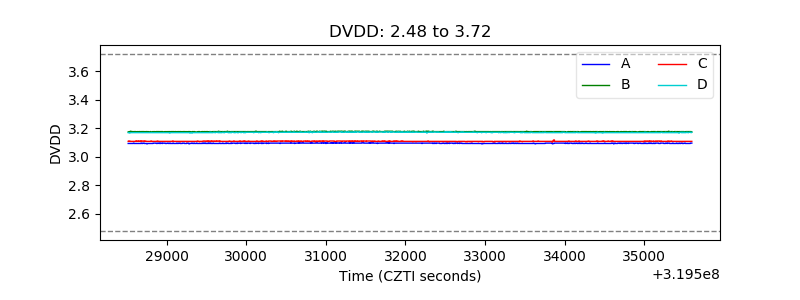 |
| Temperature 1 | 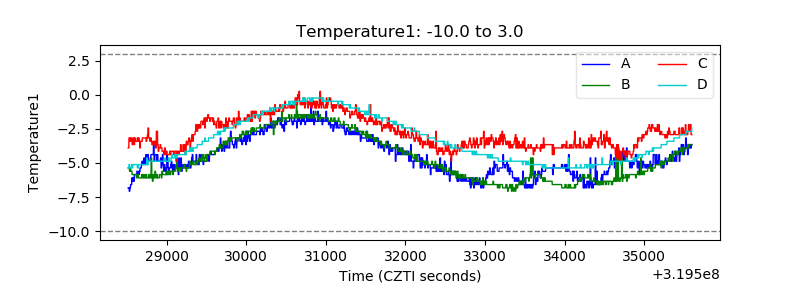 |
| Veto HV Monitor | 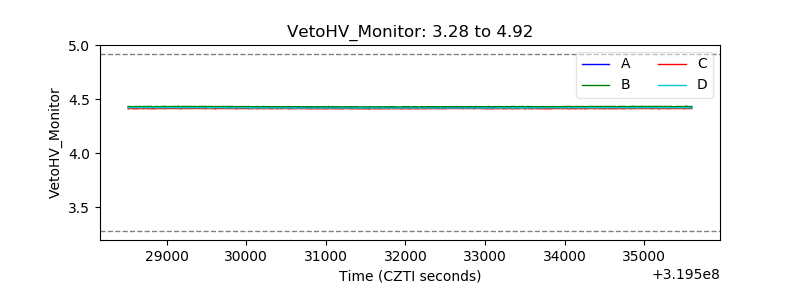 |
| Veto LLD | 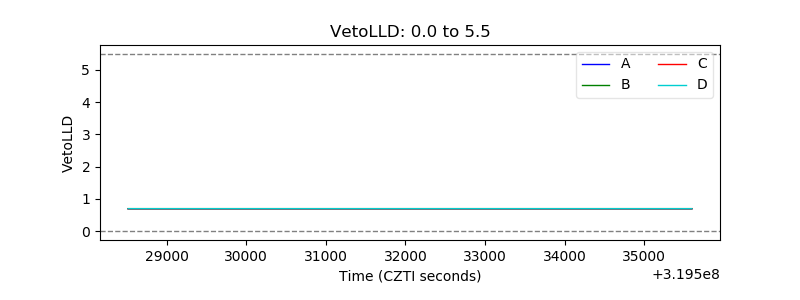 |
| Alpha Counter | 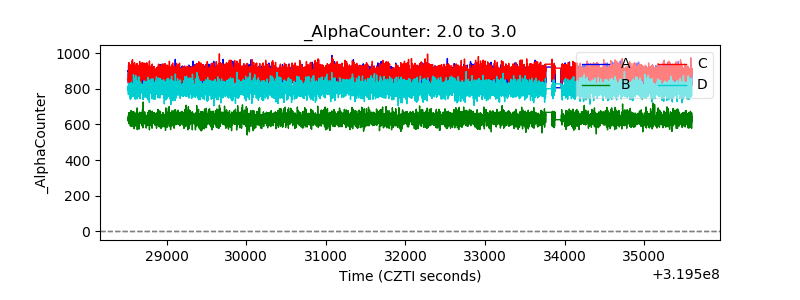 |
| _CPM_Rate | 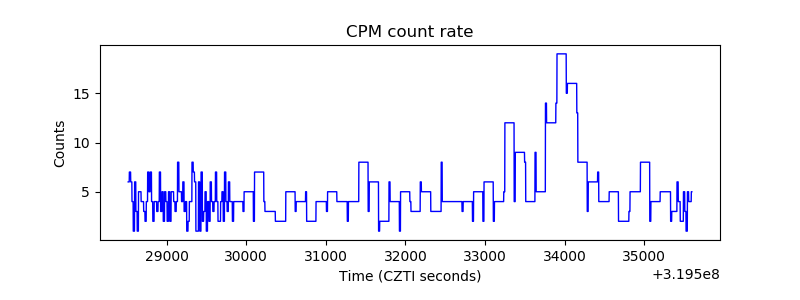 |
| CZT Counter |  |
| +2.5 Volts monitor |  |
| +5 Volts monitor |  |
| _ROLL_ROT | 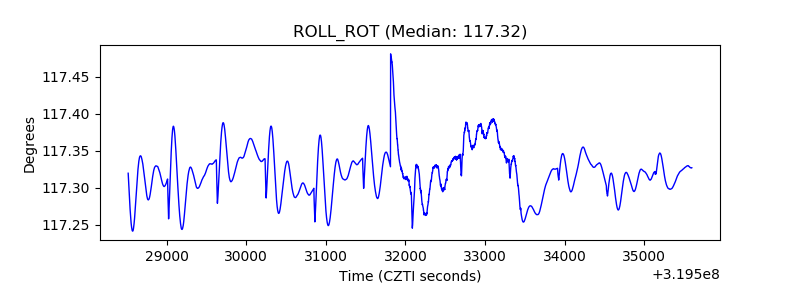 |
| _Roll_DEC | 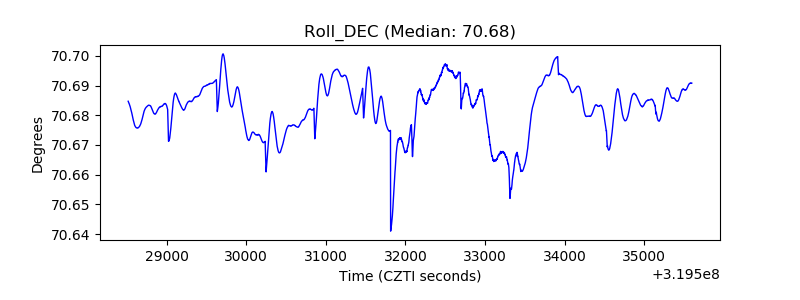 |
| _Roll_RA | 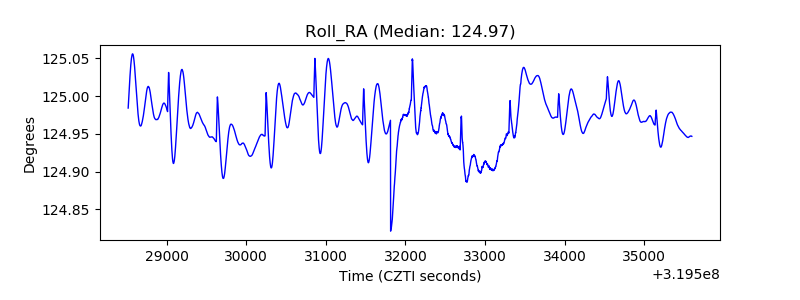 |
| Veto Counter | 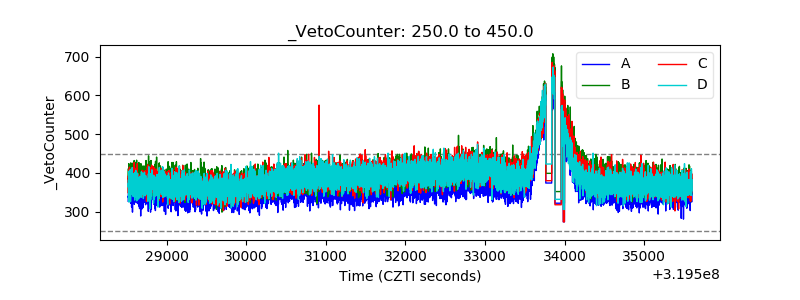 |