| Param | Original file | Final file |
|---|---|---|
| Filename | modeM0/AS1A07_054T01_9000003504_23715cztM0_level2.evt | modeM0/AS1A07_054T01_9000003504_23715cztM0_level2_quad_clean.evt |
| Size (bytes) | 246,389,760 | 64,877,760 |
| Size | 235.0 MB | 61.9 MB |
| Events in quadrant A | 1,573,219 | 438,114 |
| Events in quadrant B | 1,778,899 | 441,711 |
| Events in quadrant C | 1,721,745 | 420,609 |
| Events in quadrant D | 2,140,678 | 408,276 |
| Mode M0 | |||
|---|---|---|---|
| Quadrant | BADHDUFLAG | Total packets | Discarded packets |
| A | 0 | 7233 | 0 |
| B | 0 | 7739 | 0 |
| C | 0 | 7617 | 0 |
| D | 0 | 8855 | 0 |
| Mode SS | |||
|---|---|---|---|
| Quadrant | BADHDUFLAG | Total packets | Discarded packets |
| A | 0 | 72 | 0 |
| B | 0 | 72 | 0 |
| C | 0 | 72 | 0 |
| D | 0 | 72 | 0 |
| Quadrant | Total seconds | Saturated seconds | Saturation percentage |
|---|---|---|---|
| A | 3614 | 2 | 0.055340% |
| B | 3614 | 22 | 0.608744% |
| C | 3614 | 43 | 1.189817% |
| D | 3615 | 68 | 1.881051% |
Noise dominated data is calculated using 1-second bins in cleaned event files. If a bin has >2000 counts, and if more than 50% of those come from <1% of pixels, then it is considered to be noise-dominated and hence unusable.
| Quadrant | # 1 sec bins | Bins with >0 counts | Bins with >2000 counts | High rate bins dominated by noise | Noise dominated (total time) | Noise dominated (detector-on time) | Marked lightcurve |
|---|---|---|---|---|---|---|---|
| A | 3614 | 3614 | 0 | 0 | 0.00% | 0.00% |  |
| B | 3614 | 3614 | 14 | 14 | 0.39% | 0.39% |  |
| C | 3614 | 3614 | 23 | 23 | 0.64% | 0.64% |  |
| D | 3615 | 3615 | 57 | 57 | 1.58% | 1.58% |  |
Top three noisy pixels from each quadrant. If the there are fewer than three noisy pixels in the level2.evt file, extra rows are filled as -1
| Pixel properties | Quadrant properties | ||||||
|---|---|---|---|---|---|---|---|
| Quadrant | DetID | PixID | Counts | Sigma | Mean | Median | Sigma |
| A | 13 | 254 | 6103 | 68.88 | 407 | 398 | 82.8 |
| A | 3 | 137 | 3646 | 39.21 | 407 | 398 | 82.8 |
| A | 0 | 226 | 3491 | 37.34 | 407 | 398 | 82.8 |
| B | 15 | 33 | 121673 | 1553.59 | 402 | 392 | 78.1 |
| B | 0 | 229 | 42363 | 537.64 | 402 | 392 | 78.1 |
| B | 0 | 189 | 32698 | 413.84 | 402 | 392 | 78.1 |
| C | 7 | 247 | 152826 | 1676.93 | 386 | 388 | 90.9 |
| C | 14 | 238 | 61739 | 674.91 | 386 | 388 | 90.9 |
| C | 10 | 91 | 3386 | 32.98 | 386 | 388 | 90.9 |
| D | 1 | 52 | 568545 | 5945.5 | 392 | 379 | 95.6 |
| D | 7 | 238 | 49006 | 508.85 | 392 | 379 | 95.6 |
| D | 12 | 233 | 23648 | 243.5 | 392 | 379 | 95.6 |
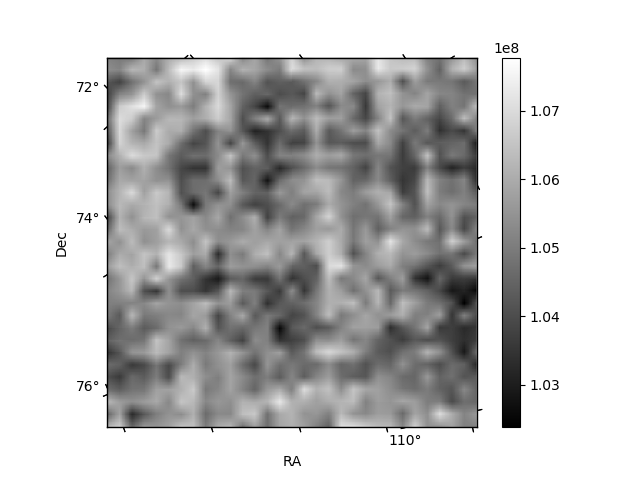
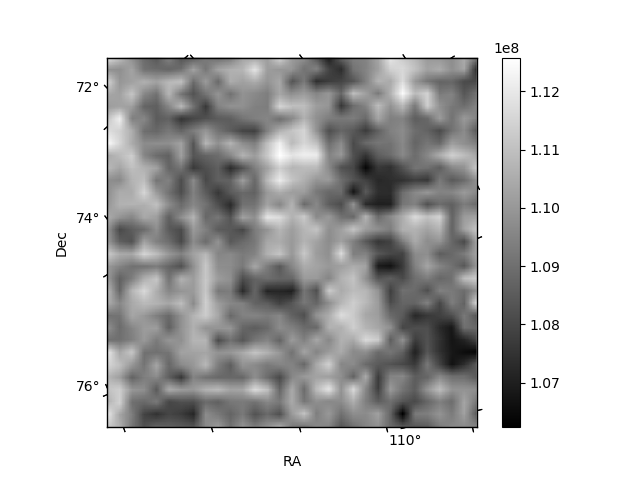
Histogram calculated using DETX and DETY for each event in the final _common_clean file
| Quadrant A | 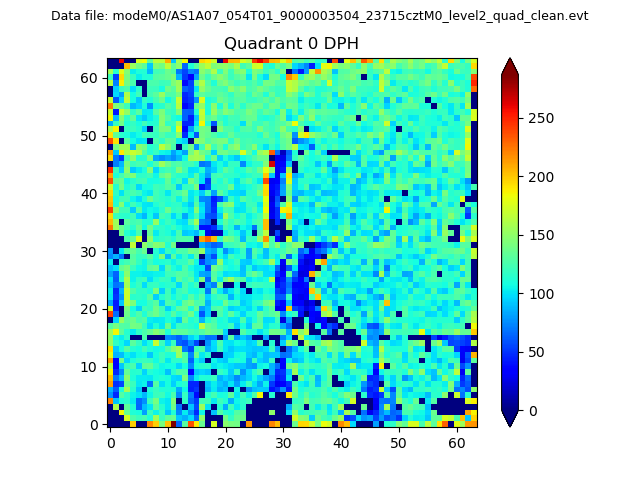 |
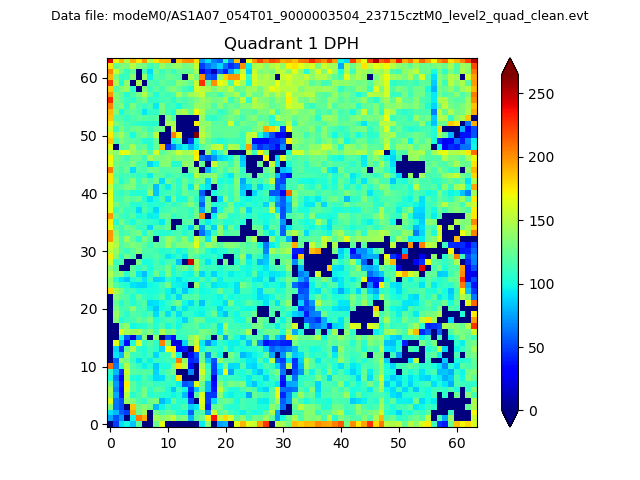 |
Quadrant B |
|---|---|---|---|
| Quadrant D | 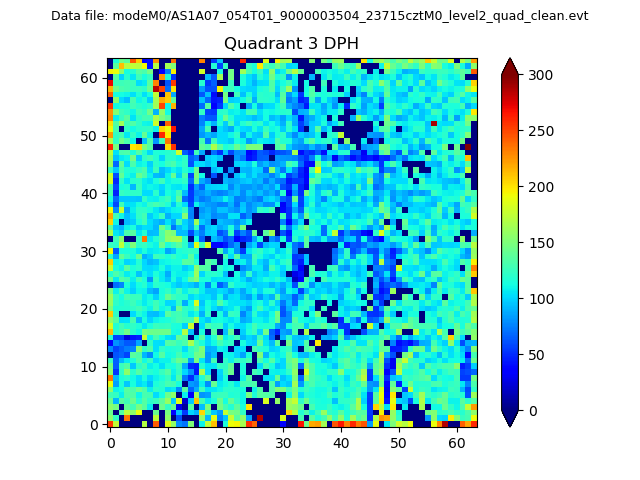 |
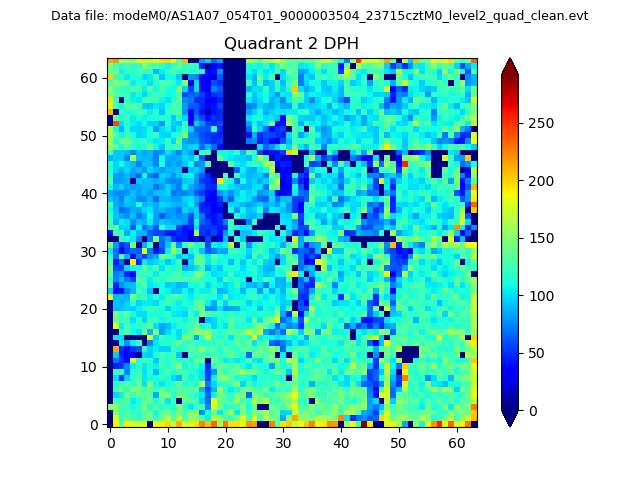 |
Quadrant C |
| Plot type | Count rate plots | Images |
|---|---|---|
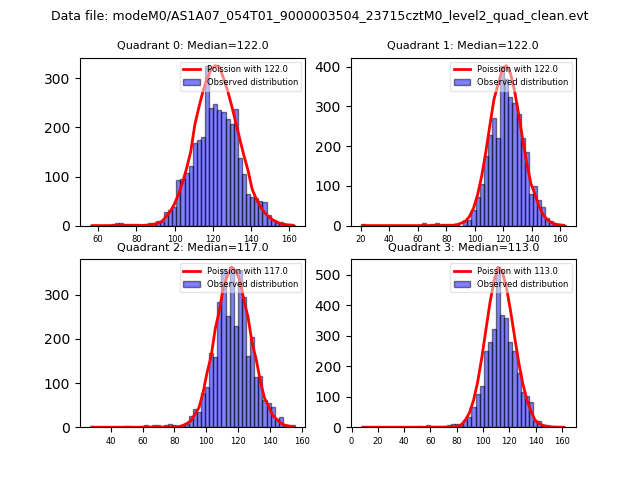
| Comparison with Poisson distribution Blue bars denote a histogram of data divided into 1 sec bins. Red curve is a Poisson curve with rate = median count rate of data. |
 |
 |
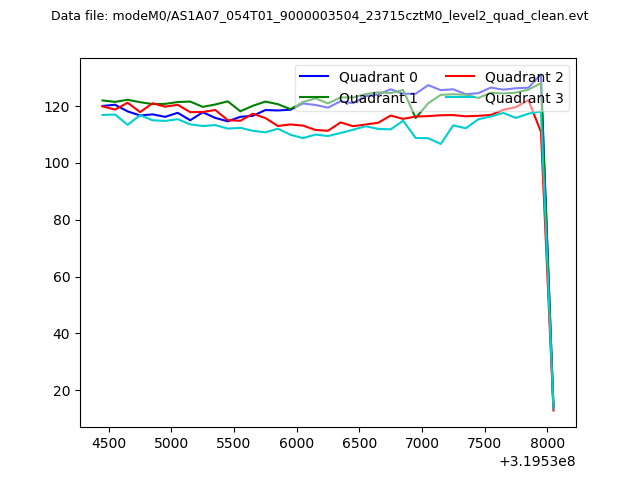
| Quadrant-wise count rates Data is divided into 100 sec bins |
 |
|
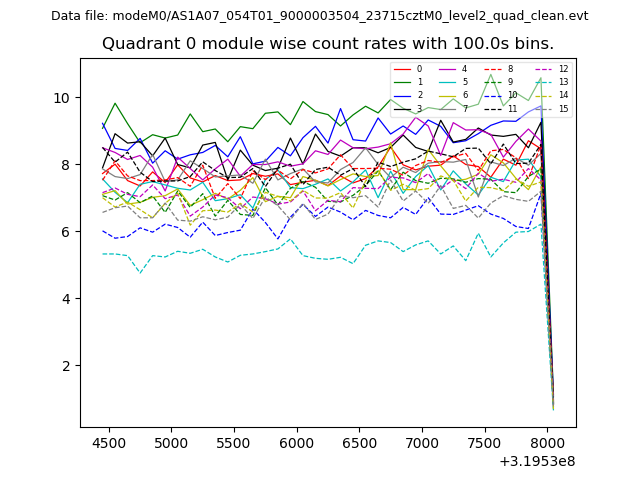
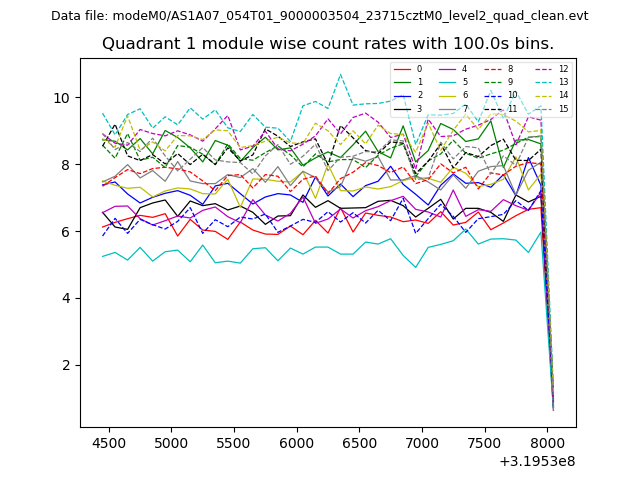
| Module-wise count rates for Quadrant A Data is divided into 100 sec bins |
 |
 |
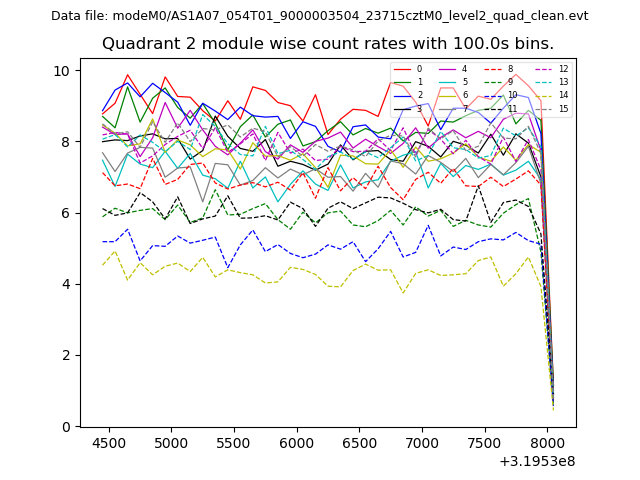
| Module-wise count rates for Quadrant B Data is divided into 100 sec bins |
 |
 |
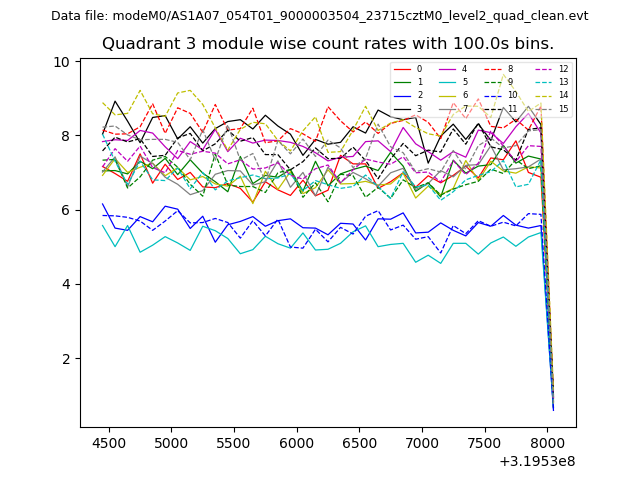
| Module-wise count rates for Quadrant C Data is divided into 100 sec bins |
 |
 |
| Module-wise count rates for Quadrant D Data is divided into 100 sec bins |
 |
 |
| Parameter | Plot |
|---|---|
| CZT HV Monitor | 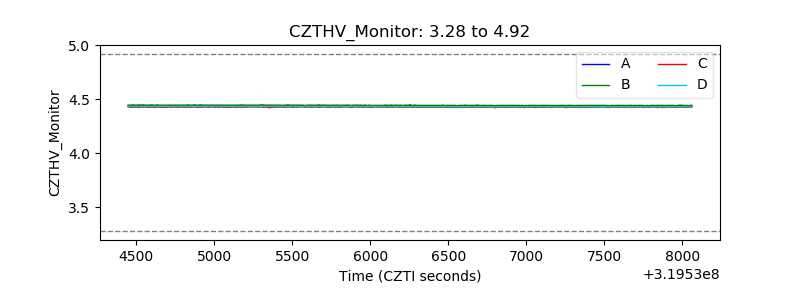 |
| D_VDD | 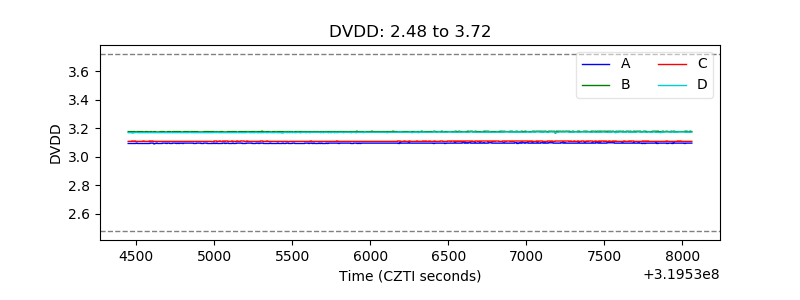 |
| Temperature 1 | 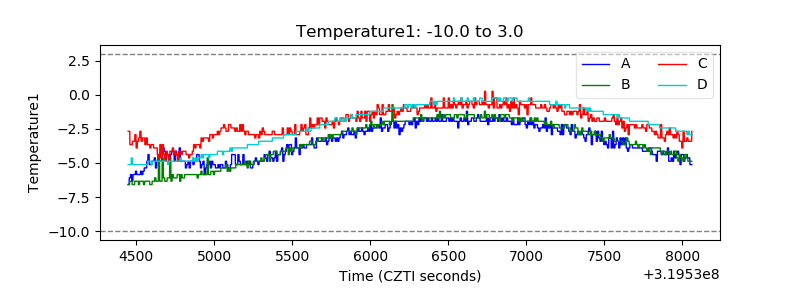 |
| Veto HV Monitor | 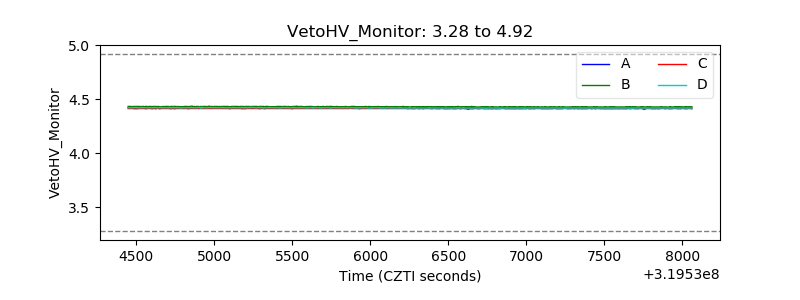 |
| Veto LLD | 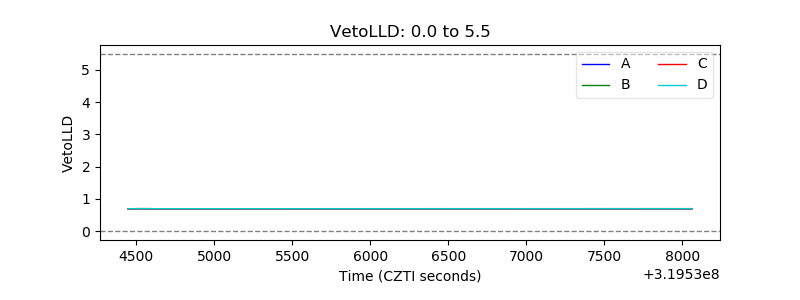 |
| Alpha Counter | 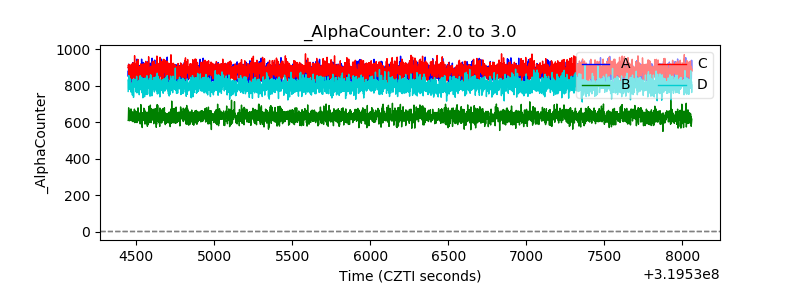 |
| _CPM_Rate | 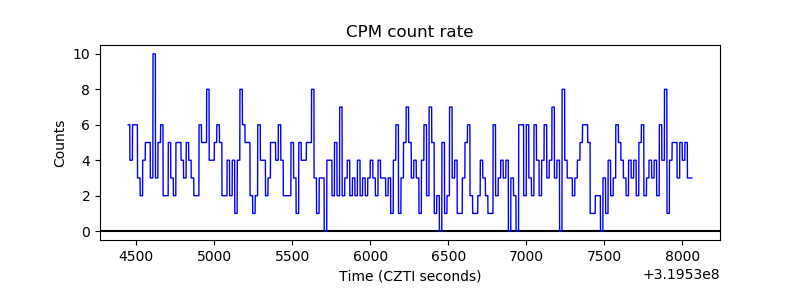 |
| CZT Counter | 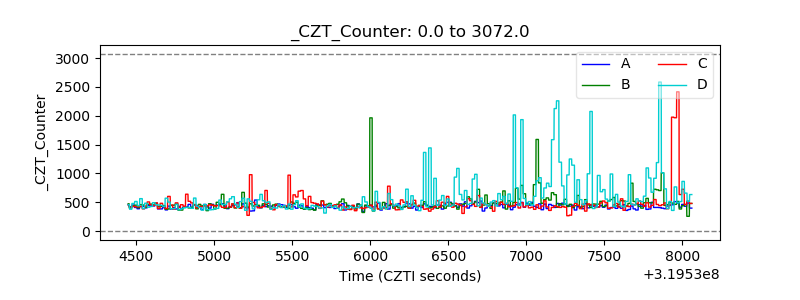 |
| +2.5 Volts monitor | 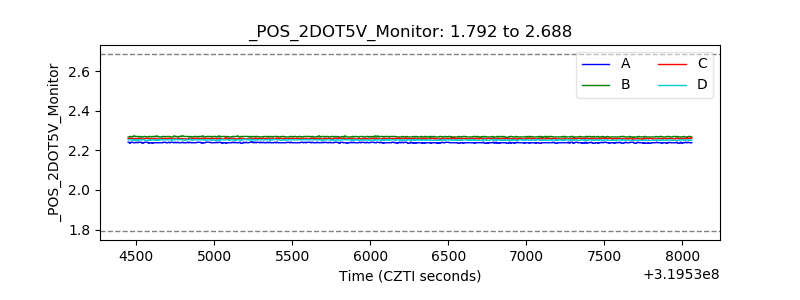 |
| +5 Volts monitor |  |
| _ROLL_ROT | 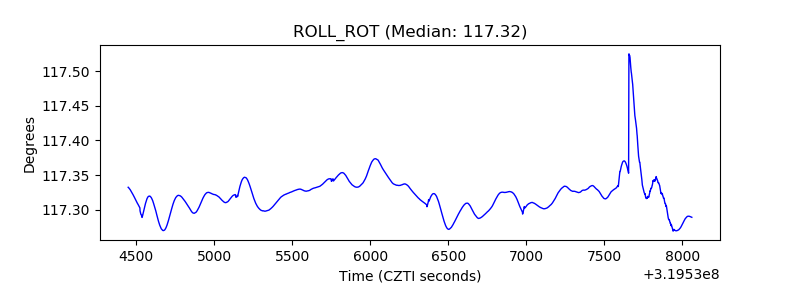 |
| _Roll_DEC | 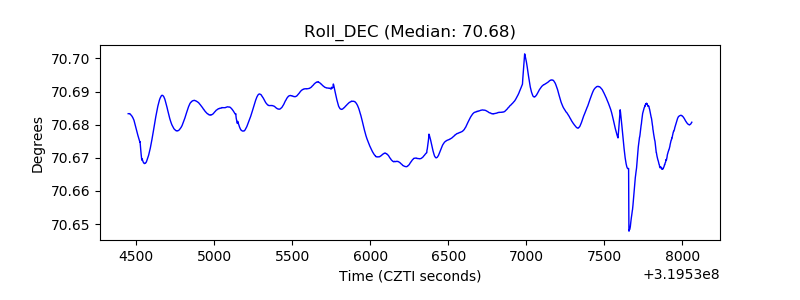 |
| _Roll_RA | 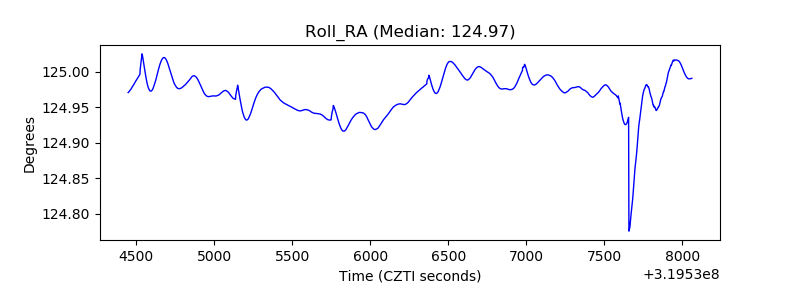 |
| Veto Counter | 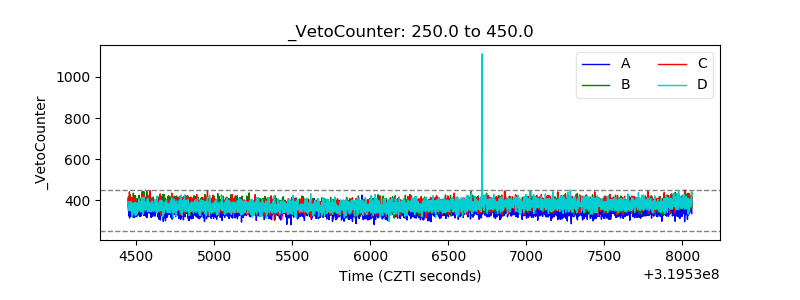 |