| Param | Original file | Final file |
|---|---|---|
| Filename | modeM0/AS1C05_013T02_9000003502cztM0_level2.fits | modeM0/AS1C05_013T02_9000003502cztM0_level2_quad_clean.evt |
| Size (bytes) | 60,272,640 | 58,685,760 |
| Size | 57.5 MB | 56.0 MB |
| Events in quadrant A | 363,114 | 351,342 |
| Events in quadrant B | 350,092 | 349,925 |
| Events in quadrant C | 356,036 | 329,855 |
| Events in quadrant D | 306,882 | 296,201 |
| Mode M9 | |||
|---|---|---|---|
| Quadrant | BADHDUFLAG | Total packets | Discarded packets |
| A | 0 | 6 | 0 |
| B | 0 | 6 | 0 |
| C | 0 | 6 | 0 |
| D | 0 | 6 | 0 |
| Mode M0 | |||
|---|---|---|---|
| Quadrant | BADHDUFLAG | Total packets | Discarded packets |
| A | 0 | 13327 | 0 |
| B | 0 | 13863 | 0 |
| C | 0 | 13501 | 0 |
| D | 0 | 16845 | 0 |
| Mode SS | |||
|---|---|---|---|
| Quadrant | BADHDUFLAG | Total packets | Discarded packets |
| A | 0 | 132 | 0 |
| B | 0 | 132 | 0 |
| C | 0 | 132 | 0 |
| D | 0 | 132 | 0 |
| Quadrant | Total seconds | Saturated seconds | Saturation percentage |
|---|---|---|---|
| A | 6440 | 176 | 2.732919% |
| B | 6442 | 195 | 3.027010% |
| C | 6443 | 125 | 1.940090% |
| D | 6440 | 279 | 4.332298% |
Noise dominated data is calculated using 1-second bins in cleaned event files. If a bin has >2000 counts, and if more than 50% of those come from <1% of pixels, then it is considered to be noise-dominated and hence unusable.
| Quadrant | # 1 sec bins | Bins with >0 counts | Bins with >2000 counts | High rate bins dominated by noise | Noise dominated (total time) | Noise dominated (detector-on time) | Marked lightcurve |
|---|---|---|---|---|---|---|---|
| A | 7013 | 6441 | 0 | 0 | 0.00% | 0.00% | 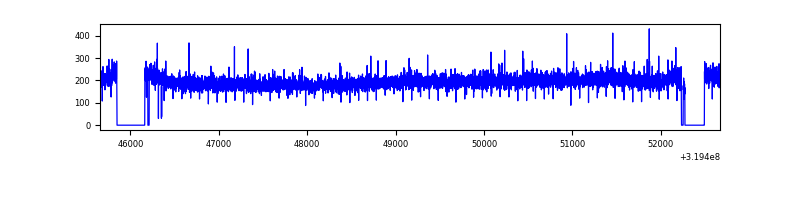 |
| B | 7013 | 6440 | 0 | 0 | 0.00% | 0.00% |  |
| C | 7013 | 6442 | 0 | 0 | 0.00% | 0.00% | 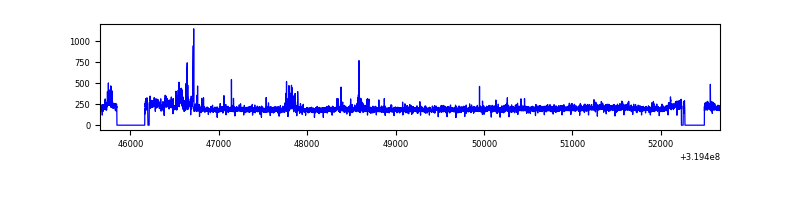 |
| D | 7013 | 6439 | 0 | 0 | 0.00% | 0.00% | 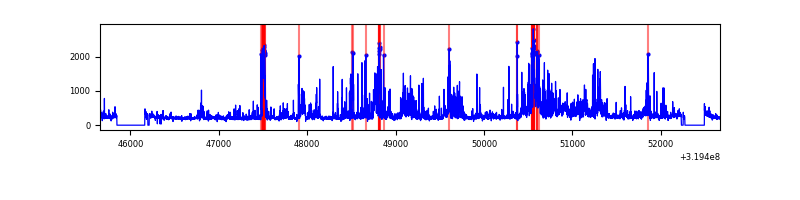 |
Top three noisy pixels from each quadrant. If the there are fewer than three noisy pixels in the level2.evt file, extra rows are filled as -1
| Pixel properties | Quadrant properties | ||||||
|---|---|---|---|---|---|---|---|
| Quadrant | DetID | PixID | Counts | Sigma | Mean | Median | Sigma |
| A | 0 | 29 | 377 | 11.41 | 94 | 89 | 25.2 |
| A | 0 | 30 | 286 | 7.81 | 94 | 89 | 25.2 |
| A | 14 | 79 | 277 | 7.45 | 94 | 89 | 25.2 |
| B | 2 | 9 | 298 | 10.09 | 92 | 88 | 20.8 |
| B | 2 | 8 | 252 | 7.88 | 92 | 88 | 20.8 |
| B | 5 | 128 | 247 | 7.64 | 92 | 88 | 20.8 |
| C | 1 | 80 | 274 | 7.24 | 94 | 88 | 25.7 |
| C | 1 | 81 | 267 | 6.97 | 94 | 88 | 25.7 |
| C | 12 | 241 | 265 | 6.89 | 94 | 88 | 25.7 |
| D | 3 | 31 | 247 | 6.75 | 87 | 78 | 25.1 |
| D | 7 | 3 | 239 | 6.43 | 87 | 78 | 25.1 |
| D | 15 | 46 | 232 | 6.15 | 87 | 78 | 25.1 |
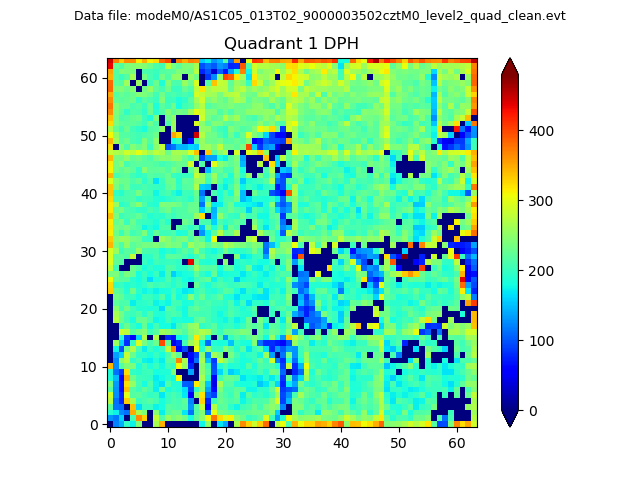
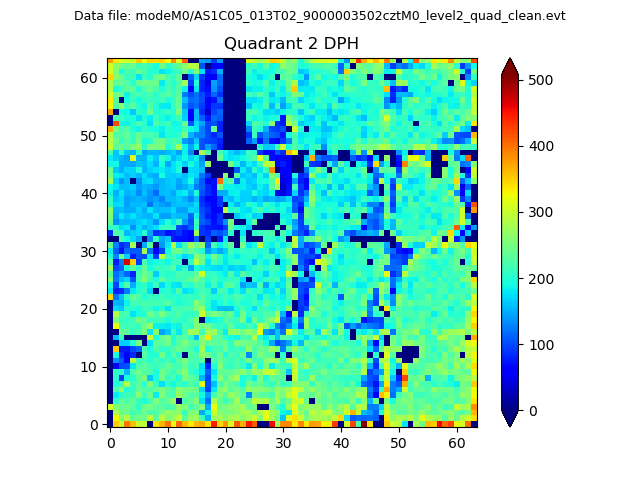
Histogram calculated using DETX and DETY for each event in the final _common_clean file
| Quadrant A | 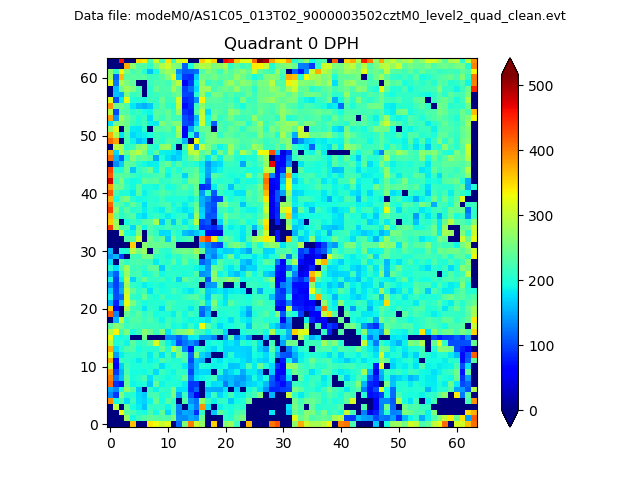 |
 |
Quadrant B |
|---|---|---|---|
| Quadrant D |  |
 |
Quadrant C |
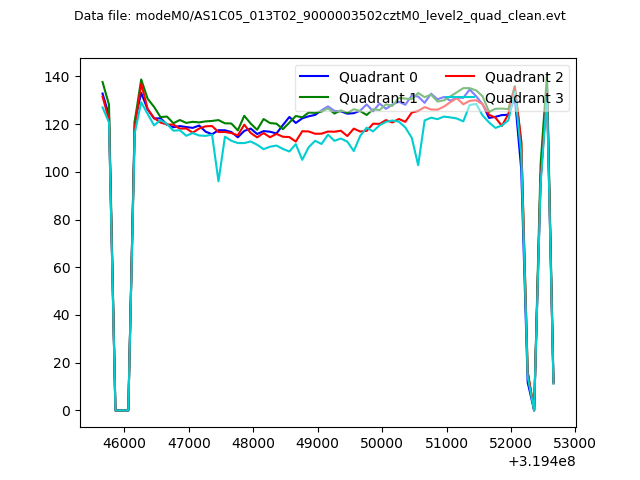
| Plot type | Count rate plots | Images |
|---|---|---|
| Comparison with Poisson distribution Blue bars denote a histogram of data divided into 1 sec bins. Red curve is a Poisson curve with rate = median count rate of data. |
 |
 |
| Quadrant-wise count rates Data is divided into 100 sec bins |
 |
|
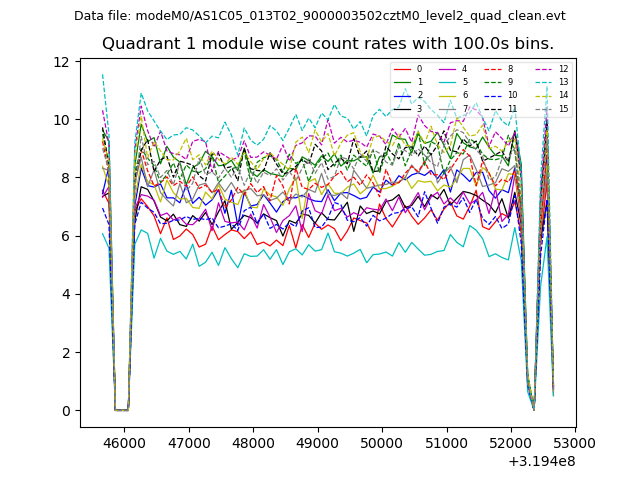
| Module-wise count rates for Quadrant A Data is divided into 100 sec bins |
 |
 |
| Module-wise count rates for Quadrant B Data is divided into 100 sec bins |
 |
 |
| Module-wise count rates for Quadrant C Data is divided into 100 sec bins |
 |
 |
| Module-wise count rates for Quadrant D Data is divided into 100 sec bins |
 |
 |
| Parameter | Plot |
|---|---|
| CZT HV Monitor |  |
| D_VDD | 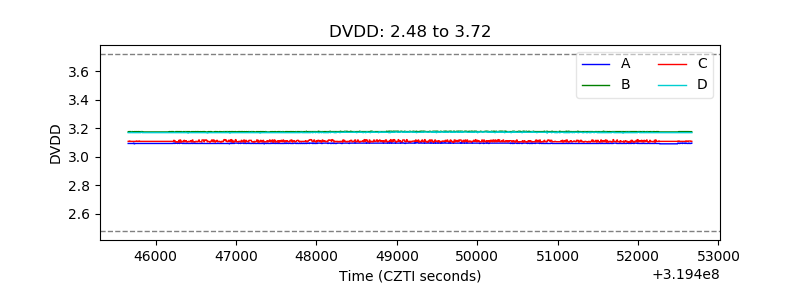 |
| Temperature 1 | 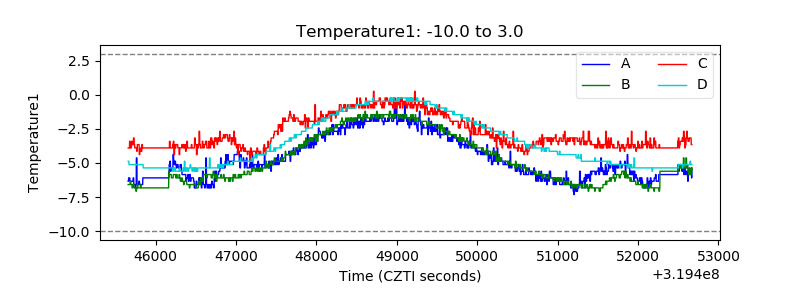 |
| Veto HV Monitor | 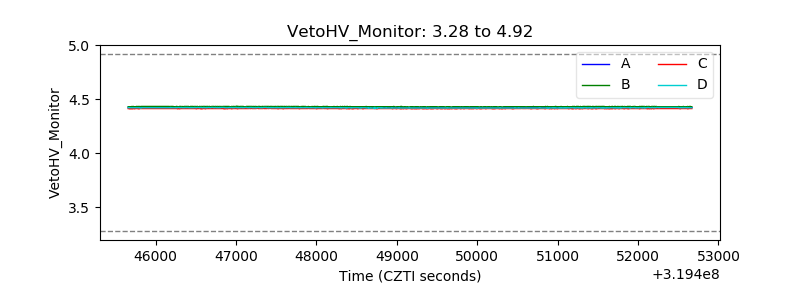 |
| Veto LLD | 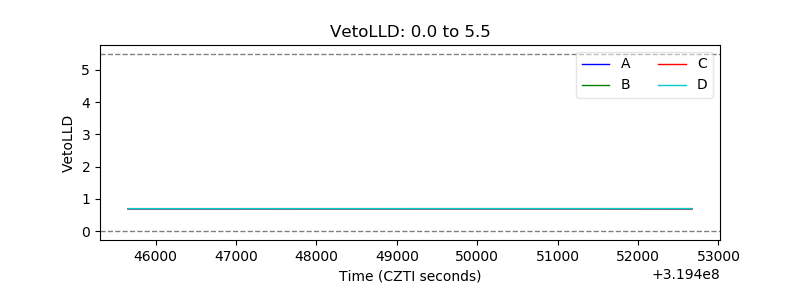 |
| Alpha Counter | 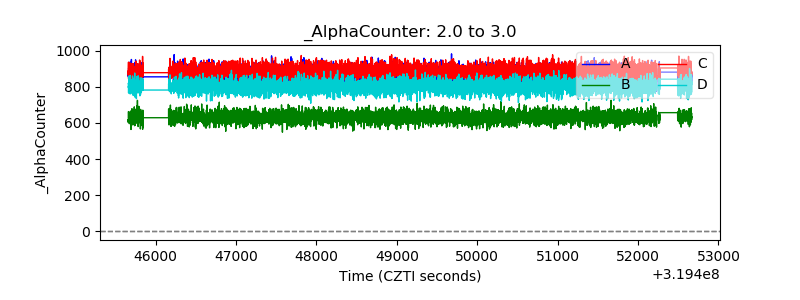 |
| _CPM_Rate |  |
| CZT Counter |  |
| +2.5 Volts monitor |  |
| +5 Volts monitor |  |
| _ROLL_ROT | 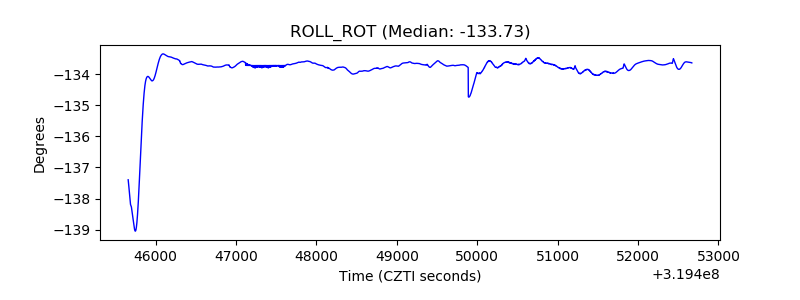 |
| _Roll_DEC | 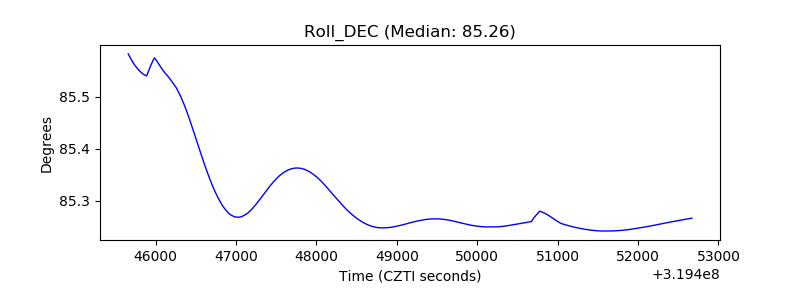 |
| _Roll_RA | 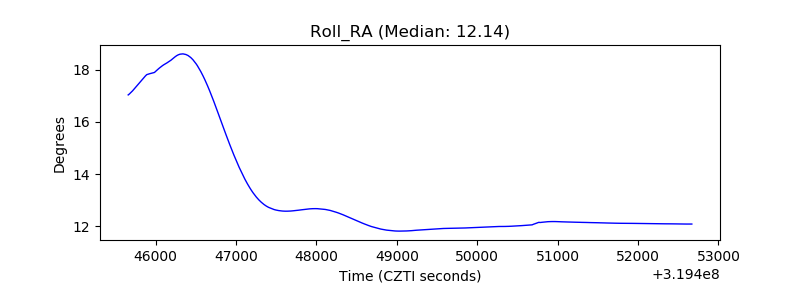 |
| Veto Counter | 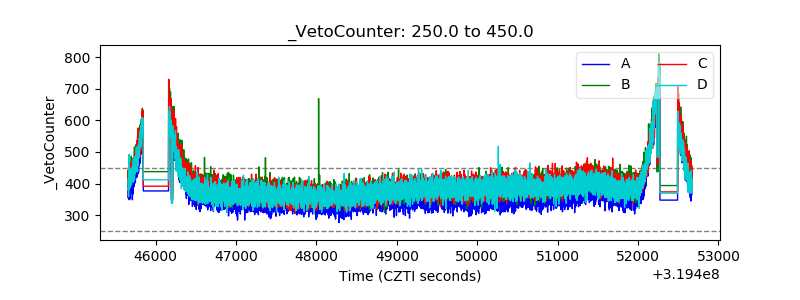 |