| Param | Original file | Final file |
|---|---|---|
| Filename | modeM0/AS1C05_013T02_9000003502_23700cztM0_level2.evt | modeM0/AS1C05_013T02_9000003502_23700cztM0_level2_quad_clean.evt |
| Size (bytes) | 429,825,600 | 112,262,400 |
| Size | 409.9 MB | 107.1 MB |
| Events in quadrant A | 2,745,773 | 756,400 |
| Events in quadrant B | 3,031,268 | 769,780 |
| Events in quadrant C | 2,863,567 | 738,596 |
| Events in quadrant D | 3,963,275 | 710,601 |
| Mode M9 | |||
|---|---|---|---|
| Quadrant | BADHDUFLAG | Total packets | Discarded packets |
| A | 0 | 3 | 0 |
| B | 0 | 3 | 0 |
| C | 0 | 3 | 0 |
| D | 0 | 3 | 0 |
| Mode M0 | |||
|---|---|---|---|
| Quadrant | BADHDUFLAG | Total packets | Discarded packets |
| A | 0 | 12422 | 1 |
| B | 0 | 12923 | 1 |
| C | 0 | 12534 | 1 |
| D | 0 | 15934 | 1 |
| Mode SS | |||
|---|---|---|---|
| Quadrant | BADHDUFLAG | Total packets | Discarded packets |
| A | 0 | 122 | 0 |
| B | 0 | 122 | 0 |
| C | 0 | 122 | 0 |
| D | 0 | 122 | 0 |
| Quadrant | Total seconds | Saturated seconds | Saturation percentage |
|---|---|---|---|
| A | 6083 | 124 | 2.038468% |
| B | 6084 | 137 | 2.251808% |
| C | 6084 | 88 | 1.446417% |
| D | 6084 | 257 | 4.224195% |
Noise dominated data is calculated using 1-second bins in cleaned event files. If a bin has >2000 counts, and if more than 50% of those come from <1% of pixels, then it is considered to be noise-dominated and hence unusable.
| Quadrant | # 1 sec bins | Bins with >0 counts | Bins with >2000 counts | High rate bins dominated by noise | Noise dominated (total time) | Noise dominated (detector-on time) | Marked lightcurve |
|---|---|---|---|---|---|---|---|
| A | 6323 | 6083 | 0 | 0 | 0.00% | 0.00% | 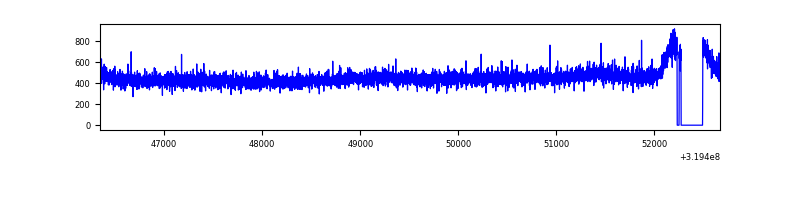 |
| B | 6324 | 6084 | 11 | 11 | 0.17% | 0.18% | 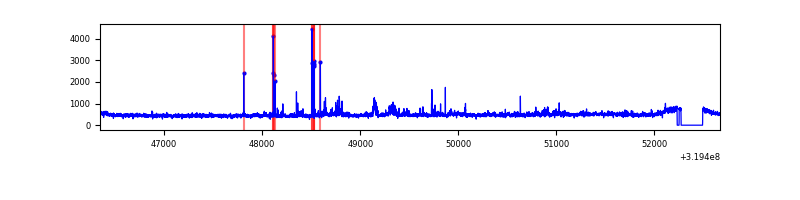 |
| C | 6324 | 6085 | 0 | 0 | 0.00% | 0.00% | 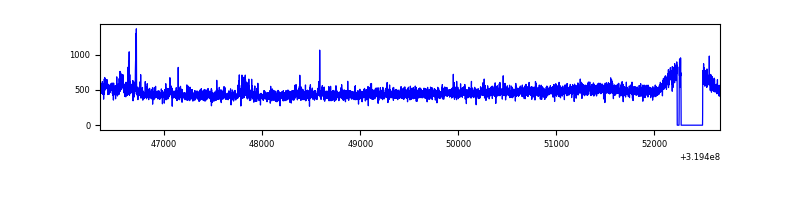 |
| D | 6324 | 6084 | 171 | 171 | 2.70% | 2.81% | 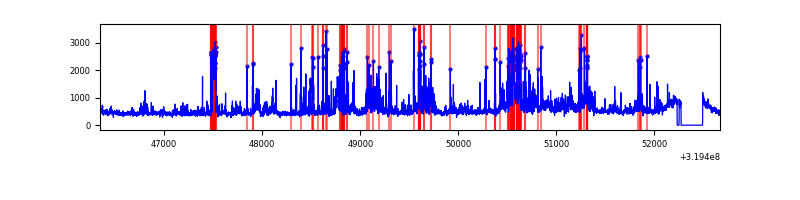 |
Top three noisy pixels from each quadrant. If the there are fewer than three noisy pixels in the level2.evt file, extra rows are filled as -1
| Pixel properties | Quadrant properties | ||||||
|---|---|---|---|---|---|---|---|
| Quadrant | DetID | PixID | Counts | Sigma | Mean | Median | Sigma |
| A | 13 | 254 | 10081 | 65.04 | 711 | 694 | 144.3 |
| A | 3 | 137 | 6371 | 39.34 | 711 | 694 | 144.3 |
| A | 0 | 226 | 6013 | 36.86 | 711 | 694 | 144.3 |
| B | 0 | 229 | 109920 | 805.38 | 708 | 689 | 135.6 |
| B | 15 | 33 | 30892 | 222.69 | 708 | 689 | 135.6 |
| B | 0 | 228 | 22594 | 161.51 | 708 | 689 | 135.6 |
| C | 14 | 238 | 108484 | 674.41 | 685 | 687 | 159.8 |
| C | 7 | 247 | 57261 | 353.94 | 685 | 687 | 159.8 |
| C | 8 | 128 | 11686 | 68.81 | 685 | 687 | 159.8 |
| D | 1 | 52 | 985052 | 5918.04 | 685 | 662 | 166.3 |
| D | 13 | 174 | 223639 | 1340.51 | 685 | 662 | 166.3 |
| D | 7 | 38 | 124355 | 743.63 | 685 | 662 | 166.3 |
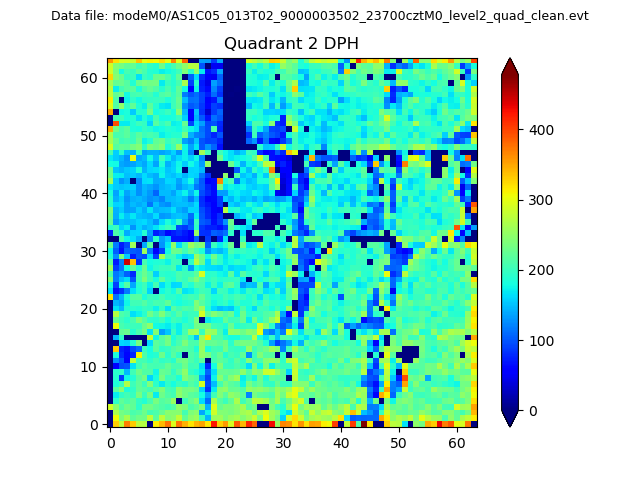
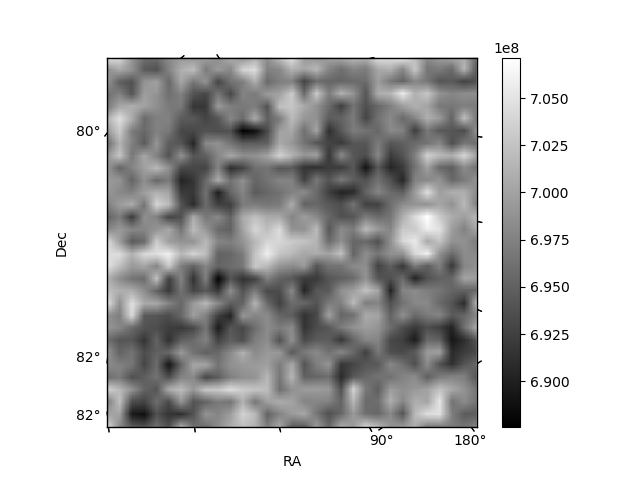
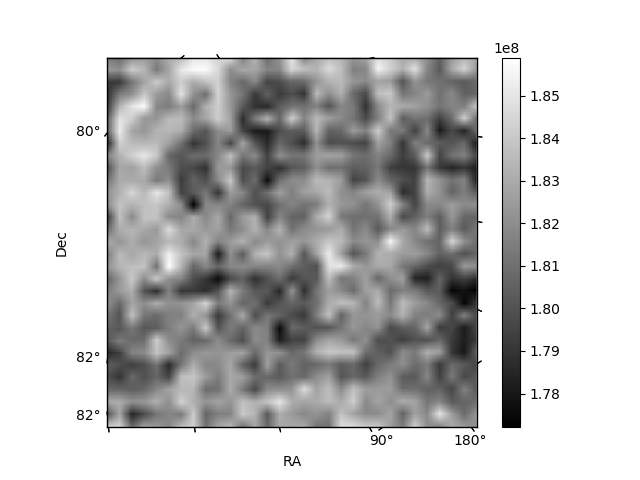
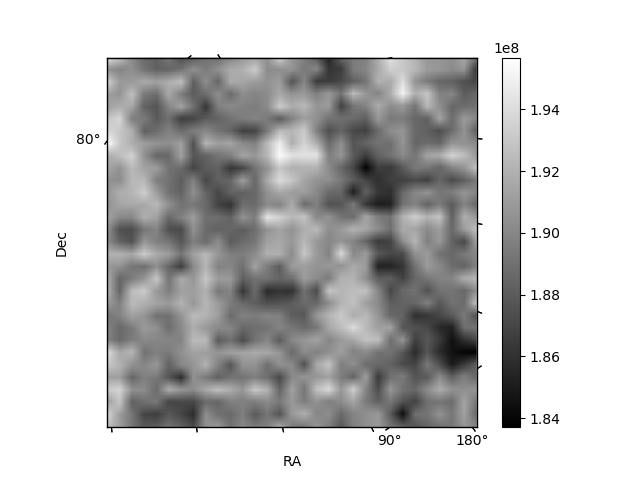
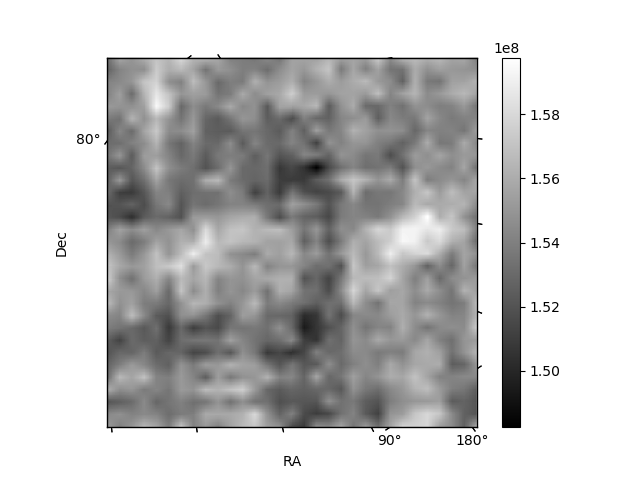
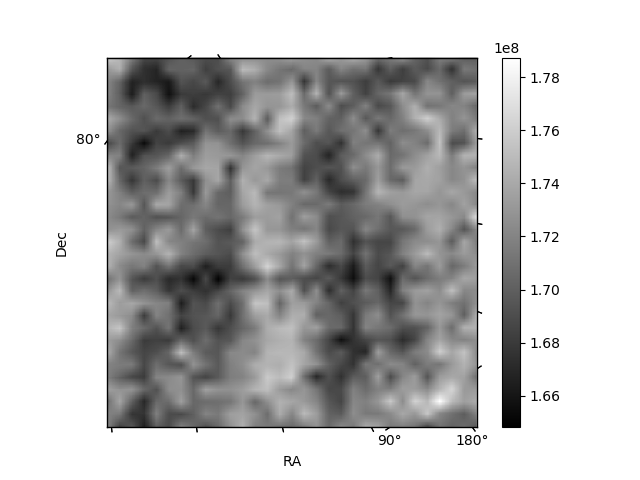
Histogram calculated using DETX and DETY for each event in the final _common_clean file
| Quadrant A | 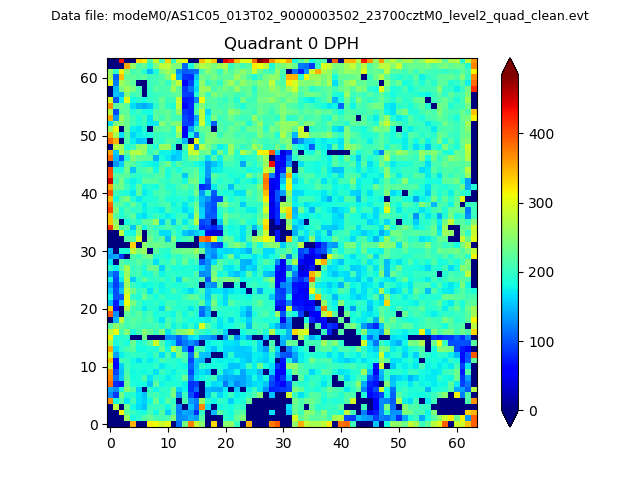 |
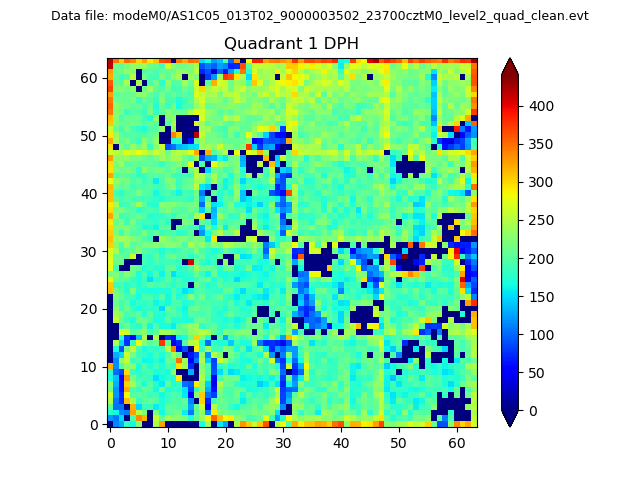 |
Quadrant B |
|---|---|---|---|
| Quadrant D | 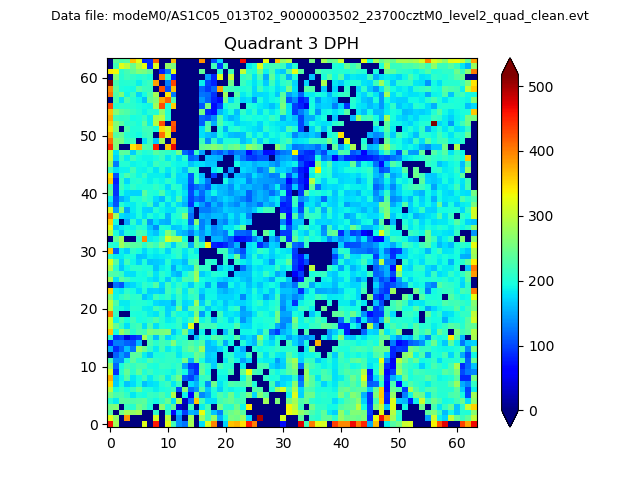 |
 |
Quadrant C |
| Plot type | Count rate plots | Images |
|---|---|---|
| Comparison with Poisson distribution Blue bars denote a histogram of data divided into 1 sec bins. Red curve is a Poisson curve with rate = median count rate of data. |
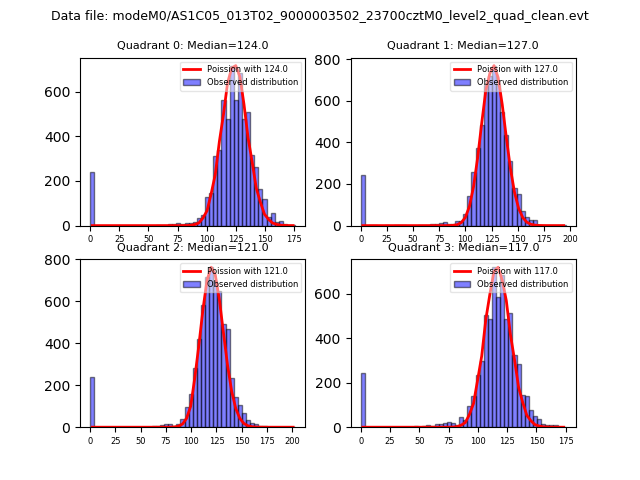 |
 |
| Quadrant-wise count rates Data is divided into 100 sec bins |
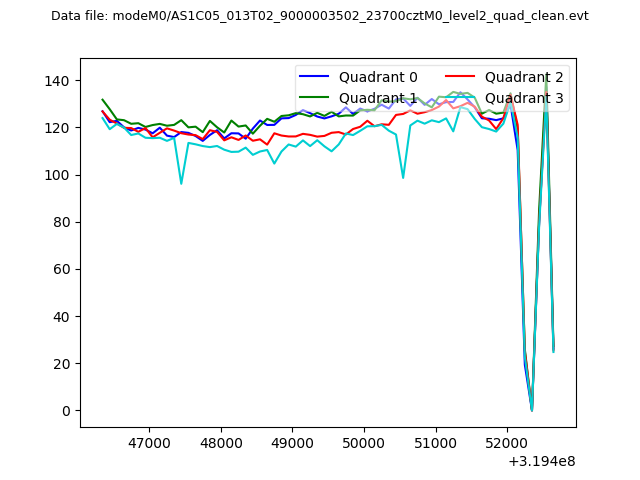 |
|
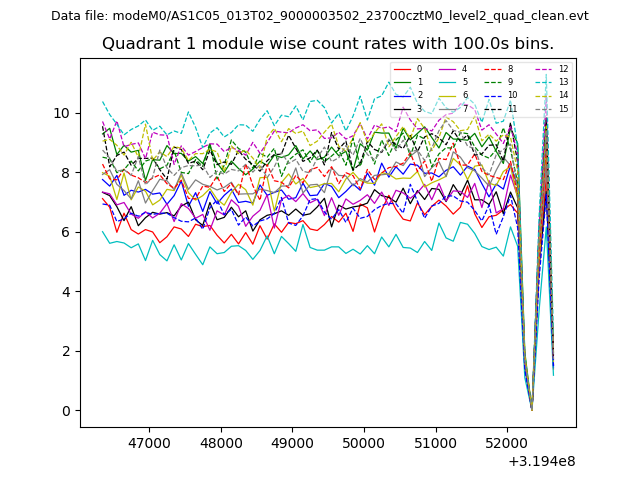
| Module-wise count rates for Quadrant A Data is divided into 100 sec bins |
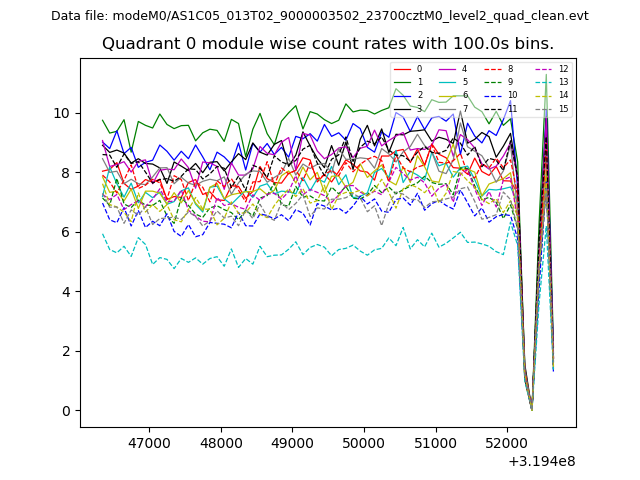 |
 |
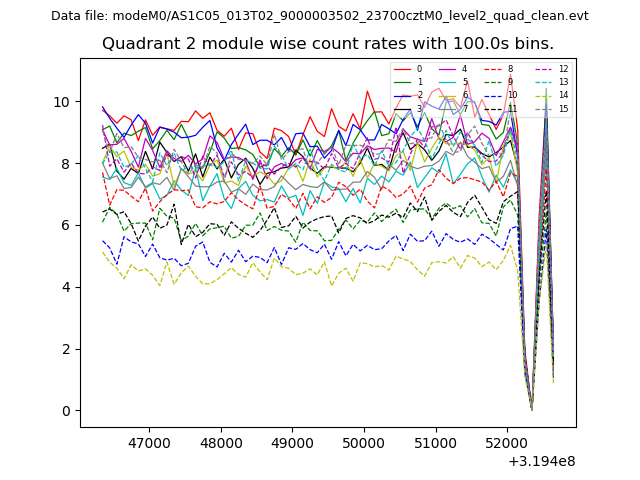
| Module-wise count rates for Quadrant B Data is divided into 100 sec bins |
 |
 |
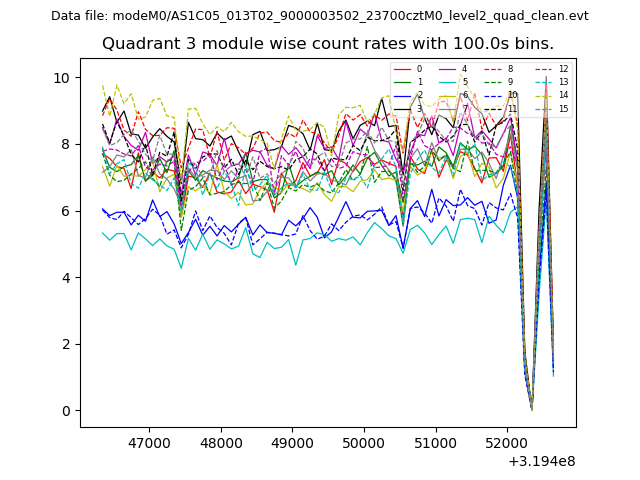
| Module-wise count rates for Quadrant C Data is divided into 100 sec bins |
 |
 |
| Module-wise count rates for Quadrant D Data is divided into 100 sec bins |
 |
 |
| Parameter | Plot |
|---|---|
| CZT HV Monitor | 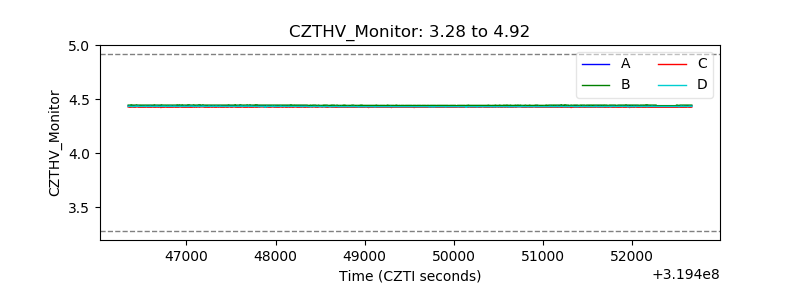 |
| D_VDD | 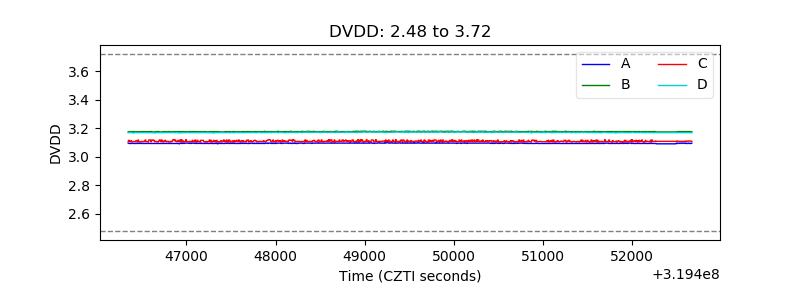 |
| Temperature 1 | 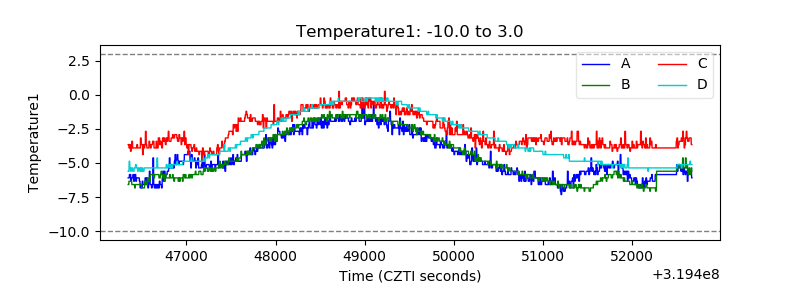 |
| Veto HV Monitor | 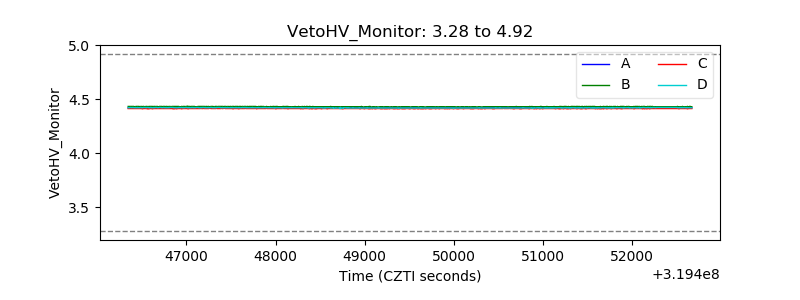 |
| Veto LLD | 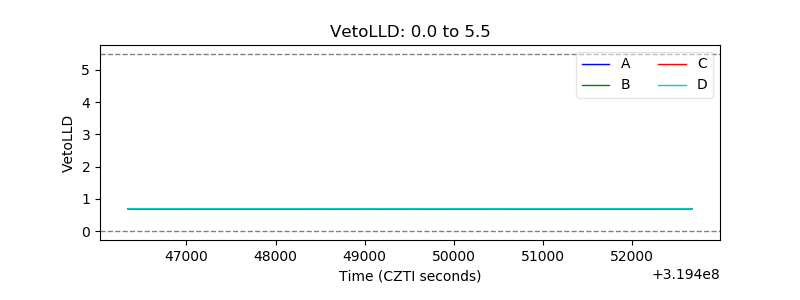 |
| Alpha Counter | 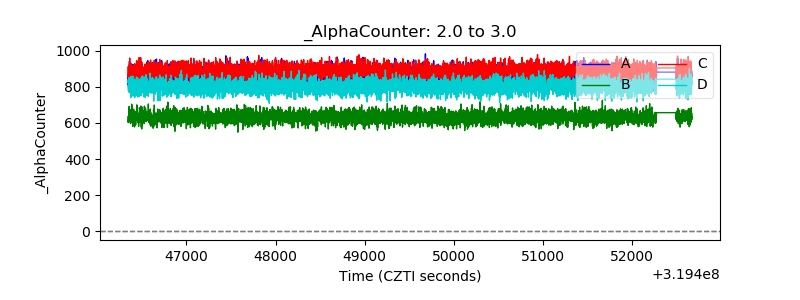 |
| _CPM_Rate | 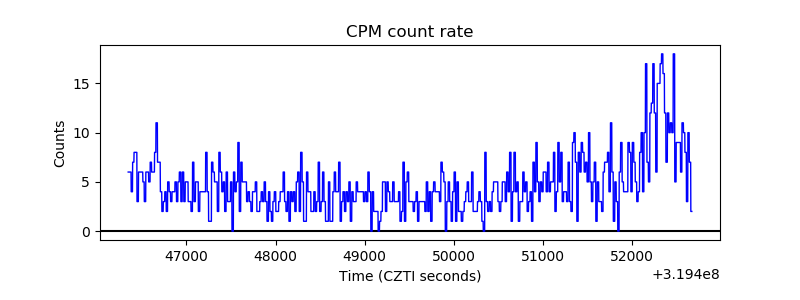 |
| CZT Counter | 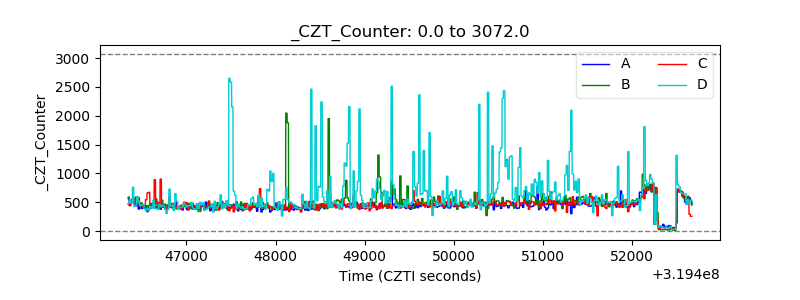 |
| +2.5 Volts monitor | 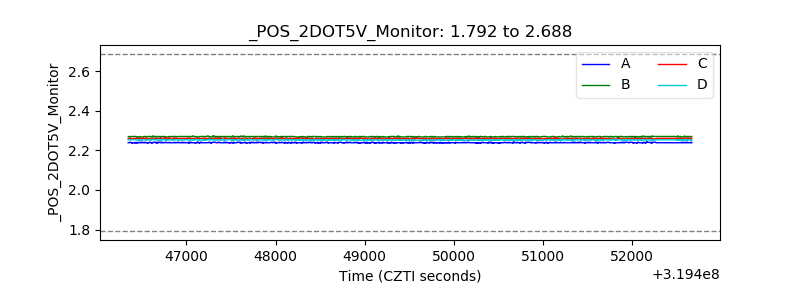 |
| +5 Volts monitor | 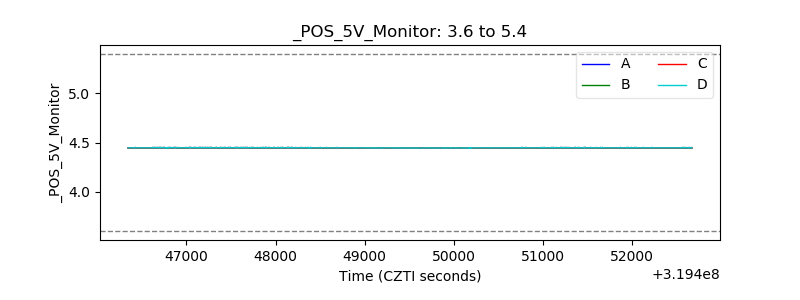 |
| _ROLL_ROT | 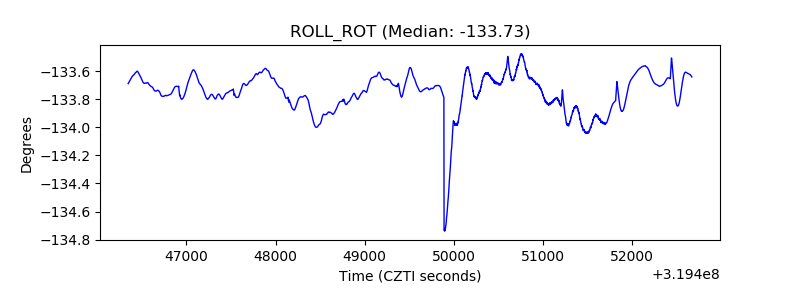 |
| _Roll_DEC | 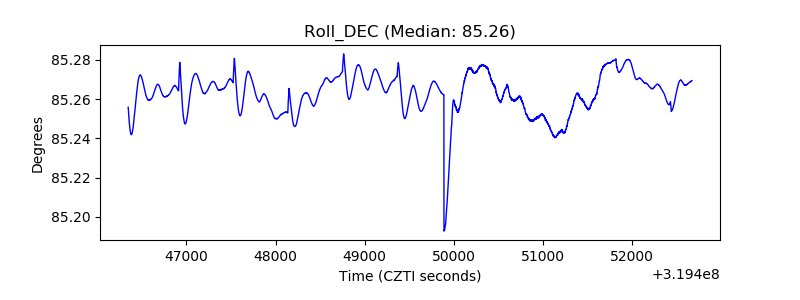 |
| _Roll_RA | 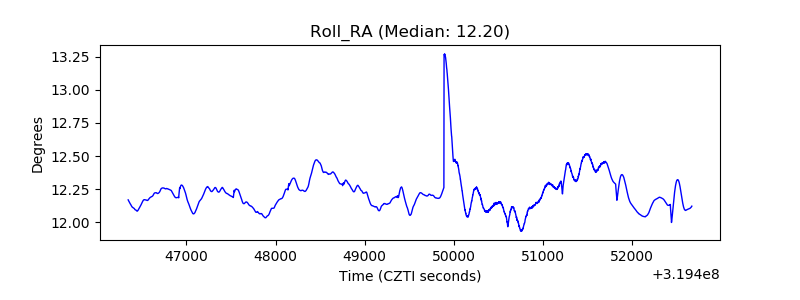 |
| Veto Counter | 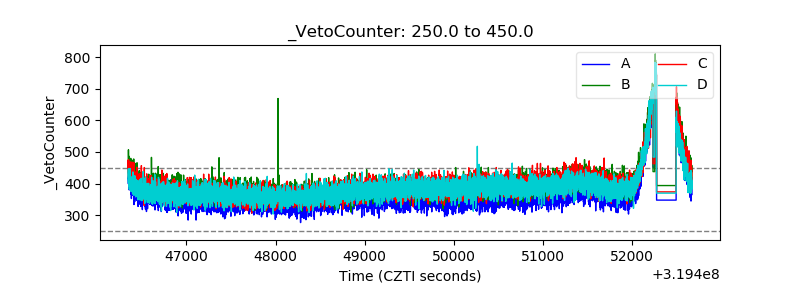 |