| Param | Original file | Final file |
|---|---|---|
| Filename | modeM0/AS1A07_027T05_9000003506cztM0_level2.fits | modeM0/AS1A07_027T05_9000003506cztM0_level2_quad_clean.evt |
| Size (bytes) | 231,995,520 | 209,378,880 |
| Size | 221.2 MB | 199.7 MB |
| Events in quadrant A | 1,416,782 | 1,238,238 |
| Events in quadrant B | 1,353,344 | 1,213,609 |
| Events in quadrant C | 1,389,238 | 1,186,054 |
| Events in quadrant D | 1,175,960 | 1,012,164 |
| Mode M0 | |||
|---|---|---|---|
| Quadrant | BADHDUFLAG | Total packets | Discarded packets |
| A | 0 | 50537 | 0 |
| B | 0 | 56409 | 0 |
| C | 0 | 51080 | 0 |
| D | 0 | 70675 | 0 |
| Mode M9 | |||
|---|---|---|---|
| Quadrant | BADHDUFLAG | Total packets | Discarded packets |
| A | 0 | 33 | 0 |
| B | 0 | 33 | 0 |
| C | 0 | 33 | 0 |
| D | 0 | 33 | 0 |
| Mode SS | |||
|---|---|---|---|
| Quadrant | BADHDUFLAG | Total packets | Discarded packets |
| A | 0 | 504 | 0 |
| B | 0 | 504 | 0 |
| C | 0 | 504 | 0 |
| D | 0 | 504 | 0 |
| Quadrant | Total seconds | Saturated seconds | Saturation percentage |
|---|---|---|---|
| A | 24555 | 285 | 1.160660% |
| B | 24555 | 610 | 2.484219% |
| C | 24555 | 451 | 1.836693% |
| D | 24555 | 1891 | 7.701079% |
Noise dominated data is calculated using 1-second bins in cleaned event files. If a bin has >2000 counts, and if more than 50% of those come from <1% of pixels, then it is considered to be noise-dominated and hence unusable.
| Quadrant | # 1 sec bins | Bins with >0 counts | Bins with >2000 counts | High rate bins dominated by noise | Noise dominated (total time) | Noise dominated (detector-on time) | Marked lightcurve |
|---|---|---|---|---|---|---|---|
| A | 27955 | 24550 | 0 | 0 | 0.00% | 0.00% |  |
| B | 27955 | 24549 | 0 | 0 | 0.00% | 0.00% |  |
| C | 27955 | 24550 | 0 | 0 | 0.00% | 0.00% | 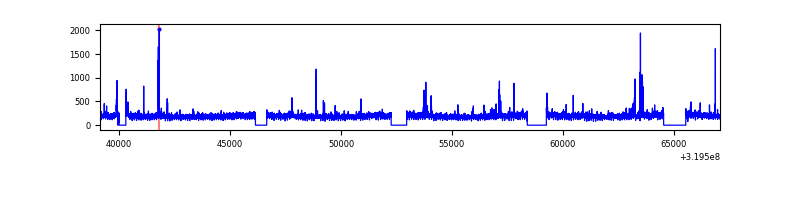 |
| D | 27955 | 24497 | 0 | 0 | 0.00% | 0.00% |  |
Top three noisy pixels from each quadrant. If the there are fewer than three noisy pixels in the level2.evt file, extra rows are filled as -1
| Pixel properties | Quadrant properties | ||||||
|---|---|---|---|---|---|---|---|
| Quadrant | DetID | PixID | Counts | Sigma | Mean | Median | Sigma |
| A | 0 | 29 | 1315 | 10.38 | 368 | 344 | 93.5 |
| A | 7 | 110 | 1139 | 8.5 | 368 | 344 | 93.5 |
| A | 0 | 30 | 1063 | 7.69 | 368 | 344 | 93.5 |
| B | 2 | 9 | 1118 | 10.55 | 357 | 339 | 73.8 |
| B | 5 | 128 | 922 | 7.9 | 357 | 339 | 73.8 |
| B | 2 | 8 | 902 | 7.63 | 357 | 339 | 73.8 |
| C | 12 | 241 | 1003 | 6.93 | 366 | 341 | 95.6 |
| C | 2 | 191 | 953 | 6.4 | 366 | 341 | 95.6 |
| C | 9 | 209 | 935 | 6.22 | 366 | 341 | 95.6 |
| D | 13 | 238 | 912 | 6.53 | 335 | 304 | 93.1 |
| D | 6 | 231 | 848 | 5.84 | 335 | 304 | 93.1 |
| D | 10 | 189 | 830 | 5.65 | 335 | 304 | 93.1 |
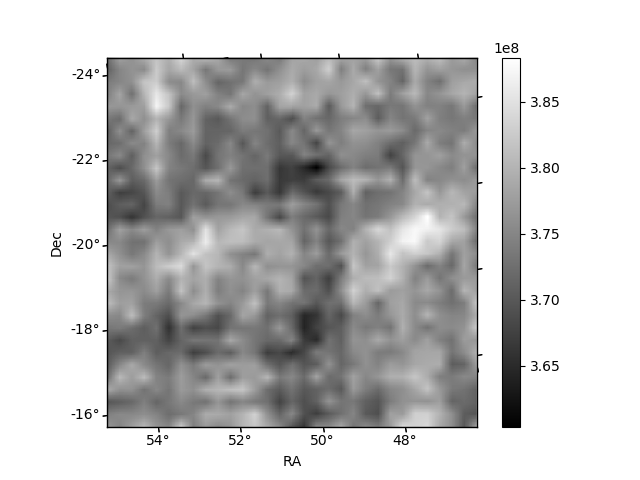
Histogram calculated using DETX and DETY for each event in the final _common_clean file
| Quadrant A | 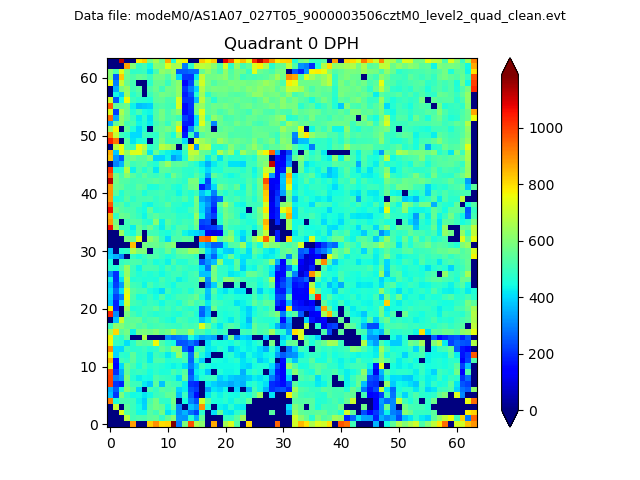 |
 |
Quadrant B |
|---|---|---|---|
| Quadrant D |  |
 |
Quadrant C |
| Plot type | Count rate plots | Images |
|---|---|---|
| Comparison with Poisson distribution Blue bars denote a histogram of data divided into 1 sec bins. Red curve is a Poisson curve with rate = median count rate of data. |
 |
 |
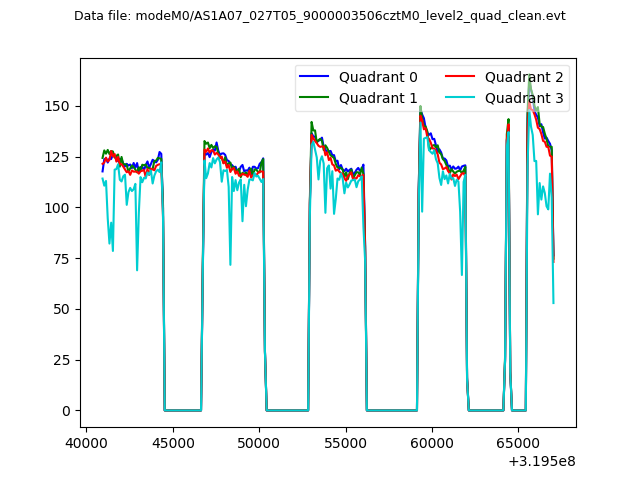
| Quadrant-wise count rates Data is divided into 100 sec bins |
 |
|
| Module-wise count rates for Quadrant A Data is divided into 100 sec bins |
 |
 |
| Module-wise count rates for Quadrant B Data is divided into 100 sec bins |
 |
 |
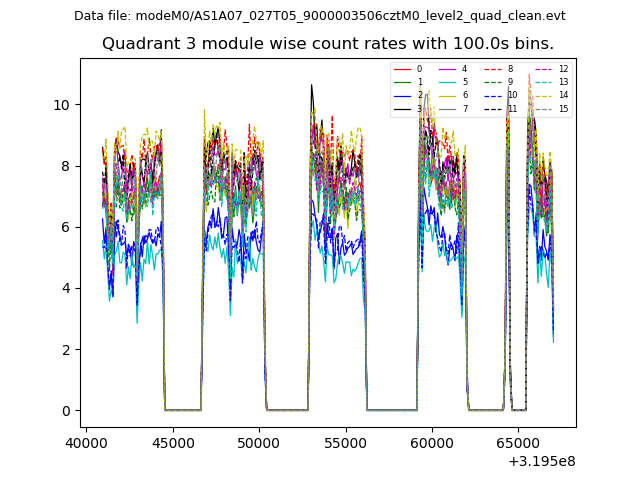
| Module-wise count rates for Quadrant C Data is divided into 100 sec bins |
 |
 |
| Module-wise count rates for Quadrant D Data is divided into 100 sec bins |
 |
 |
| Parameter | Plot |
|---|---|
| CZT HV Monitor |  |
| D_VDD |  |
| Temperature 1 |  |
| Veto HV Monitor |  |
| Veto LLD | 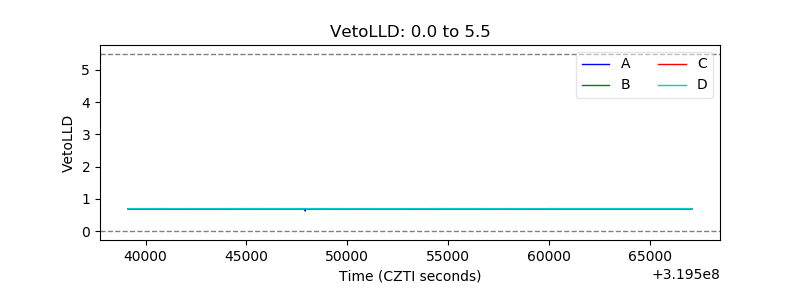 |
| Alpha Counter |  |
| _CPM_Rate |  |
| CZT Counter |  |
| +2.5 Volts monitor | 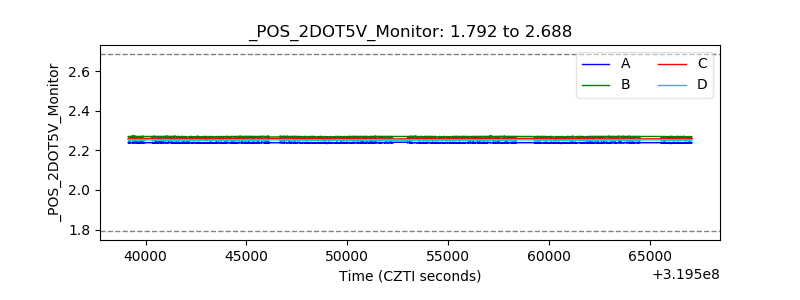 |
| +5 Volts monitor |  |
| _ROLL_ROT |  |
| _Roll_DEC |  |
| _Roll_RA |  |
| Veto Counter |  |