| Param | Original file | Final file |
|---|---|---|
| Filename | modeM0/AS1A07_027T05_9000003506_23718cztM0_level2.evt | modeM0/AS1A07_027T05_9000003506_23718cztM0_level2_quad_clean.evt |
| Size (bytes) | 1,344,792,960 | 231,508,800 |
| Size | 1.3 GB | 220.8 MB |
| Events in quadrant A | 8,369,240 | 1,485,577 |
| Events in quadrant B | 9,482,858 | 1,480,858 |
| Events in quadrant C | 8,507,802 | 1,455,190 |
| Events in quadrant D | 13,160,376 | 1,358,450 |
| Mode M0 | |||
|---|---|---|---|
| Quadrant | BADHDUFLAG | Total packets | Discarded packets |
| A | 0 | 36538 | 3 |
| B | 0 | 39442 | 3 |
| C | 0 | 36851 | 3 |
| D | 0 | 50897 | 3 |
| Mode M9 | |||
|---|---|---|---|
| Quadrant | BADHDUFLAG | Total packets | Discarded packets |
| A | 0 | 20 | 0 |
| B | 0 | 20 | 0 |
| C | 0 | 20 | 0 |
| D | 0 | 20 | 0 |
| Mode SS | |||
|---|---|---|---|
| Quadrant | BADHDUFLAG | Total packets | Discarded packets |
| A | 0 | 364 | 0 |
| B | 0 | 364 | 0 |
| C | 0 | 364 | 0 |
| D | 0 | 364 | 0 |
| Quadrant | Total seconds | Saturated seconds | Saturation percentage |
|---|---|---|---|
| A | 17864 | 147 | 0.822884% |
| B | 17863 | 221 | 1.237194% |
| C | 17863 | 234 | 1.309970% |
| D | 17864 | 1234 | 6.907747% |
Noise dominated data is calculated using 1-second bins in cleaned event files. If a bin has >2000 counts, and if more than 50% of those come from <1% of pixels, then it is considered to be noise-dominated and hence unusable.
| Quadrant | # 1 sec bins | Bins with >0 counts | Bins with >2000 counts | High rate bins dominated by noise | Noise dominated (total time) | Noise dominated (detector-on time) | Marked lightcurve |
|---|---|---|---|---|---|---|---|
| A | 19939 | 17864 | 0 | 0 | 0.00% | 0.00% | 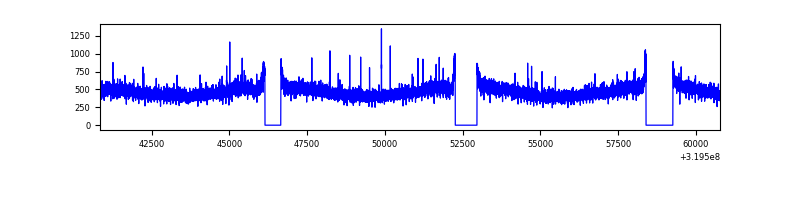 |
| B | 19938 | 17863 | 47 | 47 | 0.24% | 0.26% | 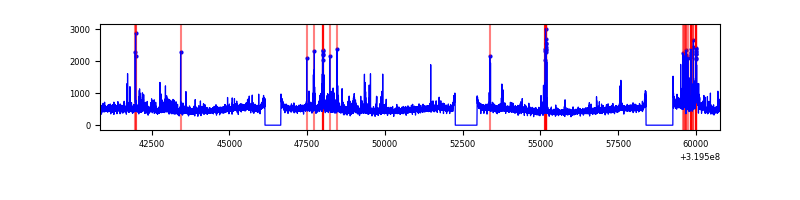 |
| C | 19938 | 17864 | 2 | 2 | 0.01% | 0.01% | 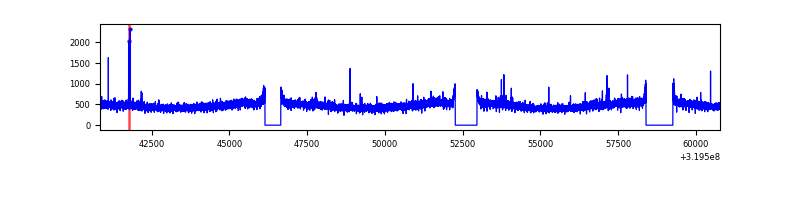 |
| D | 19939 | 17865 | 1063 | 1063 | 5.33% | 5.95% | 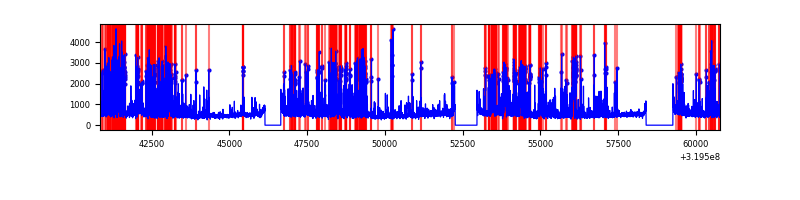 |
Top three noisy pixels from each quadrant. If the there are fewer than three noisy pixels in the level2.evt file, extra rows are filled as -1
| Pixel properties | Quadrant properties | ||||||
|---|---|---|---|---|---|---|---|
| Quadrant | DetID | PixID | Counts | Sigma | Mean | Median | Sigma |
| A | 13 | 254 | 32253 | 68.71 | 2167 | 2116 | 438.6 |
| A | 3 | 137 | 19039 | 38.58 | 2167 | 2116 | 438.6 |
| A | 0 | 226 | 18767 | 37.96 | 2167 | 2116 | 438.6 |
| B | 0 | 189 | 351962 | 845.54 | 2150 | 2098 | 413.8 |
| B | 0 | 229 | 279032 | 669.29 | 2150 | 2098 | 413.8 |
| B | 15 | 33 | 150858 | 359.52 | 2150 | 2098 | 413.8 |
| C | 14 | 238 | 324710 | 665.22 | 2073 | 2088 | 485.0 |
| C | 7 | 247 | 83090 | 167.02 | 2073 | 2088 | 485.0 |
| C | 13 | 61 | 14696 | 26.0 | 2073 | 2088 | 485.0 |
| D | 1 | 52 | 4091682 | 8160.3 | 2053 | 1993 | 501.2 |
| D | 12 | 233 | 488872 | 971.49 | 2053 | 1993 | 501.2 |
| D | 12 | 217 | 228736 | 452.43 | 2053 | 1993 | 501.2 |
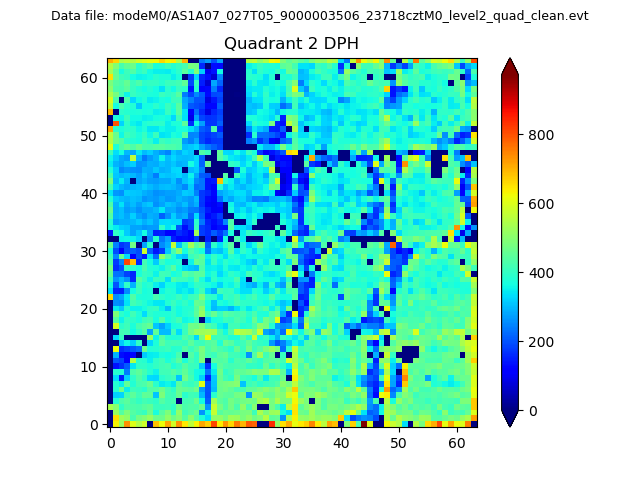
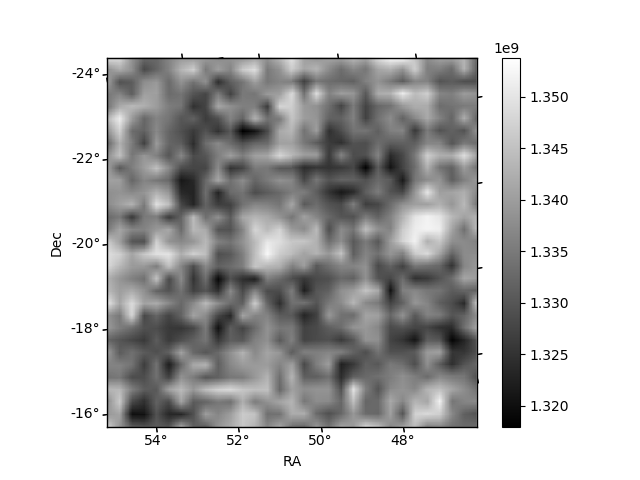
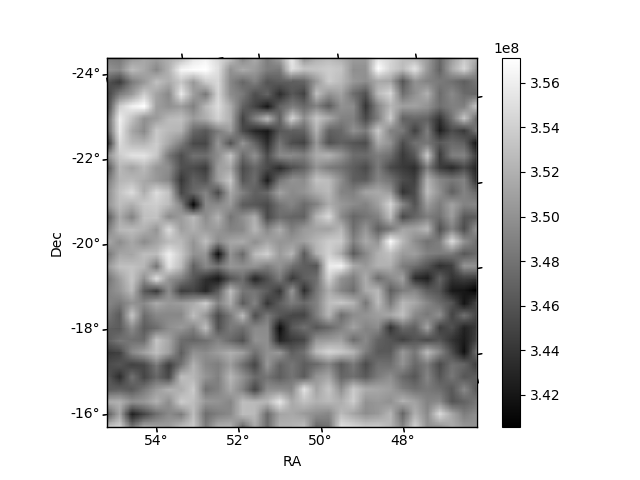
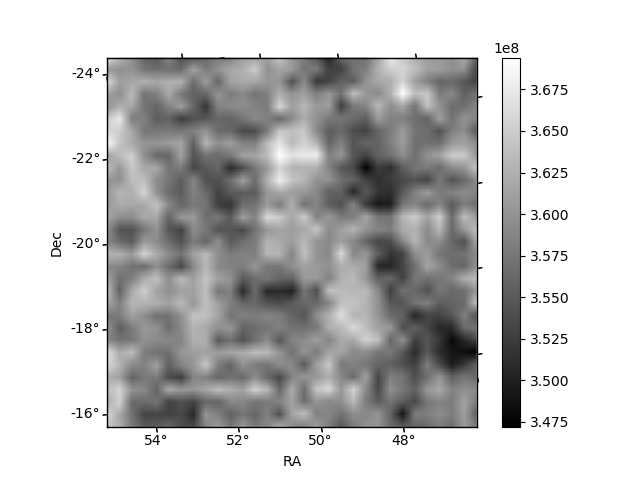
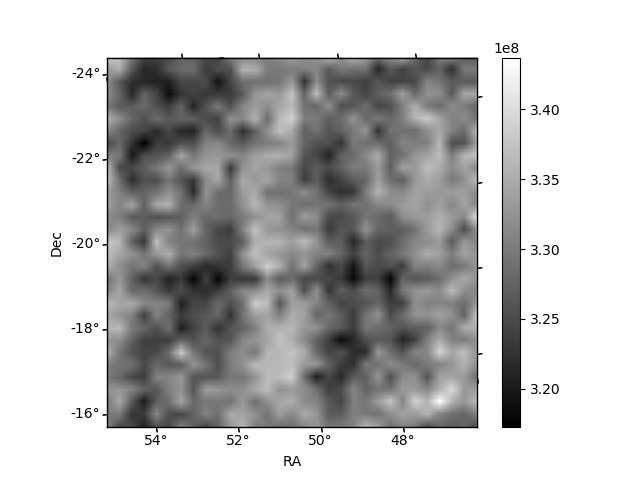
Histogram calculated using DETX and DETY for each event in the final _common_clean file
| Quadrant A | 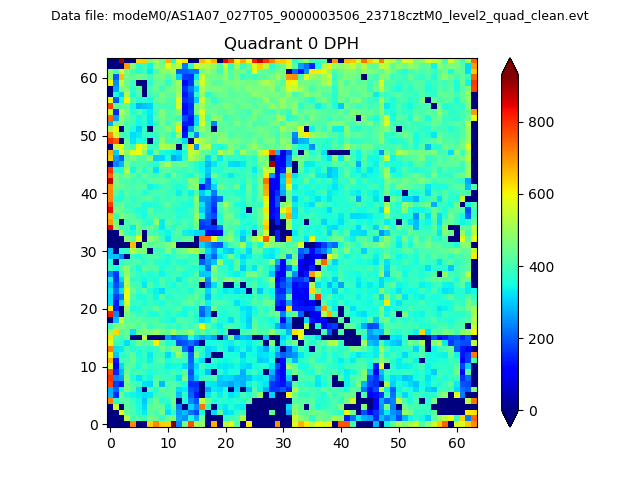 |
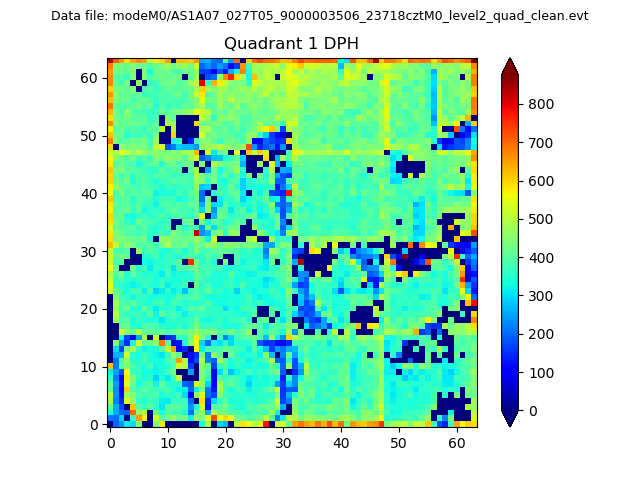 |
Quadrant B |
|---|---|---|---|
| Quadrant D | 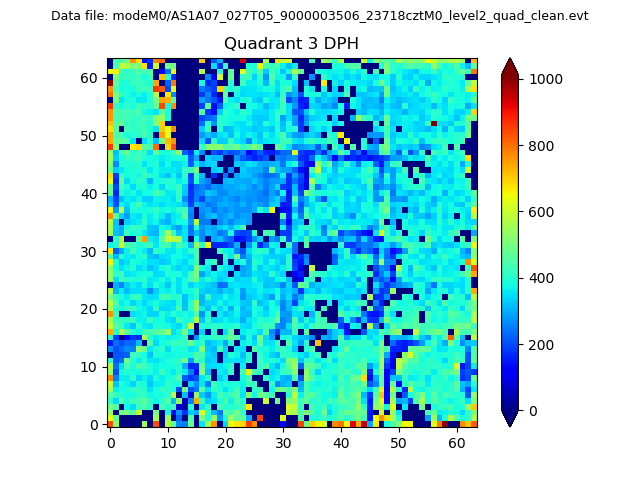 |
 |
Quadrant C |
| Plot type | Count rate plots | Images |
|---|---|---|
| Comparison with Poisson distribution Blue bars denote a histogram of data divided into 1 sec bins. Red curve is a Poisson curve with rate = median count rate of data. |
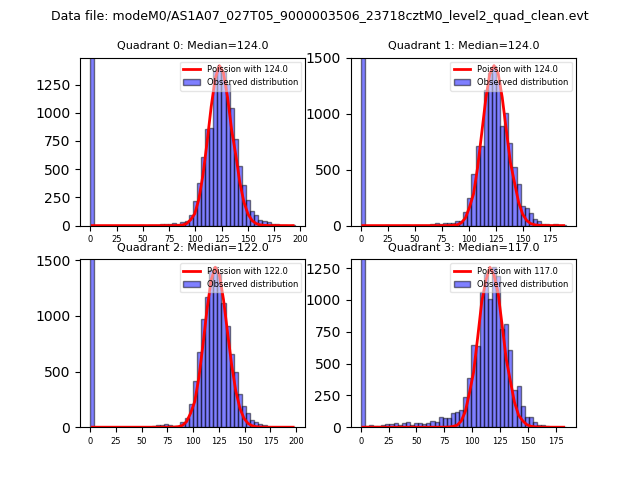 |
 |
| Quadrant-wise count rates Data is divided into 100 sec bins |
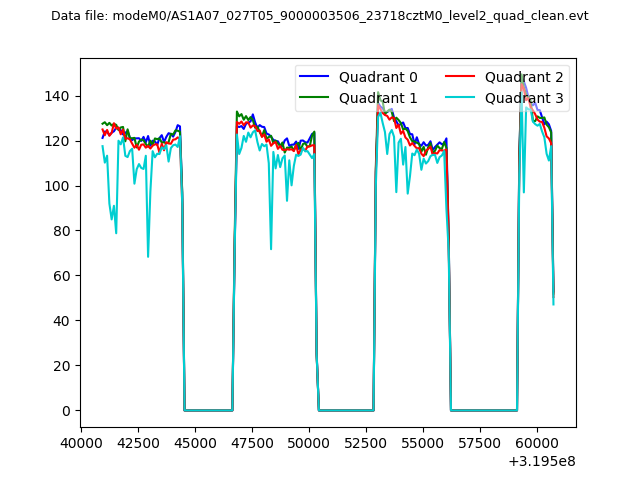 |
|
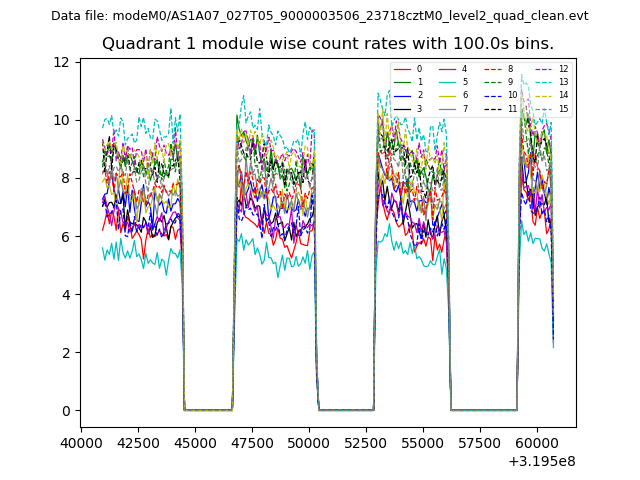
| Module-wise count rates for Quadrant A Data is divided into 100 sec bins |
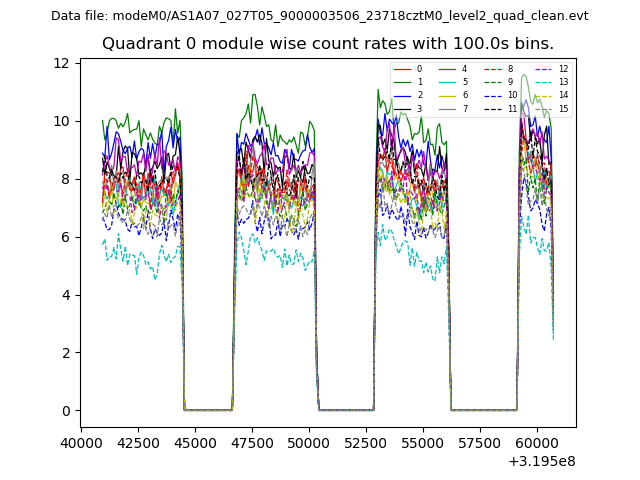 |
 |
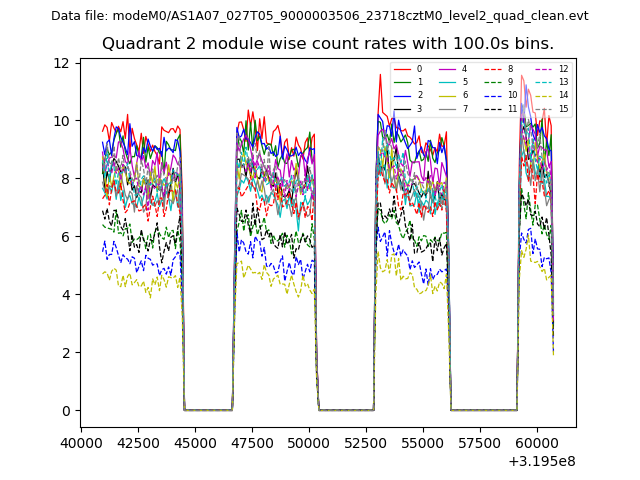
| Module-wise count rates for Quadrant B Data is divided into 100 sec bins |
 |
 |
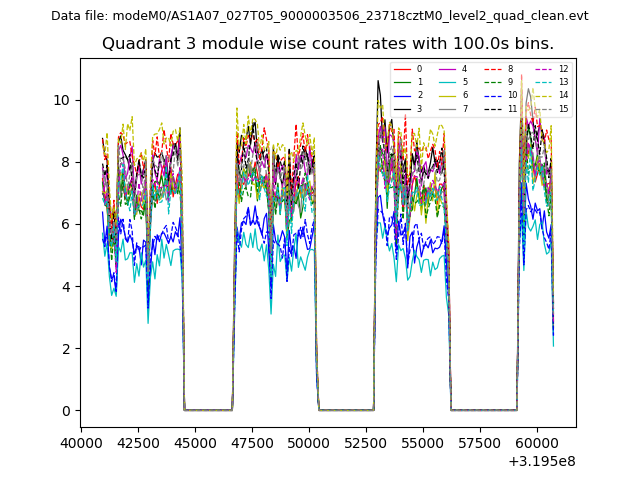
| Module-wise count rates for Quadrant C Data is divided into 100 sec bins |
 |
 |
| Module-wise count rates for Quadrant D Data is divided into 100 sec bins |
 |
 |
| Parameter | Plot |
|---|---|
| CZT HV Monitor | 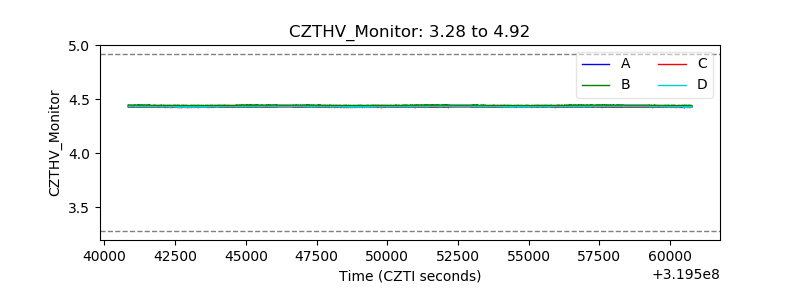 |
| D_VDD | 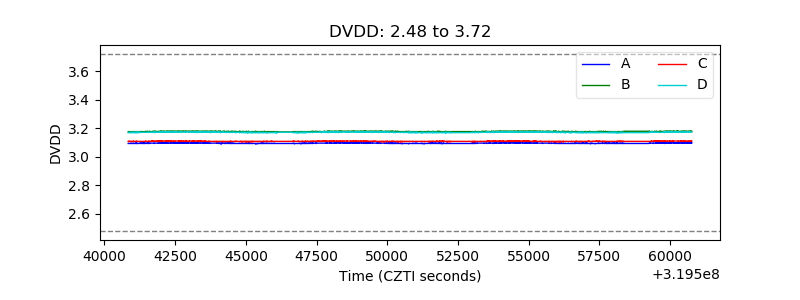 |
| Temperature 1 | 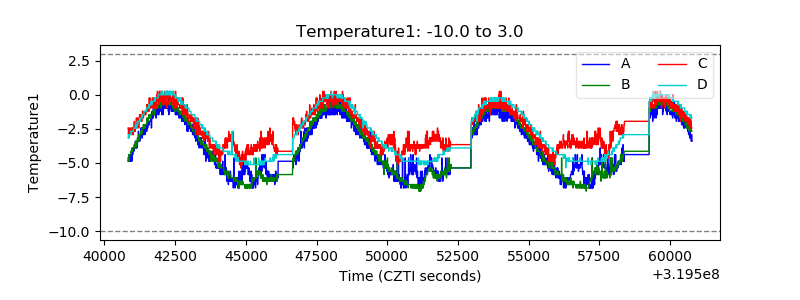 |
| Veto HV Monitor | 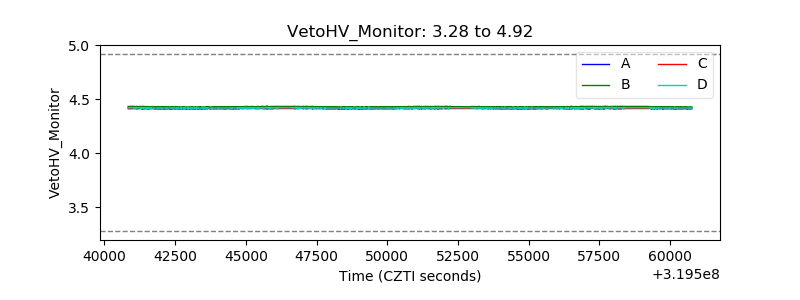 |
| Veto LLD | 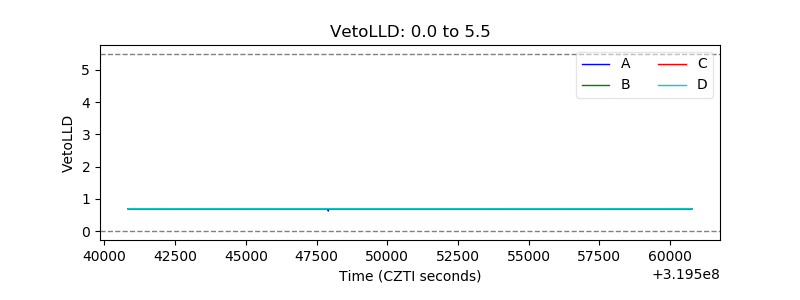 |
| Alpha Counter | 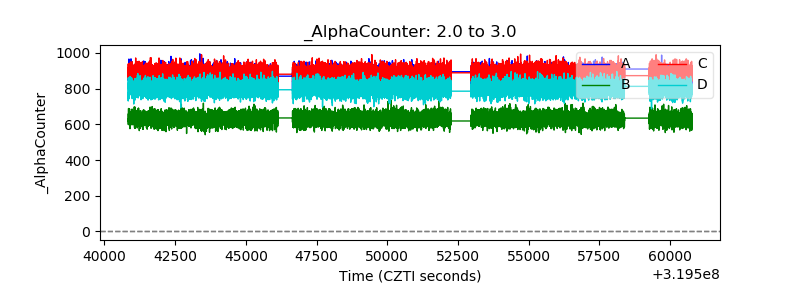 |
| _CPM_Rate | 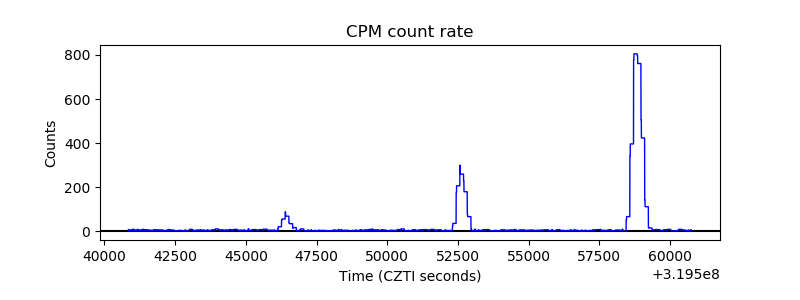 |
| CZT Counter | 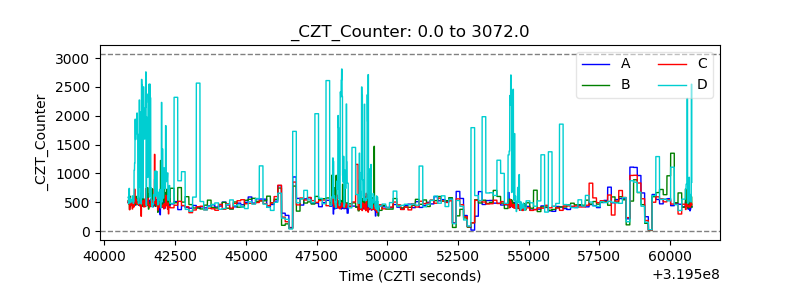 |
| +2.5 Volts monitor |  |
| +5 Volts monitor |  |
| _ROLL_ROT | 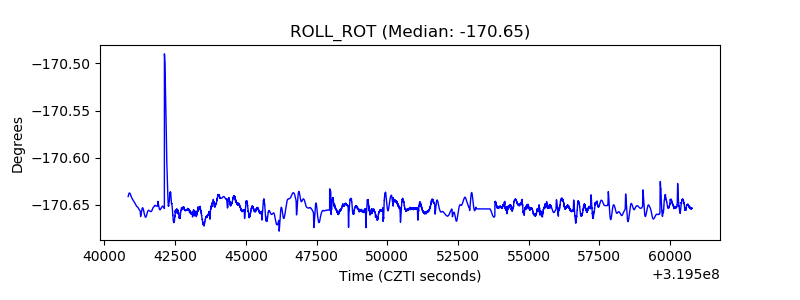 |
| _Roll_DEC | 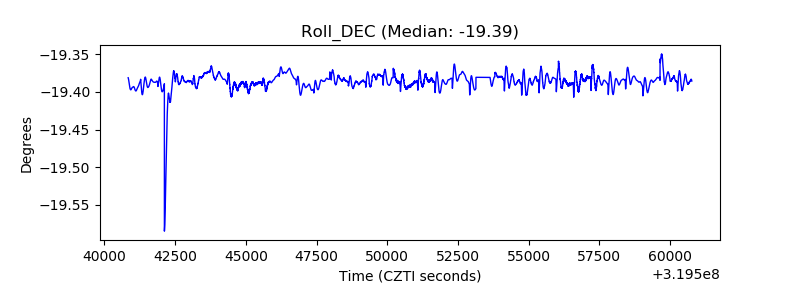 |
| _Roll_RA | 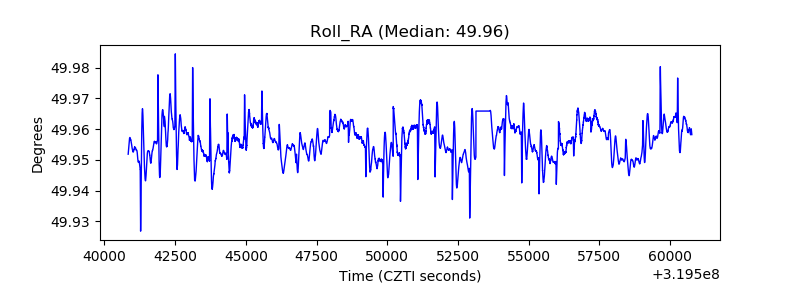 |
| Veto Counter | 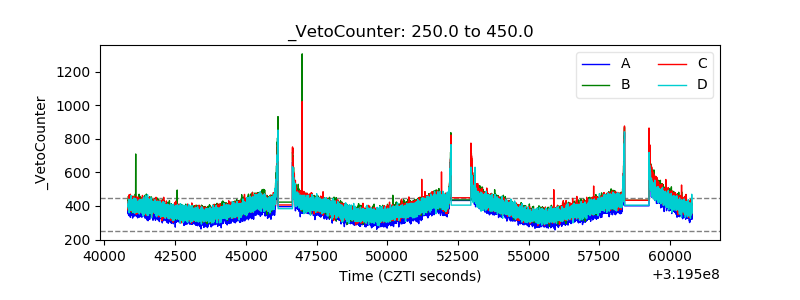 |