| Param | Original file | Final file |
|---|---|---|
| Filename | modeM0/AS1A07_027T05_9000003506_23719cztM0_level2.evt | modeM0/AS1A07_027T05_9000003506_23719cztM0_level2_quad_clean.evt |
| Size (bytes) | 509,587,200 | 83,283,840 |
| Size | 486.0 MB | 79.4 MB |
| Events in quadrant A | 2,996,771 | 540,000 |
| Events in quadrant B | 4,118,627 | 538,617 |
| Events in quadrant C | 3,094,669 | 523,618 |
| Events in quadrant D | 4,793,517 | 478,134 |
| Mode M0 | |||
|---|---|---|---|
| Quadrant | BADHDUFLAG | Total packets | Discarded packets |
| A | 0 | 13067 | 2 |
| B | 0 | 16407 | 1 |
| C | 0 | 13211 | 1 |
| D | 0 | 18483 | 1 |
| Mode M9 | |||
|---|---|---|---|
| Quadrant | BADHDUFLAG | Total packets | Discarded packets |
| A | 0 | 10 | 0 |
| B | 0 | 10 | 0 |
| C | 0 | 10 | 0 |
| D | 0 | 10 | 0 |
| Mode SS | |||
|---|---|---|---|
| Quadrant | BADHDUFLAG | Total packets | Discarded packets |
| A | 0 | 128 | 0 |
| B | 0 | 128 | 0 |
| C | 0 | 128 | 0 |
| D | 0 | 128 | 0 |
| Quadrant | Total seconds | Saturated seconds | Saturation percentage |
|---|---|---|---|
| A | 6326 | 45 | 0.711350% |
| B | 6327 | 247 | 3.903904% |
| C | 6327 | 89 | 1.406670% |
| D | 6327 | 538 | 8.503240% |
Noise dominated data is calculated using 1-second bins in cleaned event files. If a bin has >2000 counts, and if more than 50% of those come from <1% of pixels, then it is considered to be noise-dominated and hence unusable.
| Quadrant | # 1 sec bins | Bins with >0 counts | Bins with >2000 counts | High rate bins dominated by noise | Noise dominated (total time) | Noise dominated (detector-on time) | Marked lightcurve |
|---|---|---|---|---|---|---|---|
| A | 7326 | 6326 | 0 | 0 | 0.00% | 0.00% | 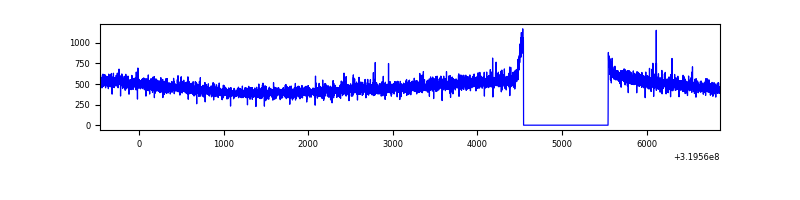 |
| B | 7327 | 6327 | 147 | 147 | 2.01% | 2.32% | 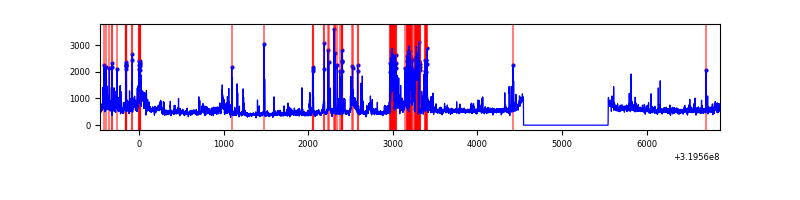 |
| C | 7327 | 6327 | 1 | 1 | 0.01% | 0.02% | 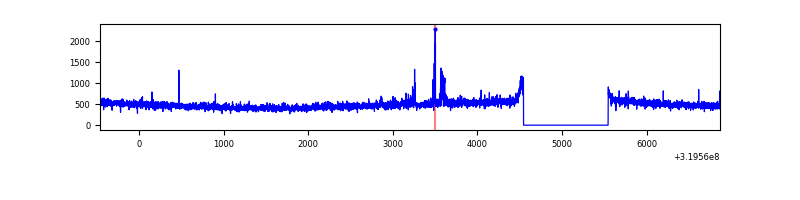 |
| D | 7327 | 6327 | 454 | 454 | 6.20% | 7.18% | 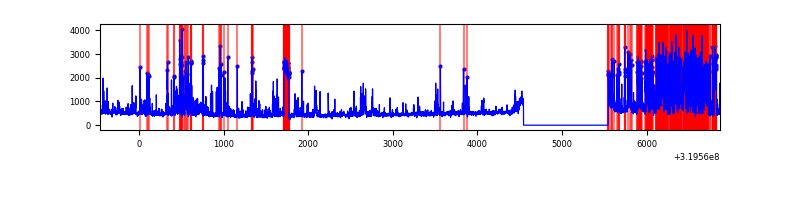 |
Top three noisy pixels from each quadrant. If the there are fewer than three noisy pixels in the level2.evt file, extra rows are filled as -1
| Pixel properties | Quadrant properties | ||||||
|---|---|---|---|---|---|---|---|
| Quadrant | DetID | PixID | Counts | Sigma | Mean | Median | Sigma |
| A | 13 | 254 | 11724 | 69.42 | 777 | 760 | 157.9 |
| A | 0 | 226 | 6674 | 37.44 | 777 | 760 | 157.9 |
| A | 3 | 137 | 6660 | 37.35 | 777 | 760 | 157.9 |
| B | 3 | 64 | 673686 | 4584.9 | 767 | 746 | 146.8 |
| B | 0 | 229 | 162845 | 1104.42 | 767 | 746 | 146.8 |
| B | 0 | 189 | 162332 | 1100.92 | 767 | 746 | 146.8 |
| C | 14 | 238 | 118649 | 671.2 | 742 | 746 | 175.7 |
| C | 7 | 247 | 59598 | 335.03 | 742 | 746 | 175.7 |
| C | 10 | 91 | 21082 | 115.77 | 742 | 746 | 175.7 |
| D | 1 | 52 | 1396397 | 7767.93 | 728 | 706 | 179.7 |
| D | 7 | 238 | 405348 | 2252.1 | 728 | 706 | 179.7 |
| D | 12 | 233 | 98181 | 542.51 | 728 | 706 | 179.7 |
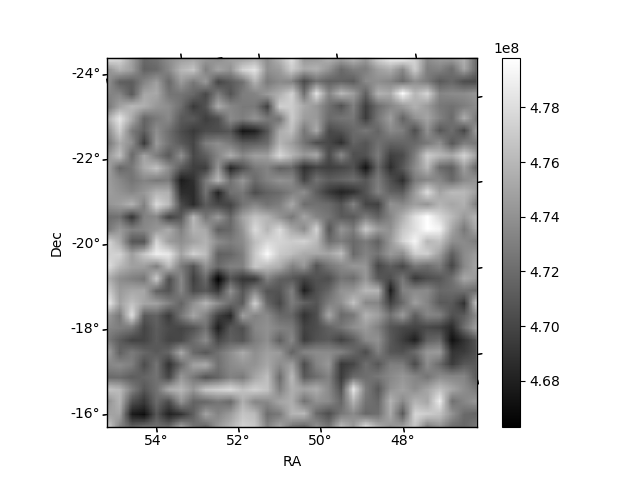
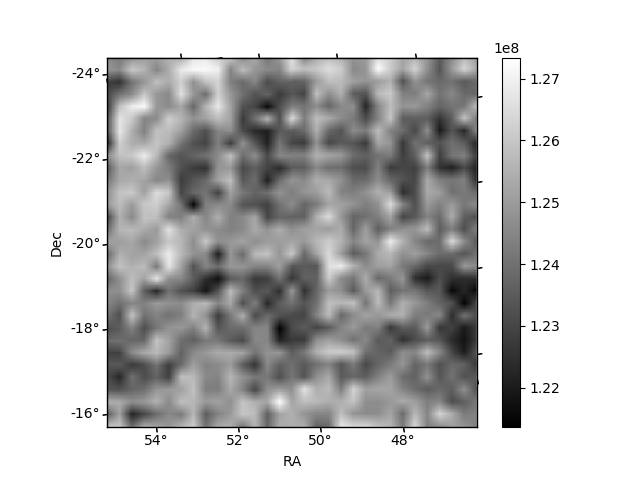
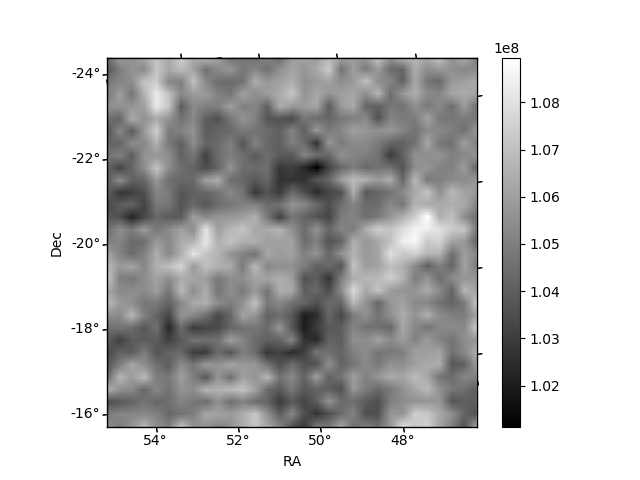
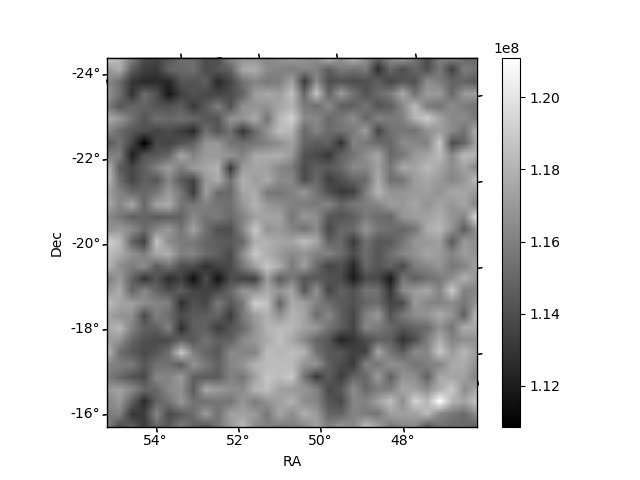
Histogram calculated using DETX and DETY for each event in the final _common_clean file
| Quadrant A | 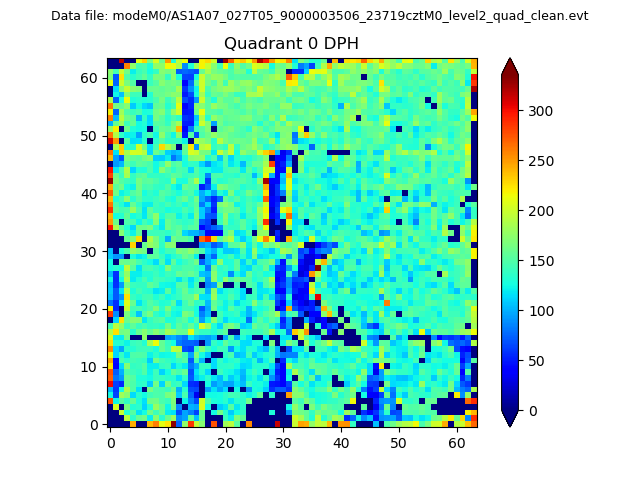 |
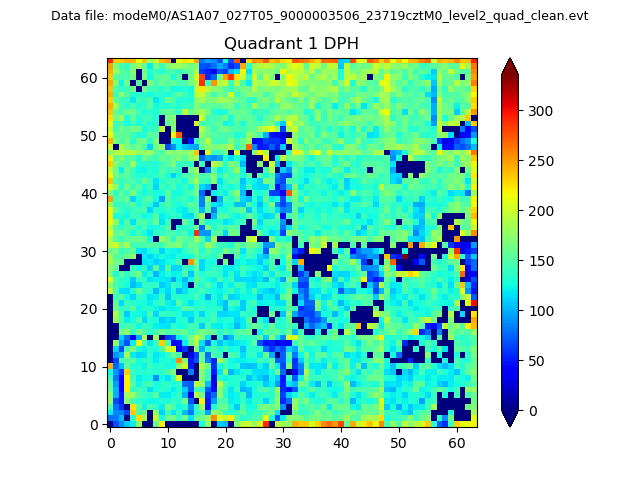 |
Quadrant B |
|---|---|---|---|
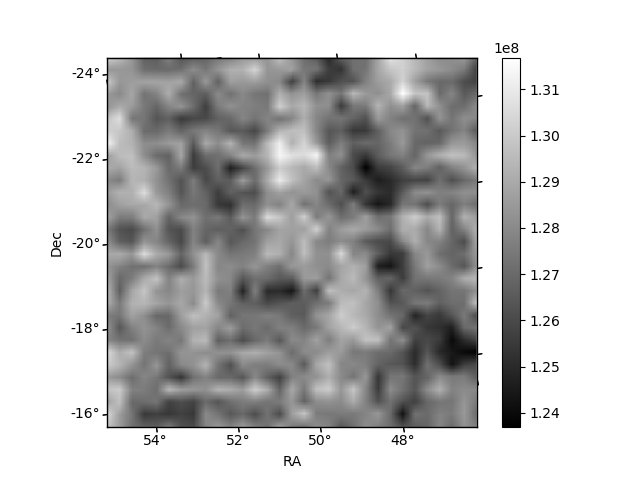
| Quadrant D | 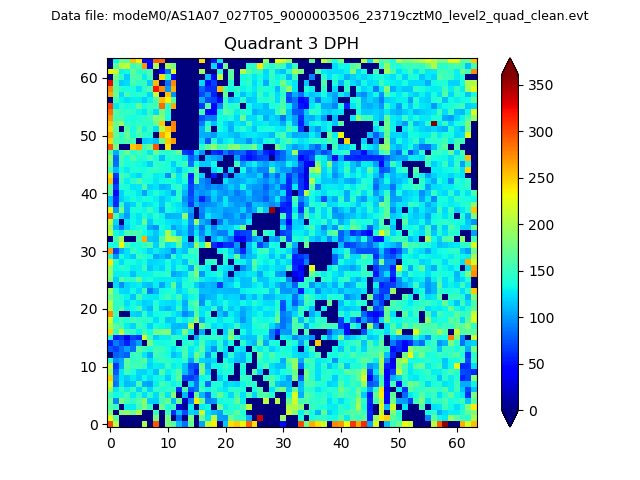 |
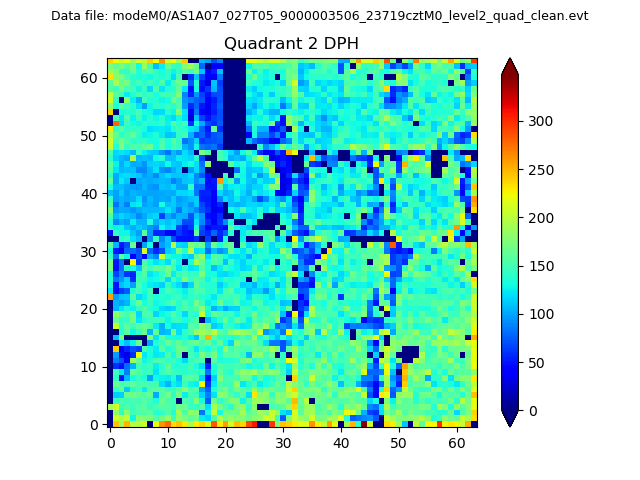 |
Quadrant C |
| Plot type | Count rate plots | Images |
|---|---|---|
| Comparison with Poisson distribution Blue bars denote a histogram of data divided into 1 sec bins. Red curve is a Poisson curve with rate = median count rate of data. |
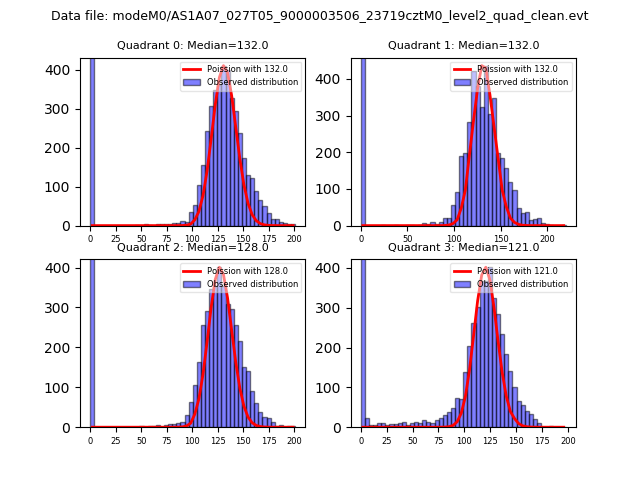 |
 |
| Quadrant-wise count rates Data is divided into 100 sec bins |
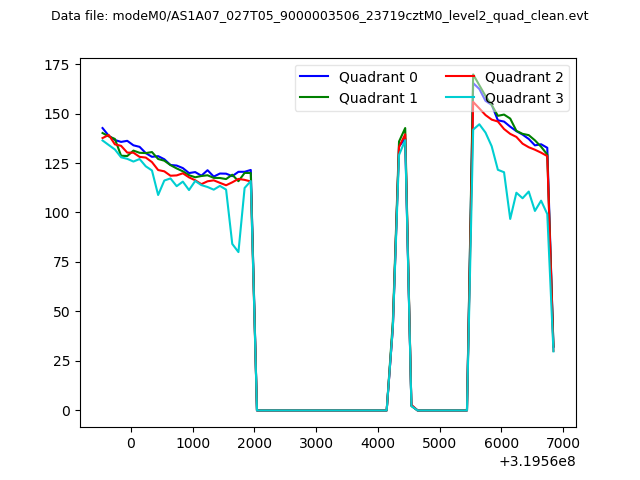 |
|
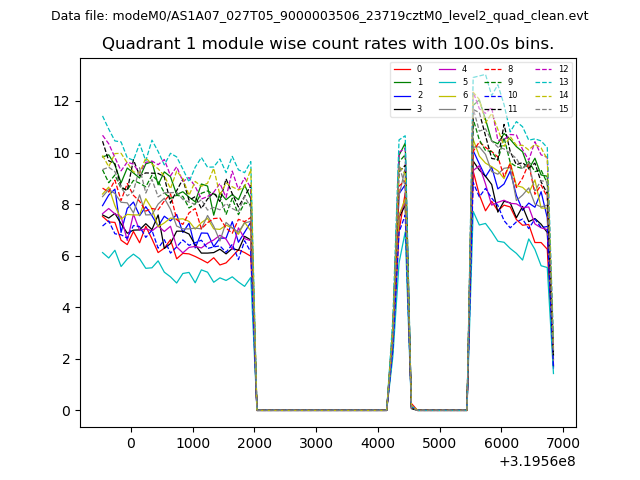
| Module-wise count rates for Quadrant A Data is divided into 100 sec bins |
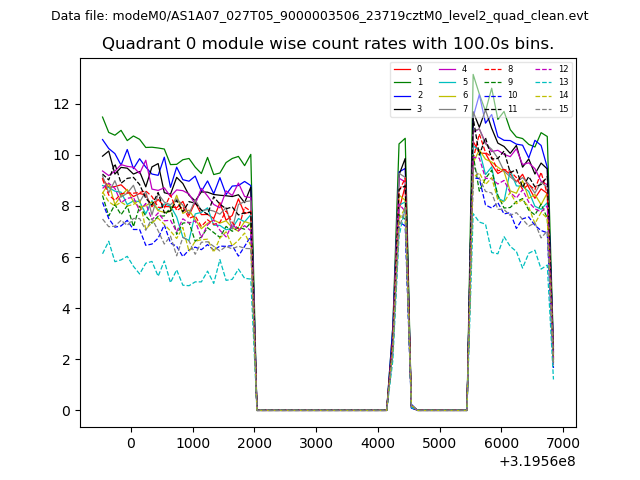 |
 |
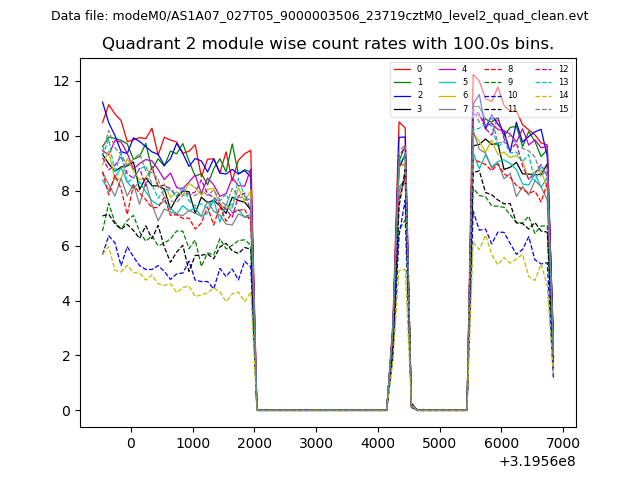
| Module-wise count rates for Quadrant B Data is divided into 100 sec bins |
 |
 |
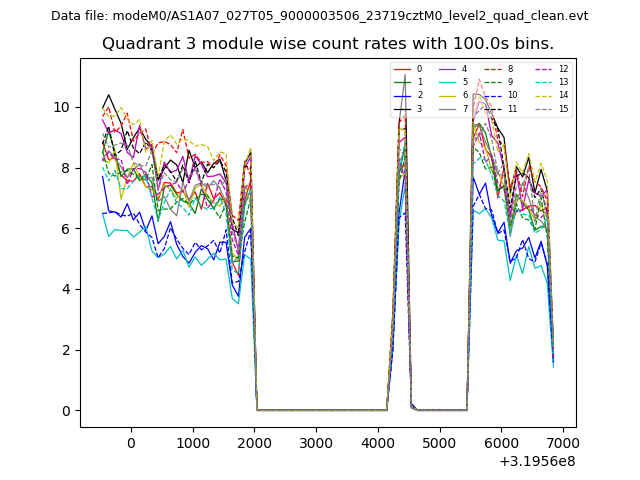
| Module-wise count rates for Quadrant C Data is divided into 100 sec bins |
 |
 |
| Module-wise count rates for Quadrant D Data is divided into 100 sec bins |
 |
 |
| Parameter | Plot |
|---|---|
| CZT HV Monitor | 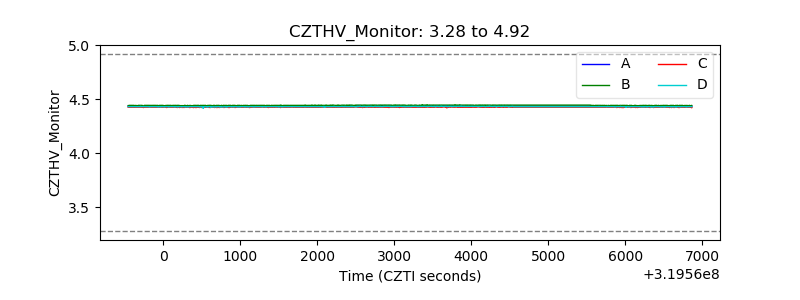 |
| D_VDD | 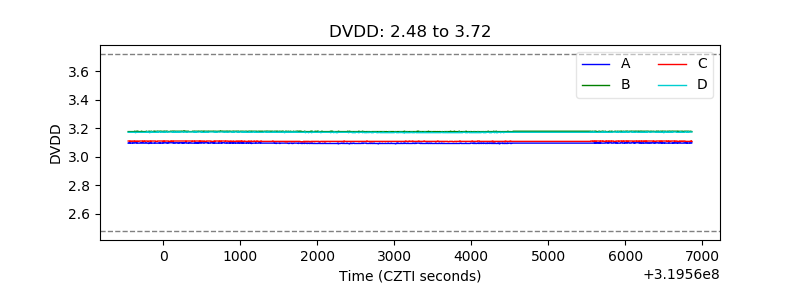 |
| Temperature 1 |  |
| Veto HV Monitor | 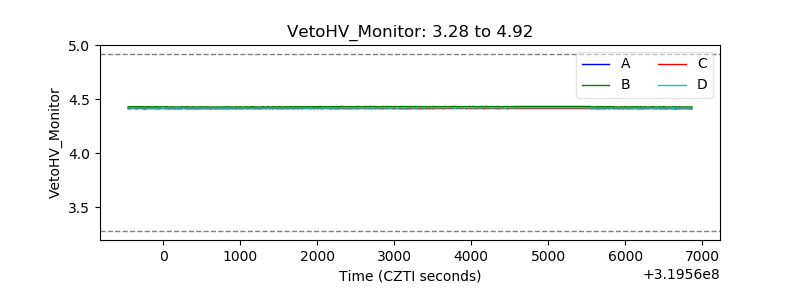 |
| Veto LLD | 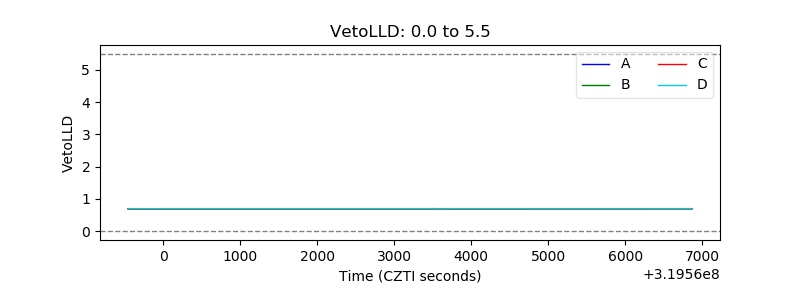 |
| Alpha Counter | 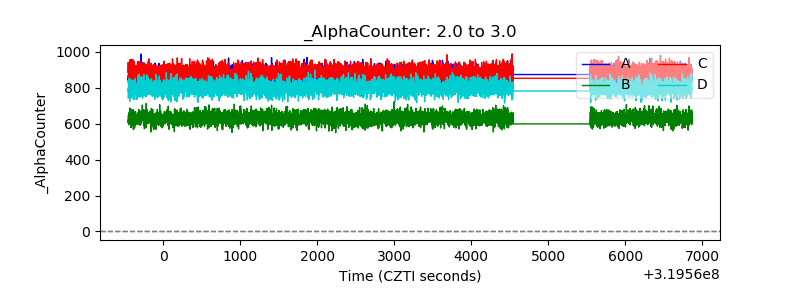 |
| _CPM_Rate | 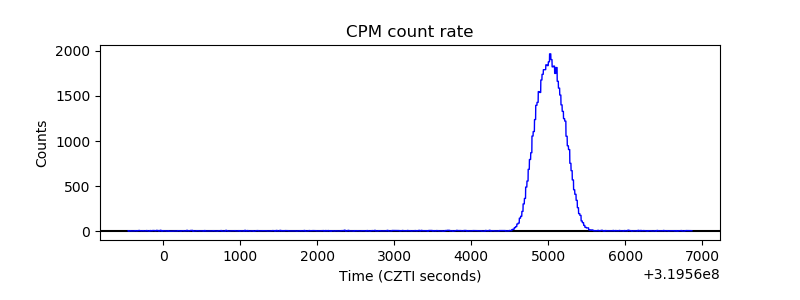 |
| CZT Counter | 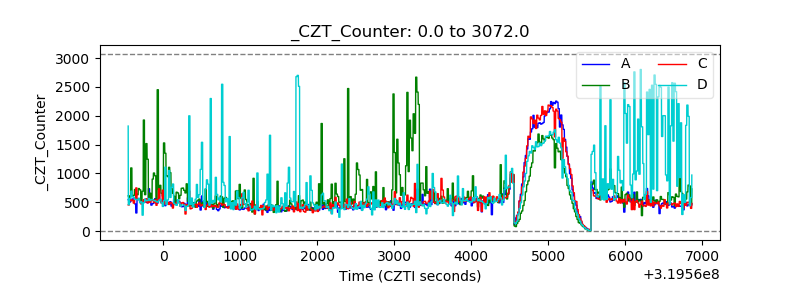 |
| +2.5 Volts monitor |  |
| +5 Volts monitor | 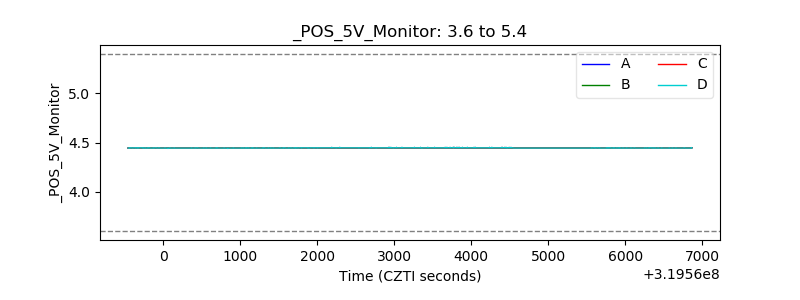 |
| _ROLL_ROT | 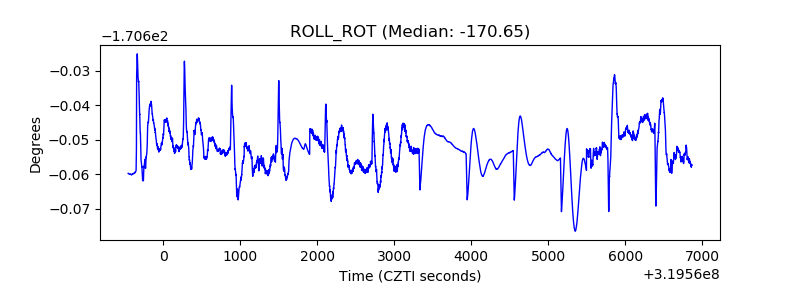 |
| _Roll_DEC | 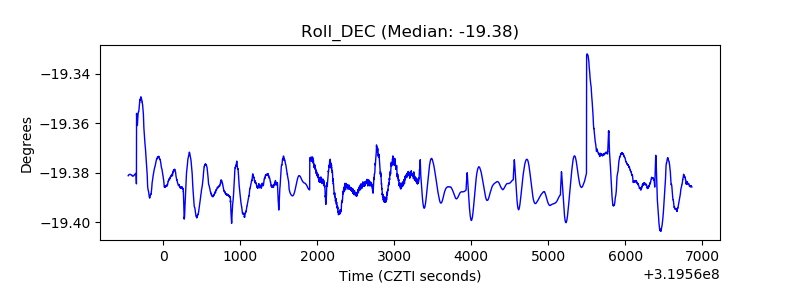 |
| _Roll_RA | 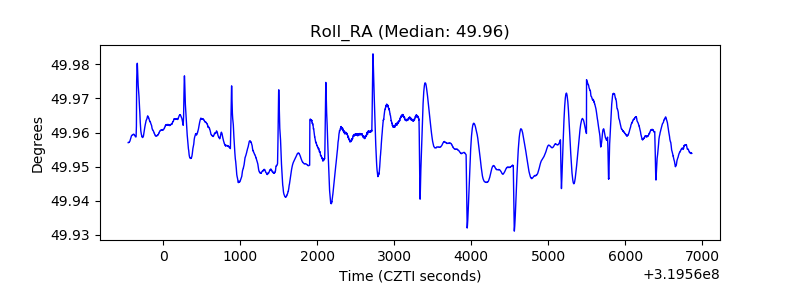 |
| Veto Counter | 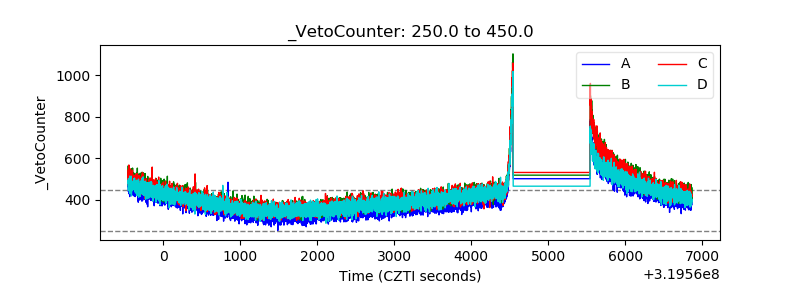 |