| Param | Original file | Final file |
|---|---|---|
| Filename | modeM0/AS1A07_027T05_9000003506_23721cztM0_level2.evt | modeM0/AS1A07_027T05_9000003506_23721cztM0_level2_quad_clean.evt |
| Size (bytes) | 155,370,240 | 30,836,160 |
| Size | 148.2 MB | 29.4 MB |
| Events in quadrant A | 762,892 | 216,571 |
| Events in quadrant B | 911,992 | 218,212 |
| Events in quadrant C | 758,176 | 209,239 |
| Events in quadrant D | 2,166,222 | 176,265 |
| Mode M0 | |||
|---|---|---|---|
| Quadrant | BADHDUFLAG | Total packets | Discarded packets |
| A | 0 | 3224 | 1 |
| B | 0 | 3693 | 1 |
| C | 0 | 3180 | 1 |
| D | 0 | 7499 | 1 |
| Mode SS | |||
|---|---|---|---|
| Quadrant | BADHDUFLAG | Total packets | Discarded packets |
| A | 0 | 32 | 0 |
| B | 0 | 32 | 0 |
| C | 0 | 32 | 0 |
| D | 0 | 32 | 0 |
| Quadrant | Total seconds | Saturated seconds | Saturation percentage |
|---|---|---|---|
| A | 1520 | 3 | 0.197368% |
| B | 1521 | 4 | 0.262985% |
| C | 1521 | 9 | 0.591716% |
| D | 1521 | 454 | 29.848784% |
Noise dominated data is calculated using 1-second bins in cleaned event files. If a bin has >2000 counts, and if more than 50% of those come from <1% of pixels, then it is considered to be noise-dominated and hence unusable.
| Quadrant | # 1 sec bins | Bins with >0 counts | Bins with >2000 counts | High rate bins dominated by noise | Noise dominated (total time) | Noise dominated (detector-on time) | Marked lightcurve |
|---|---|---|---|---|---|---|---|
| A | 1520 | 1520 | 0 | 0 | 0.00% | 0.00% | 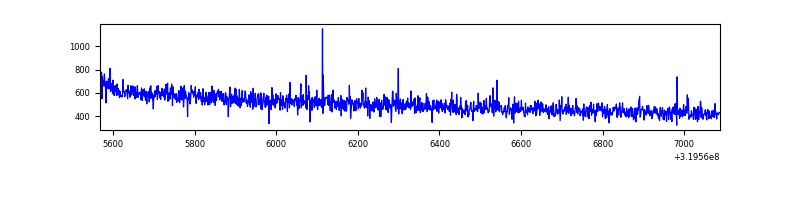 |
| B | 1521 | 1521 | 1 | 1 | 0.07% | 0.07% | 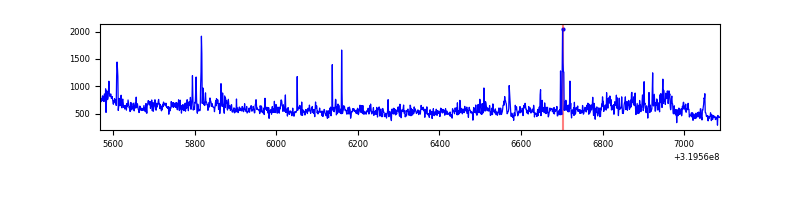 |
| C | 1521 | 1521 | 1 | 1 | 0.07% | 0.07% | 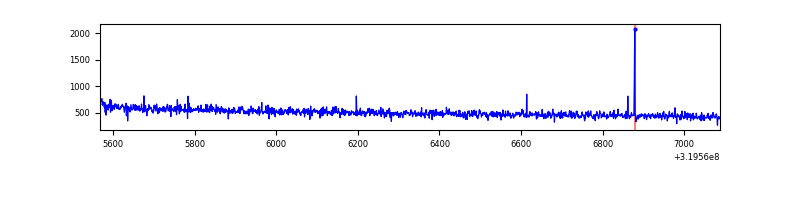 |
| D | 1521 | 1521 | 418 | 418 | 27.48% | 27.48% | 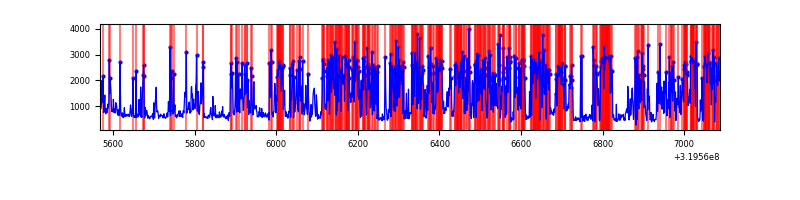 |
Top three noisy pixels from each quadrant. If the there are fewer than three noisy pixels in the level2.evt file, extra rows are filled as -1
| Pixel properties | Quadrant properties | ||||||
|---|---|---|---|---|---|---|---|
| Quadrant | DetID | PixID | Counts | Sigma | Mean | Median | Sigma |
| A | 13 | 254 | 2907 | 65.04 | 197 | 193 | 41.7 |
| A | 0 | 226 | 1691 | 35.9 | 197 | 193 | 41.7 |
| A | 3 | 137 | 1546 | 32.42 | 197 | 193 | 41.7 |
| B | 0 | 189 | 59514 | 1529.62 | 196 | 191 | 38.8 |
| B | 0 | 229 | 49255 | 1265.1 | 196 | 191 | 38.8 |
| B | 0 | 219 | 12037 | 305.44 | 196 | 191 | 38.8 |
| C | 14 | 238 | 29547 | 645.69 | 186 | 186 | 45.5 |
| C | 0 | 239 | 2726 | 55.86 | 186 | 186 | 45.5 |
| C | 13 | 61 | 1306 | 24.63 | 186 | 186 | 45.5 |
| D | 1 | 52 | 1012301 | 23305.34 | 169 | 163 | 43.4 |
| D | 7 | 238 | 231230 | 5320.52 | 169 | 163 | 43.4 |
| D | 12 | 233 | 226529 | 5212.27 | 169 | 163 | 43.4 |
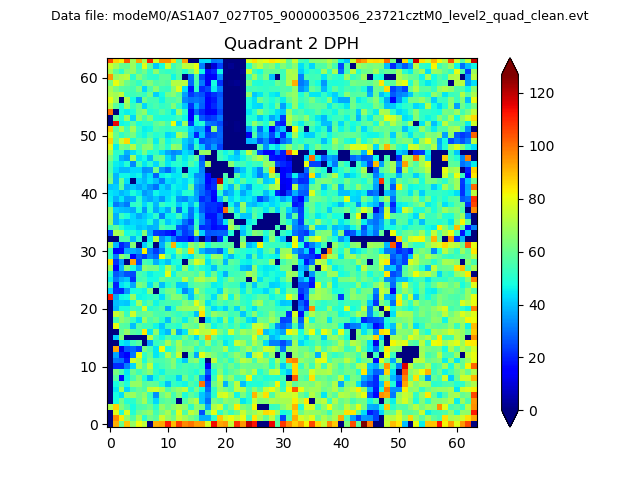
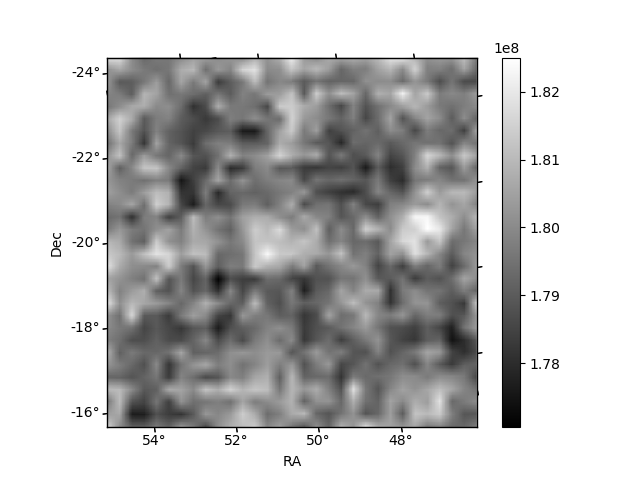
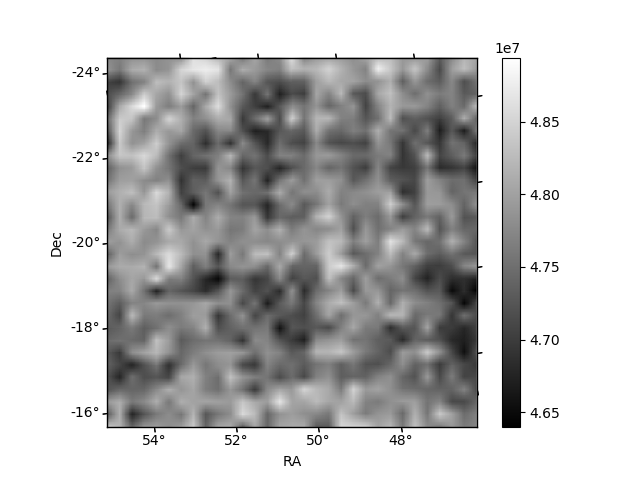
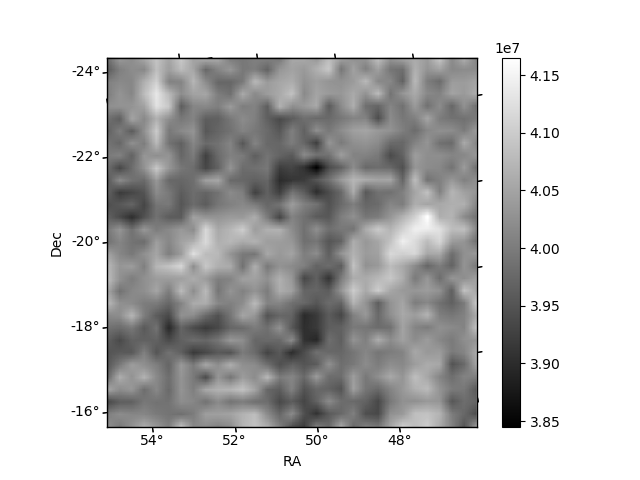
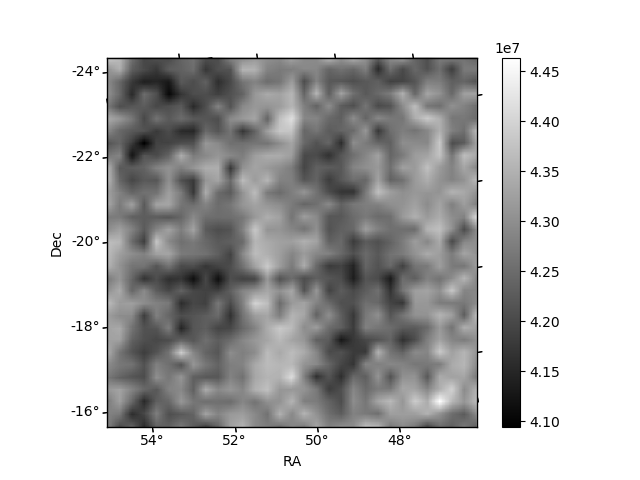
Histogram calculated using DETX and DETY for each event in the final _common_clean file
| Quadrant A | 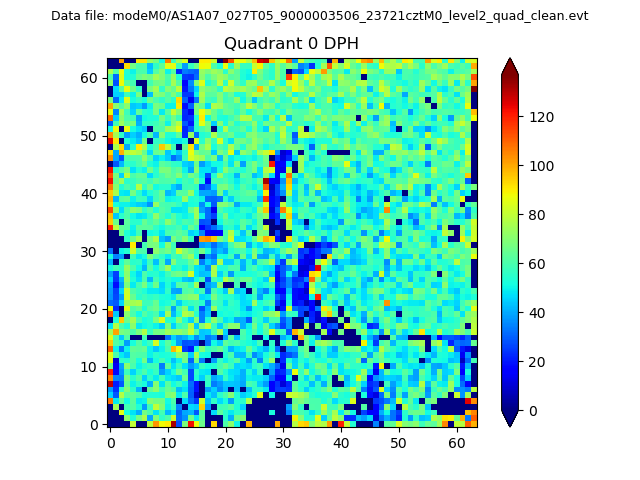 |
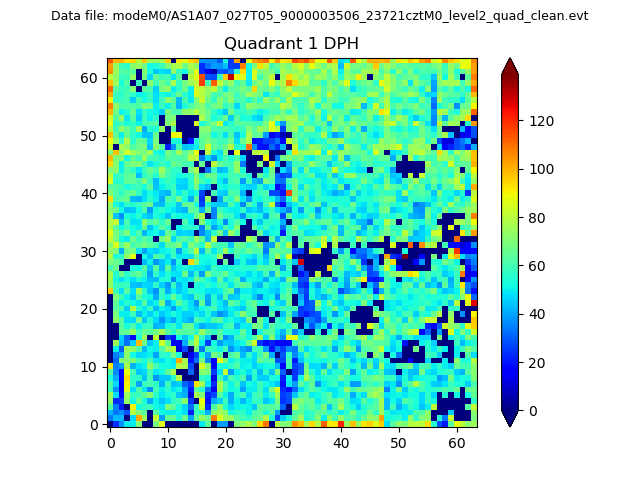 |
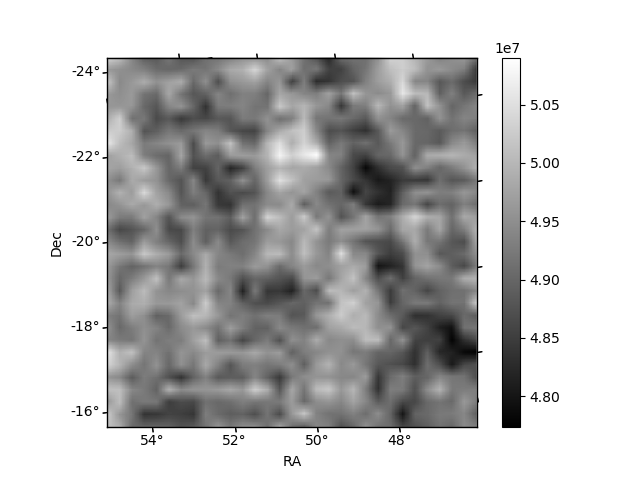
Quadrant B |
|---|---|---|---|
| Quadrant D | 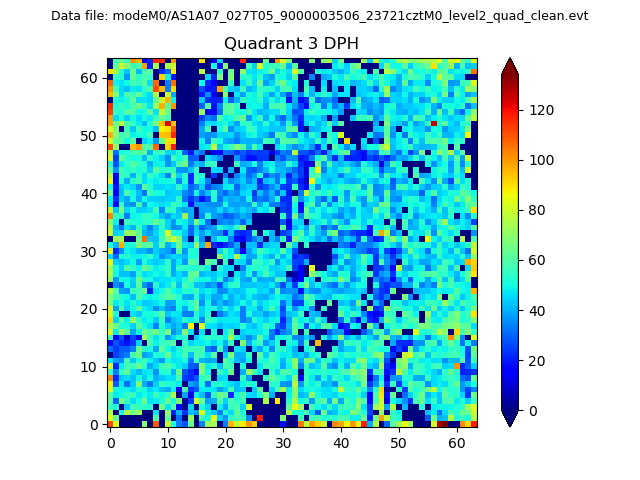 |
 |
Quadrant C |
| Plot type | Count rate plots | Images |
|---|---|---|
| Comparison with Poisson distribution Blue bars denote a histogram of data divided into 1 sec bins. Red curve is a Poisson curve with rate = median count rate of data. |
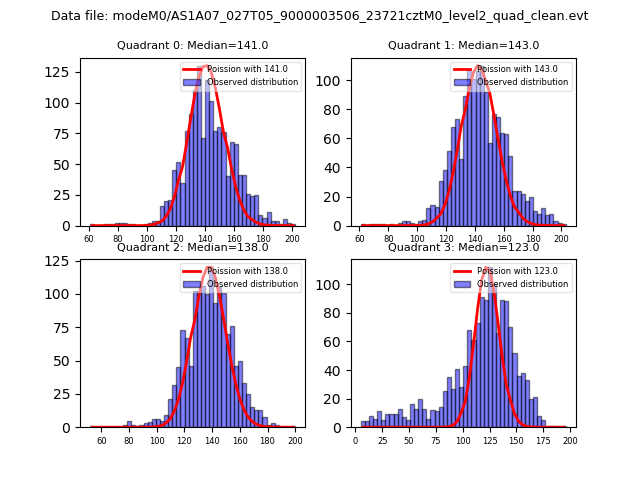 |
 |
| Quadrant-wise count rates Data is divided into 100 sec bins |
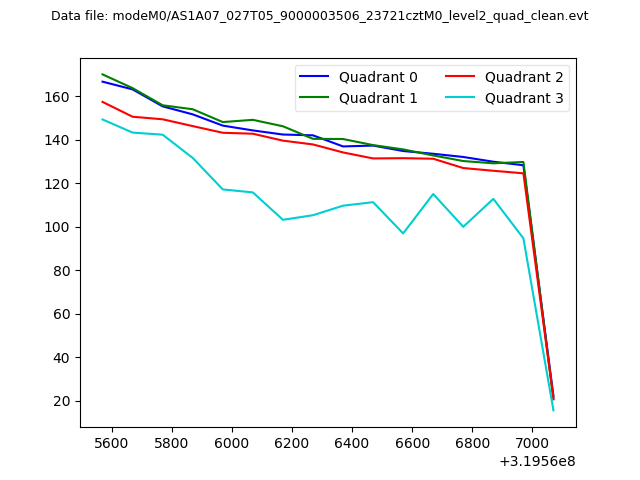 |
|
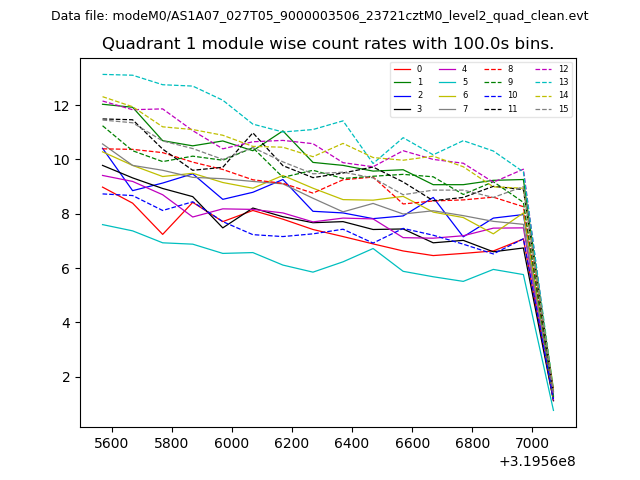
| Module-wise count rates for Quadrant A Data is divided into 100 sec bins |
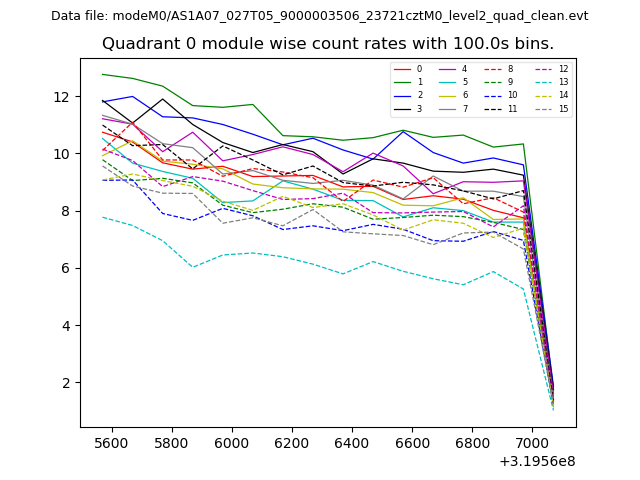 |
 |
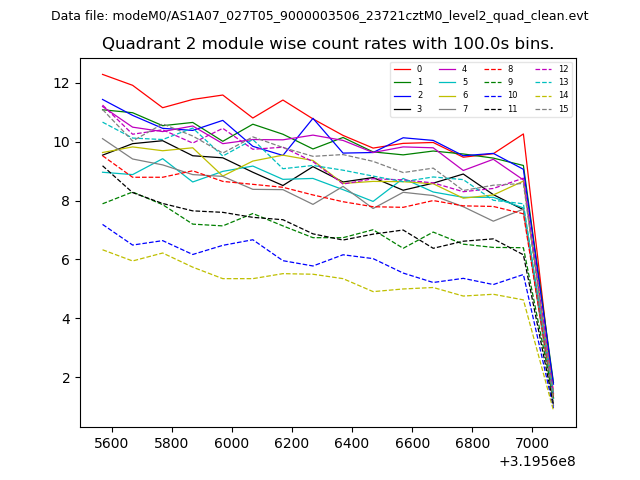
| Module-wise count rates for Quadrant B Data is divided into 100 sec bins |
 |
 |
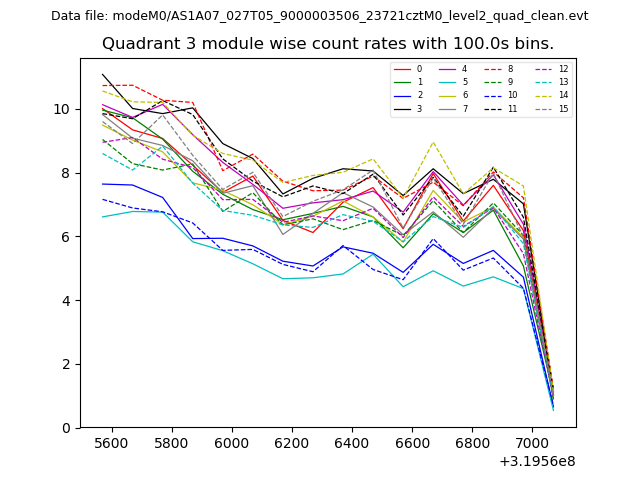
| Module-wise count rates for Quadrant C Data is divided into 100 sec bins |
 |
 |
| Module-wise count rates for Quadrant D Data is divided into 100 sec bins |
 |
 |
| Parameter | Plot |
|---|---|
| CZT HV Monitor | 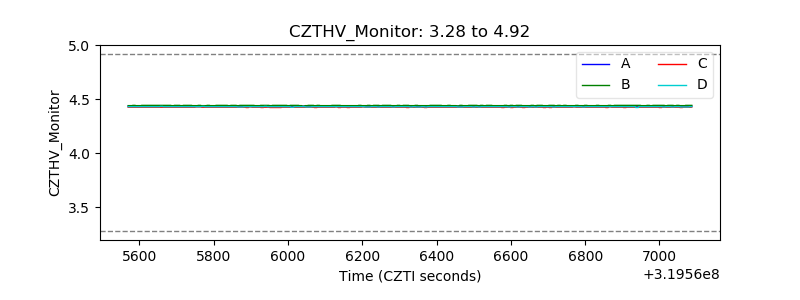 |
| D_VDD | 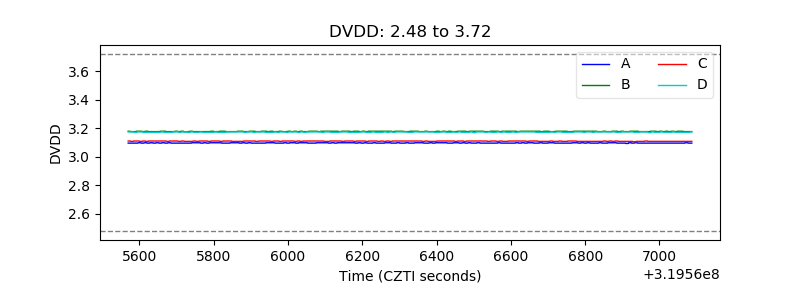 |
| Temperature 1 |  |
| Veto HV Monitor | 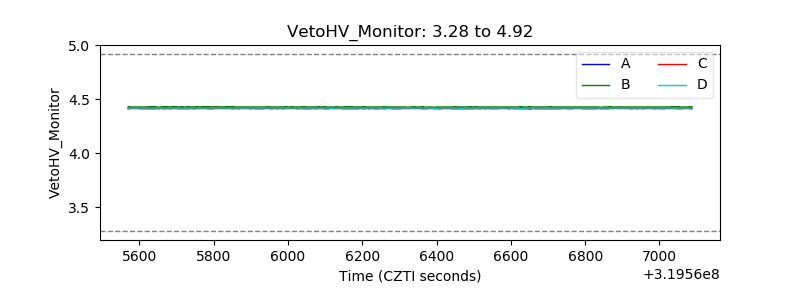 |
| Veto LLD | 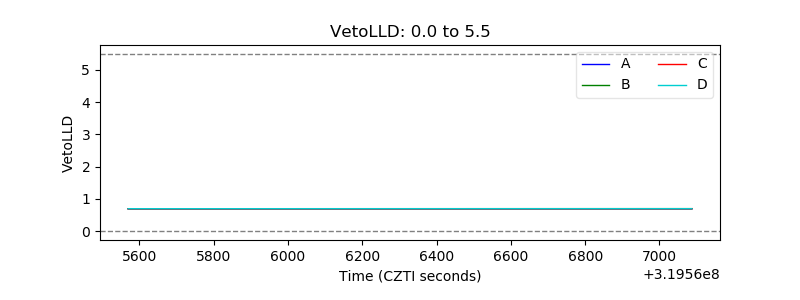 |
| Alpha Counter | 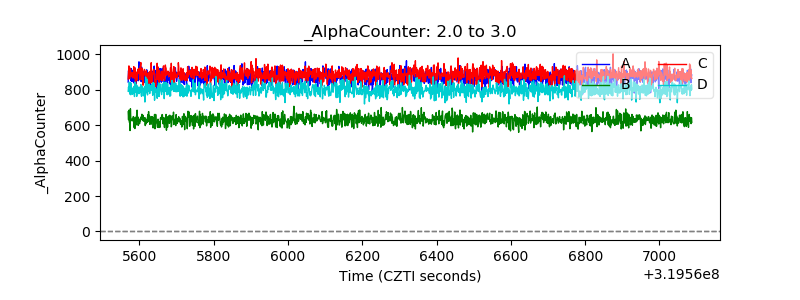 |
| _CPM_Rate | 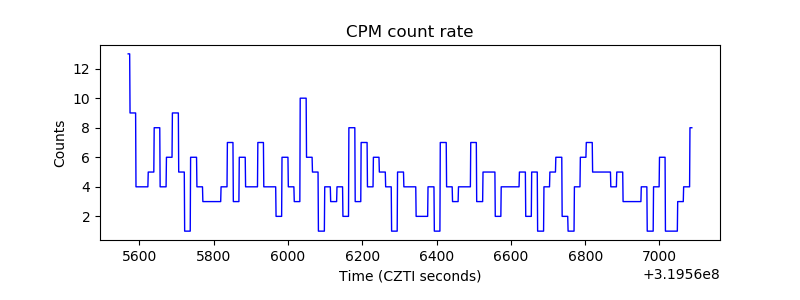 |
| CZT Counter | 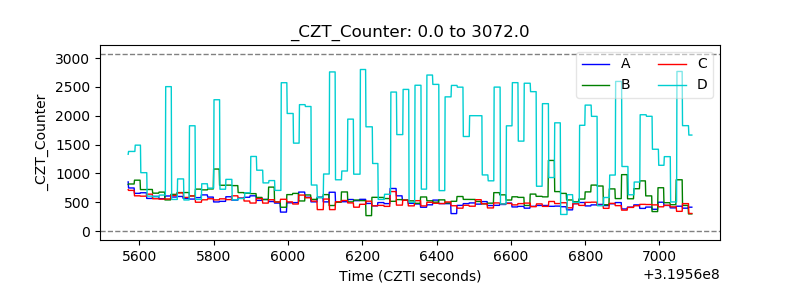 |
| +2.5 Volts monitor |  |
| +5 Volts monitor |  |
| _ROLL_ROT | 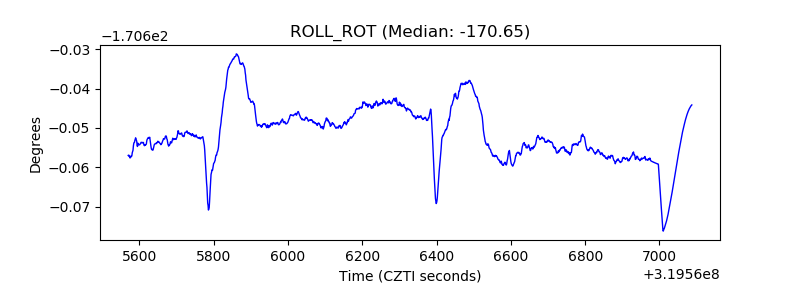 |
| _Roll_DEC | 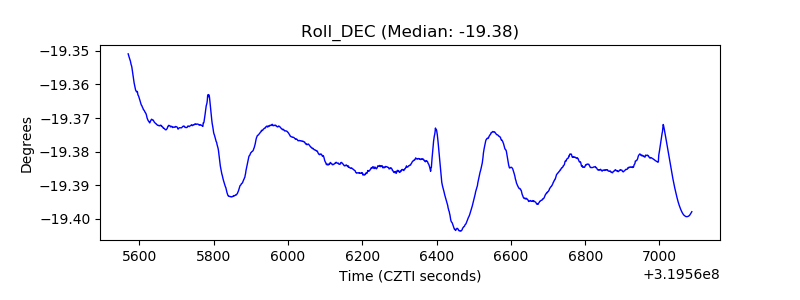 |
| _Roll_RA | 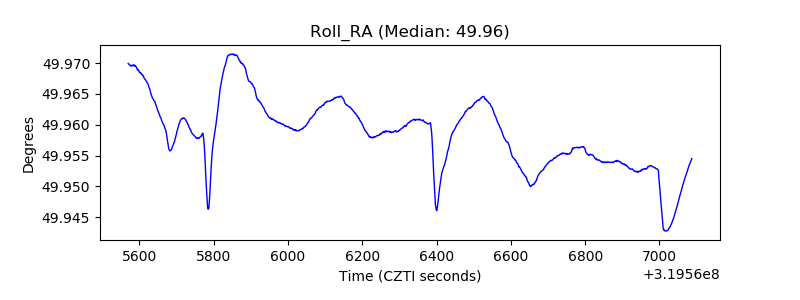 |
| Veto Counter | 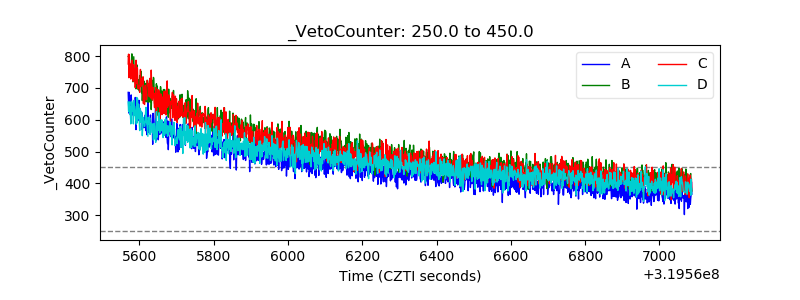 |