| Param | Original file | Final file |
|---|---|---|
| Filename | modeM0/AS1A07_027T06_9000003508cztM0_level2.fits | modeM0/AS1A07_027T06_9000003508cztM0_level2_quad_clean.evt |
| Size (bytes) | 398,335,680 | 240,647,040 |
| Size | 379.9 MB | 229.5 MB |
| Events in quadrant A | 2,490,780 | 1,199,545 |
| Events in quadrant B | 2,370,026 | 1,197,671 |
| Events in quadrant C | 2,438,120 | 1,165,854 |
| Events in quadrant D | 2,092,704 | 1,049,904 |
| Mode SS | |||
|---|---|---|---|
| Quadrant | BADHDUFLAG | Total packets | Discarded packets |
| A | 0 | 790 | 0 |
| B | 0 | 790 | 0 |
| C | 0 | 790 | 0 |
| D | 0 | 790 | 0 |
| Mode M9 | |||
|---|---|---|---|
| Quadrant | BADHDUFLAG | Total packets | Discarded packets |
| A | 0 | 81 | 0 |
| B | 0 | 81 | 0 |
| C | 0 | 81 | 0 |
| D | 0 | 81 | 0 |
| Mode M0 | |||
|---|---|---|---|
| Quadrant | BADHDUFLAG | Total packets | Discarded packets |
| A | 0 | 80712 | 0 |
| B | 0 | 91865 | 0 |
| C | 0 | 83096 | 0 |
| D | 0 | 101244 | 0 |
| Quadrant | Total seconds | Saturated seconds | Saturation percentage |
|---|---|---|---|
| A | 38921 | 248 | 0.637188% |
| B | 38921 | 929 | 2.386886% |
| C | 38921 | 586 | 1.505614% |
| D | 38921 | 1173 | 3.013797% |
Noise dominated data is calculated using 1-second bins in cleaned event files. If a bin has >2000 counts, and if more than 50% of those come from <1% of pixels, then it is considered to be noise-dominated and hence unusable.
| Quadrant | # 1 sec bins | Bins with >0 counts | Bins with >2000 counts | High rate bins dominated by noise | Noise dominated (total time) | Noise dominated (detector-on time) | Marked lightcurve |
|---|---|---|---|---|---|---|---|
| A | 46951 | 38918 | 0 | 0 | 0.00% | 0.00% |  |
| B | 46951 | 38886 | 0 | 0 | 0.00% | 0.00% |  |
| C | 46951 | 38918 | 0 | 0 | 0.00% | 0.00% |  |
| D | 46951 | 38913 | 0 | 0 | 0.00% | 0.00% |  |
Top three noisy pixels from each quadrant. If the there are fewer than three noisy pixels in the level2.evt file, extra rows are filled as -1
| Pixel properties | Quadrant properties | ||||||
|---|---|---|---|---|---|---|---|
| Quadrant | DetID | PixID | Counts | Sigma | Mean | Median | Sigma |
| A | 0 | 29 | 2362 | 11.11 | 647 | 610 | 157.7 |
| A | 7 | 110 | 2040 | 9.07 | 647 | 610 | 157.7 |
| A | 0 | 30 | 1880 | 8.05 | 647 | 610 | 157.7 |
| B | 2 | 9 | 1841 | 9.99 | 628 | 600 | 124.2 |
| B | 5 | 128 | 1612 | 8.15 | 628 | 600 | 124.2 |
| B | 3 | 17 | 1524 | 7.44 | 628 | 600 | 124.2 |
| C | 1 | 80 | 1897 | 7.89 | 643 | 603 | 164.0 |
| C | 1 | 81 | 1895 | 7.88 | 643 | 603 | 164.0 |
| C | 12 | 241 | 1732 | 6.89 | 643 | 603 | 164.0 |
| D | 4 | 246 | 1586 | 6.52 | 596 | 543 | 159.9 |
| D | 6 | 231 | 1561 | 6.37 | 596 | 543 | 159.9 |
| D | 3 | 14 | 1536 | 6.21 | 596 | 543 | 159.9 |
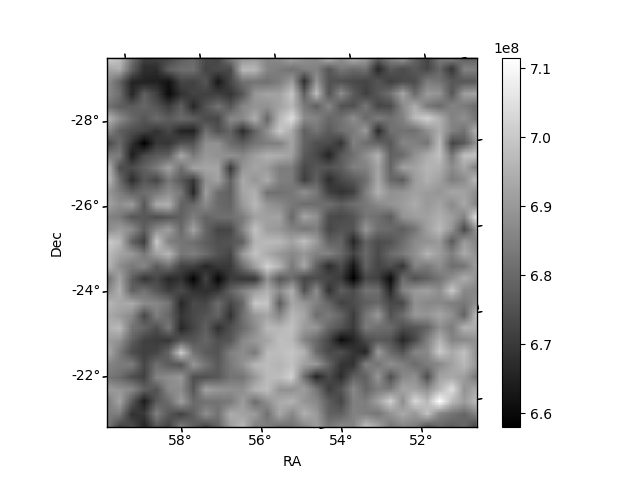
Histogram calculated using DETX and DETY for each event in the final _common_clean file
| Quadrant A |  |
 |
Quadrant B |
|---|---|---|---|
| Quadrant D |  |
 |
Quadrant C |
| Plot type | Count rate plots | Images |
|---|---|---|
| Comparison with Poisson distribution Blue bars denote a histogram of data divided into 1 sec bins. Red curve is a Poisson curve with rate = median count rate of data. |
 |
 |
| Quadrant-wise count rates Data is divided into 100 sec bins |
 |
|
| Module-wise count rates for Quadrant A Data is divided into 100 sec bins |
 |
 |
| Module-wise count rates for Quadrant B Data is divided into 100 sec bins |
 |
 |
| Module-wise count rates for Quadrant C Data is divided into 100 sec bins |
 |
 |
| Module-wise count rates for Quadrant D Data is divided into 100 sec bins |
 |
 |
| Parameter | Plot |
|---|---|
| CZT HV Monitor |  |
| D_VDD |  |
| Temperature 1 |  |
| Veto HV Monitor |  |
| Veto LLD |  |
| Alpha Counter |  |
| _CPM_Rate |  |
| CZT Counter |  |
| +2.5 Volts monitor |  |
| +5 Volts monitor | 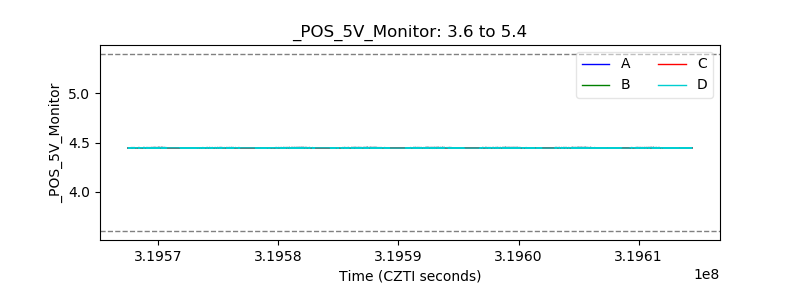 |
| _ROLL_ROT |  |
| _Roll_DEC |  |
| _Roll_RA |  |
| Veto Counter |  |