| Param | Original file | Final file |
|---|---|---|
| Filename | modeM0/AS1A07_027T06_9000003508_23721cztM0_level2.evt | modeM0/AS1A07_027T06_9000003508_23721cztM0_level2_quad_clean.evt |
| Size (bytes) | 332,936,640 | 51,030,720 |
| Size | 317.5 MB | 48.7 MB |
| Events in quadrant A | 2,148,718 | 315,284 |
| Events in quadrant B | 2,409,669 | 321,243 |
| Events in quadrant C | 2,197,202 | 309,530 |
| Events in quadrant D | 3,027,564 | 289,231 |
| Mode SS | |||
|---|---|---|---|
| Quadrant | BADHDUFLAG | Total packets | Discarded packets |
| A | 0 | 88 | 0 |
| B | 0 | 88 | 0 |
| C | 0 | 88 | 0 |
| D | 0 | 88 | 0 |
| Mode M9 | |||
|---|---|---|---|
| Quadrant | BADHDUFLAG | Total packets | Discarded packets |
| A | 0 | 12 | 0 |
| B | 0 | 12 | 0 |
| C | 0 | 12 | 0 |
| D | 0 | 12 | 0 |
| Mode M0 | |||
|---|---|---|---|
| Quadrant | BADHDUFLAG | Total packets | Discarded packets |
| A | 0 | 9229 | 1 |
| B | 0 | 9989 | 1 |
| C | 0 | 9279 | 1 |
| D | 0 | 11937 | 1 |
| Quadrant | Total seconds | Saturated seconds | Saturation percentage |
|---|---|---|---|
| A | 4409 | 17 | 0.385575% |
| B | 4408 | 46 | 1.043557% |
| C | 4408 | 48 | 1.088929% |
| D | 4408 | 177 | 4.015426% |
Noise dominated data is calculated using 1-second bins in cleaned event files. If a bin has >2000 counts, and if more than 50% of those come from <1% of pixels, then it is considered to be noise-dominated and hence unusable.
| Quadrant | # 1 sec bins | Bins with >0 counts | Bins with >2000 counts | High rate bins dominated by noise | Noise dominated (total time) | Noise dominated (detector-on time) | Marked lightcurve |
|---|---|---|---|---|---|---|---|
| A | 5554 | 4410 | 1 | 1 | 0.02% | 0.02% | 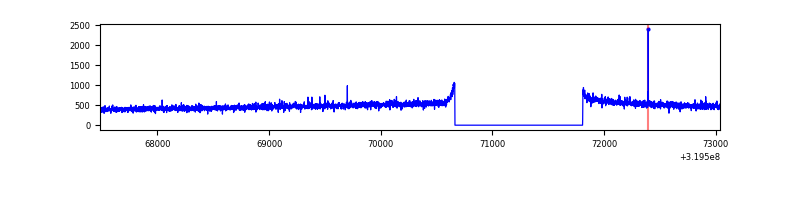 |
| B | 5553 | 4408 | 5 | 5 | 0.09% | 0.11% | 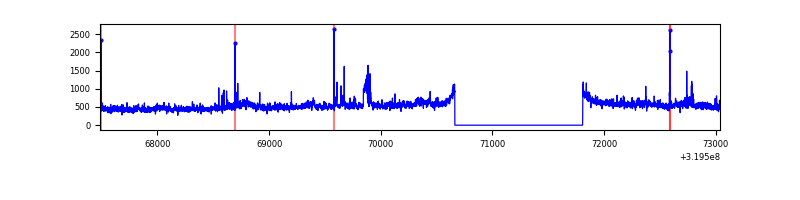 |
| C | 5553 | 4409 | 1 | 1 | 0.02% | 0.02% | 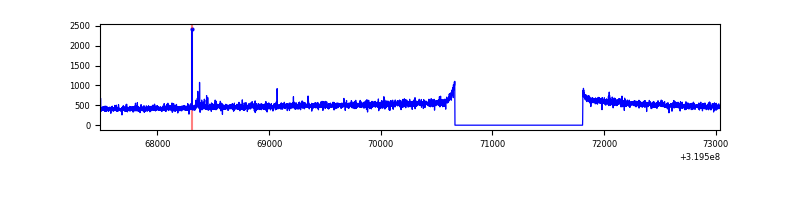 |
| D | 5553 | 4409 | 162 | 162 | 2.92% | 3.67% | 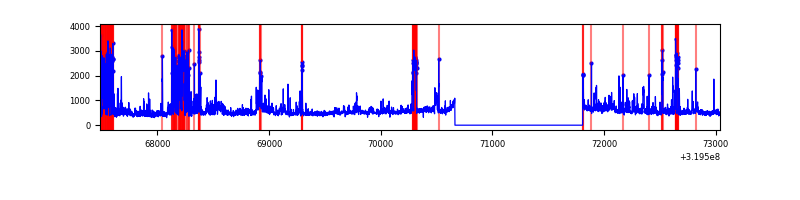 |
Top three noisy pixels from each quadrant. If the there are fewer than three noisy pixels in the level2.evt file, extra rows are filled as -1
| Pixel properties | Quadrant properties | ||||||
|---|---|---|---|---|---|---|---|
| Quadrant | DetID | PixID | Counts | Sigma | Mean | Median | Sigma |
| A | 13 | 254 | 7560 | 61.93 | 556 | 544 | 113.3 |
| A | 0 | 226 | 4850 | 38.01 | 556 | 544 | 113.3 |
| A | 3 | 137 | 4808 | 37.64 | 556 | 544 | 113.3 |
| B | 0 | 229 | 148708 | 1377.11 | 559 | 547 | 107.6 |
| B | 0 | 189 | 44361 | 407.24 | 559 | 547 | 107.6 |
| B | 0 | 219 | 20001 | 180.82 | 559 | 547 | 107.6 |
| C | 14 | 238 | 85805 | 676.23 | 536 | 540 | 126.1 |
| C | 7 | 247 | 17734 | 136.36 | 536 | 540 | 126.1 |
| C | 13 | 61 | 3803 | 25.88 | 536 | 540 | 126.1 |
| D | 1 | 52 | 782511 | 5998.57 | 530 | 513 | 130.4 |
| D | 13 | 174 | 171005 | 1307.81 | 530 | 513 | 130.4 |
| D | 12 | 233 | 32674 | 246.7 | 530 | 513 | 130.4 |
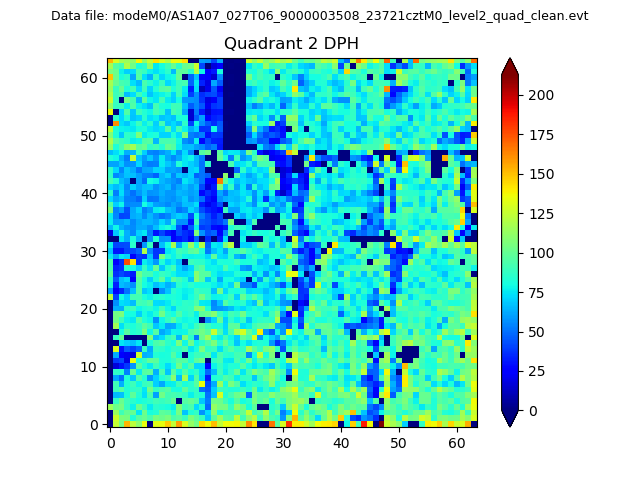
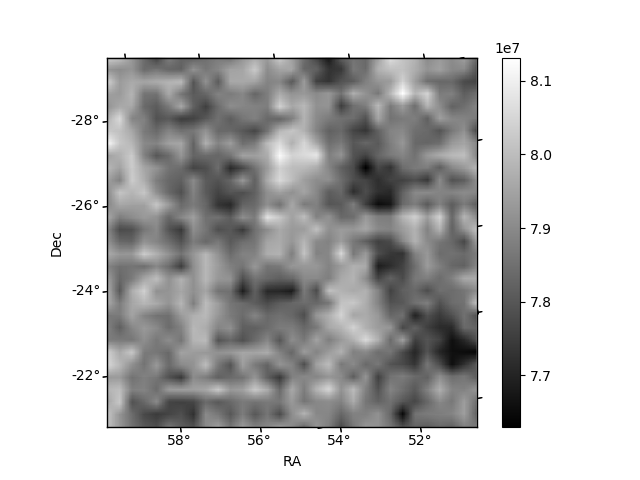
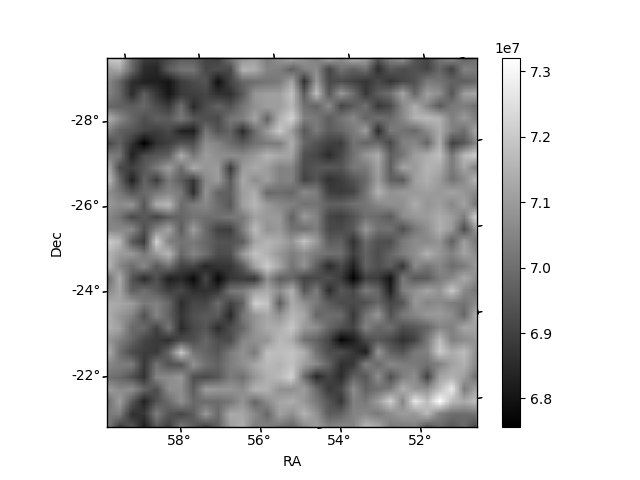
Histogram calculated using DETX and DETY for each event in the final _common_clean file
| Quadrant A | 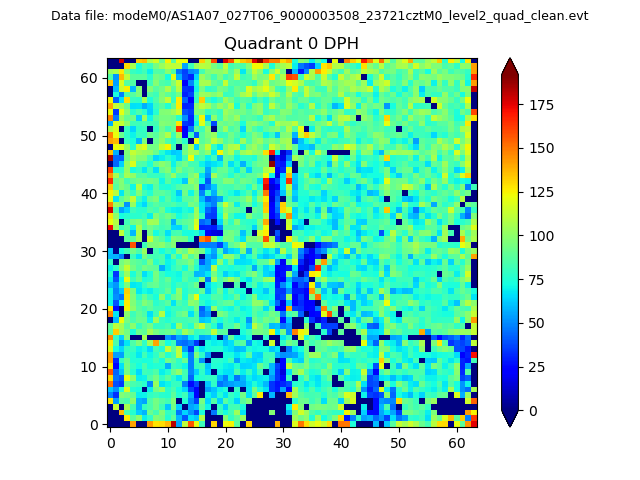 |
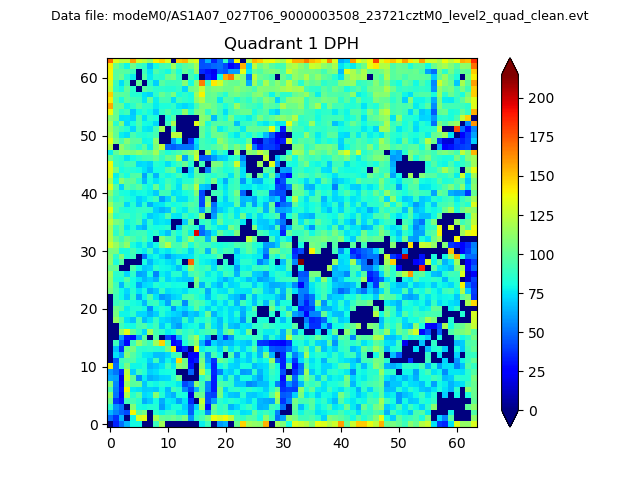 |
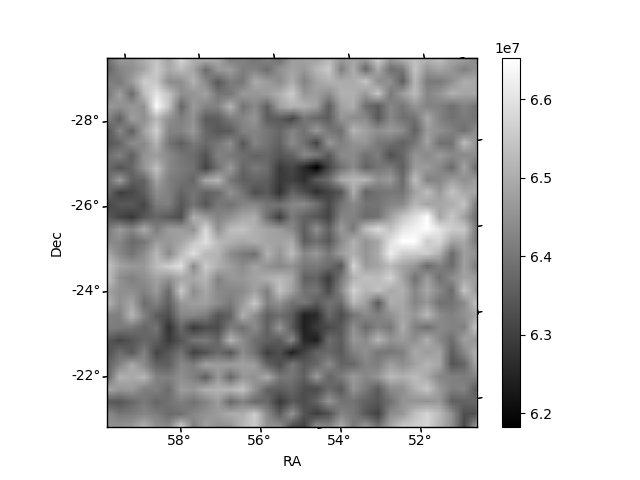
Quadrant B |
|---|---|---|---|
| Quadrant D | 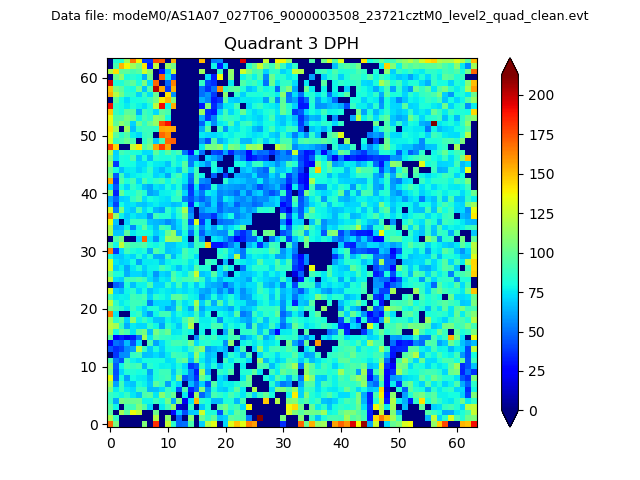 |
 |
Quadrant C |
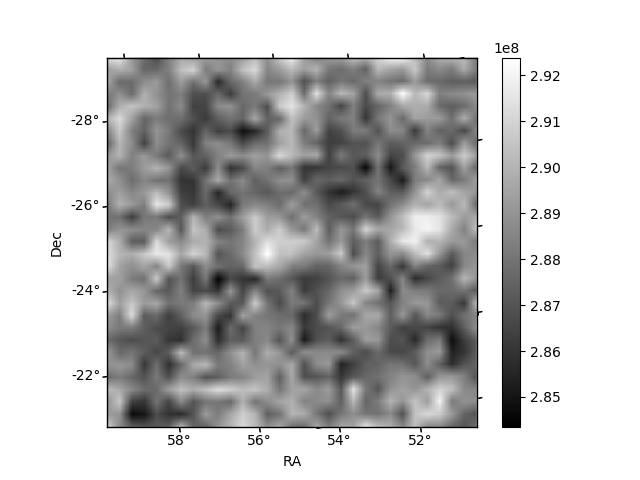
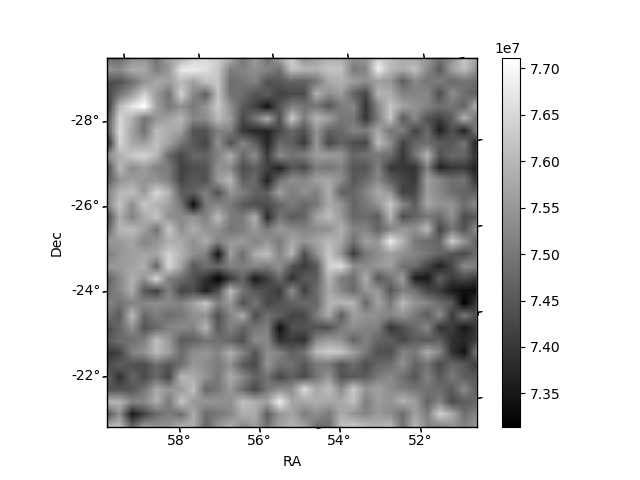
| Plot type | Count rate plots | Images |
|---|---|---|
| Comparison with Poisson distribution Blue bars denote a histogram of data divided into 1 sec bins. Red curve is a Poisson curve with rate = median count rate of data. |
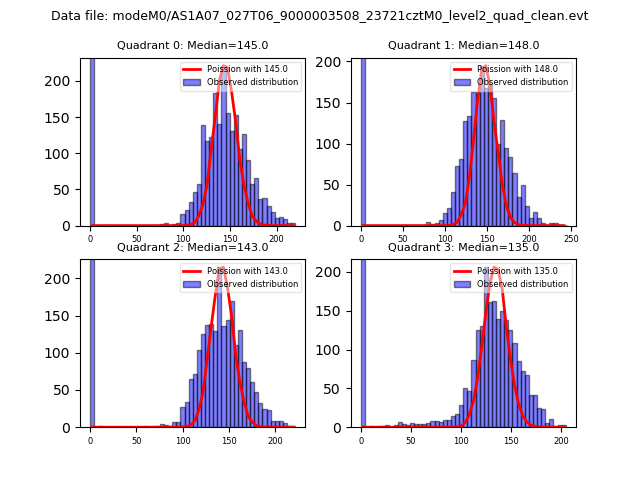 |
 |
| Quadrant-wise count rates Data is divided into 100 sec bins |
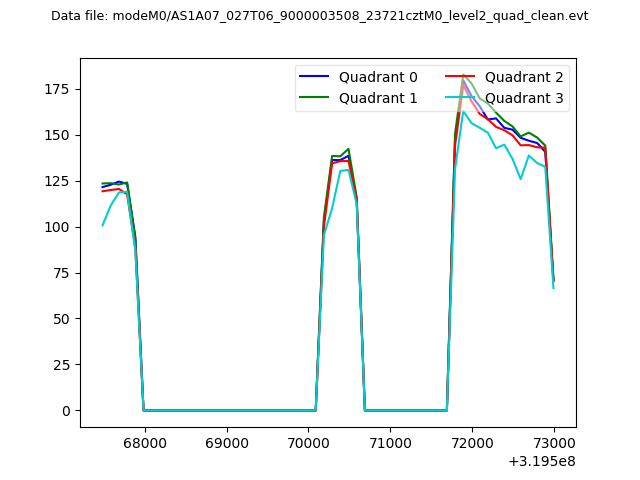 |
|
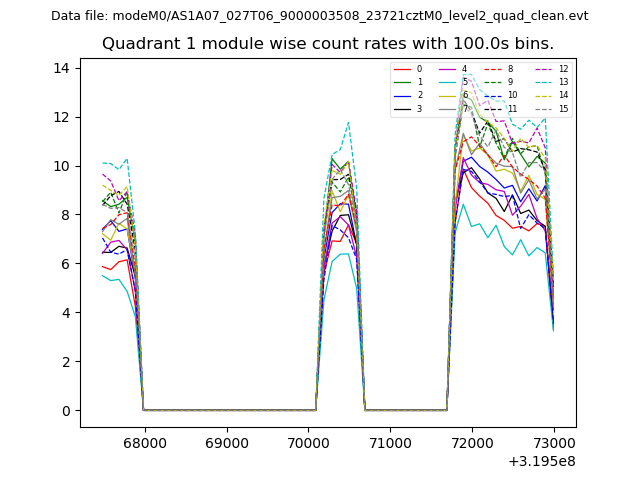
| Module-wise count rates for Quadrant A Data is divided into 100 sec bins |
 |
 |
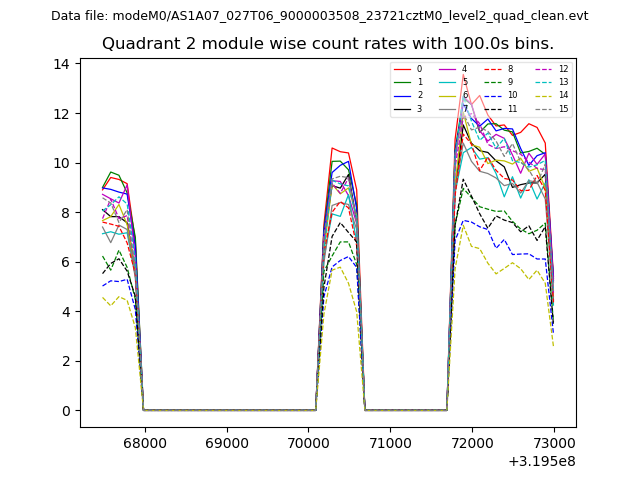
| Module-wise count rates for Quadrant B Data is divided into 100 sec bins |
 |
 |
| Module-wise count rates for Quadrant C Data is divided into 100 sec bins |
 |
 |
| Module-wise count rates for Quadrant D Data is divided into 100 sec bins |
 |
 |
| Parameter | Plot |
|---|---|
| CZT HV Monitor | 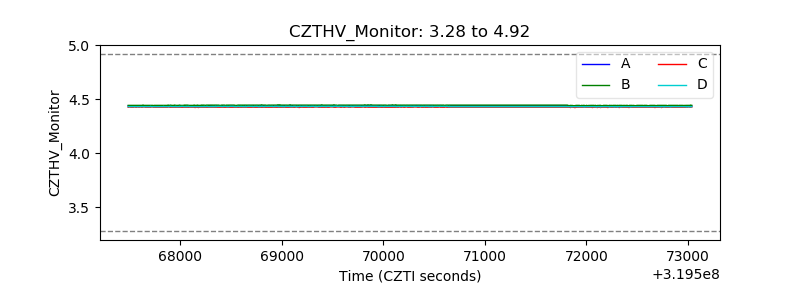 |
| D_VDD | 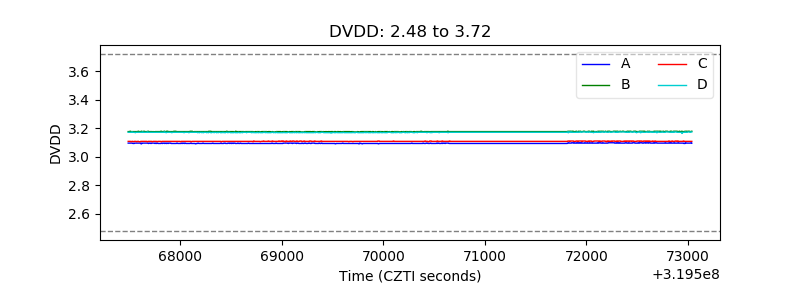 |
| Temperature 1 | 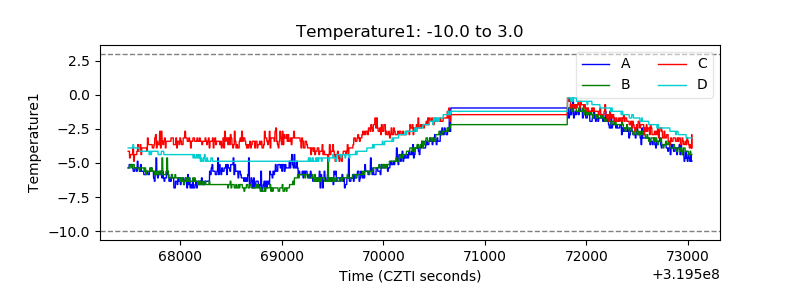 |
| Veto HV Monitor | 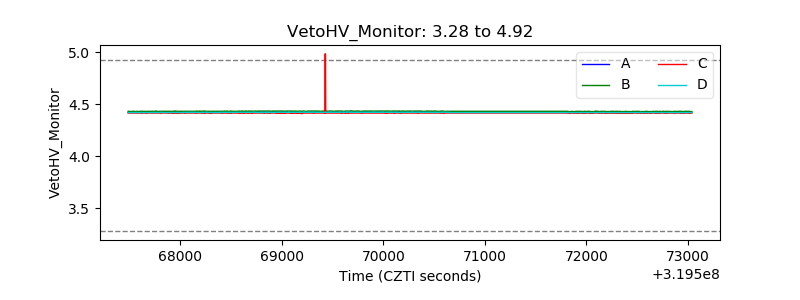 |
| Veto LLD | 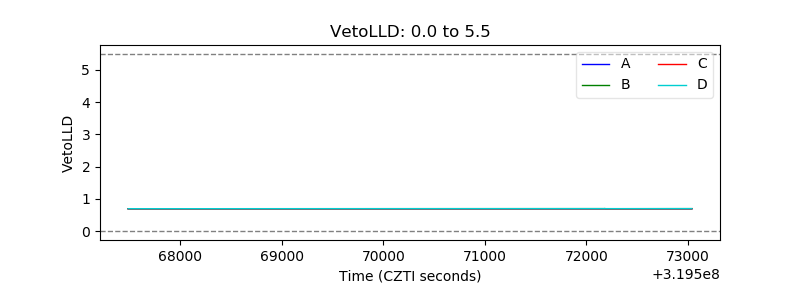 |
| Alpha Counter | 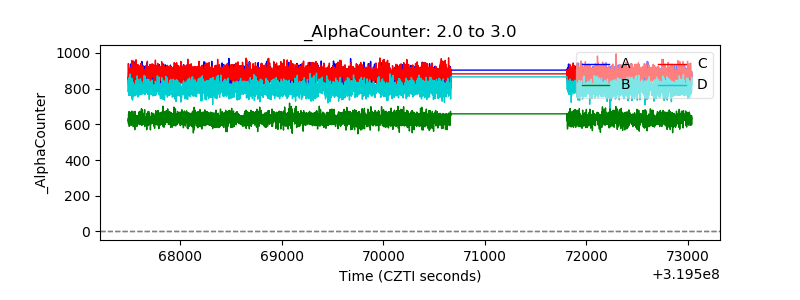 |
| _CPM_Rate | 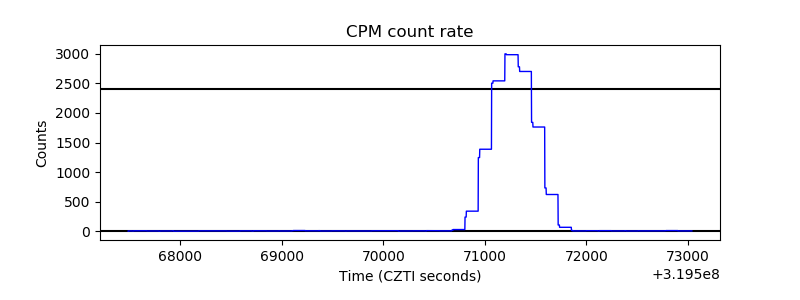 |
| CZT Counter | 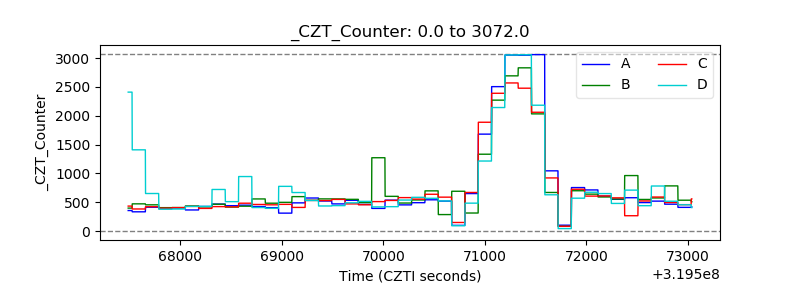 |
| +2.5 Volts monitor | 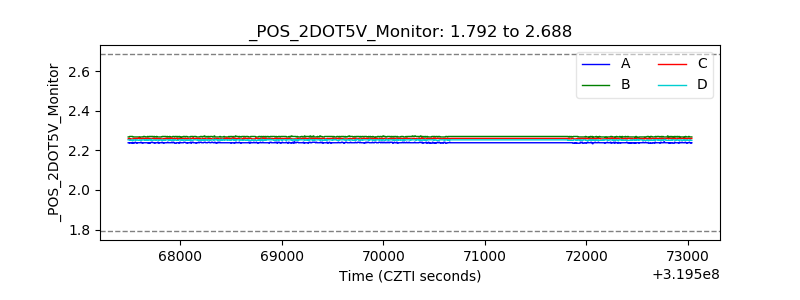 |
| +5 Volts monitor |  |
| _ROLL_ROT |  |
| _Roll_DEC | 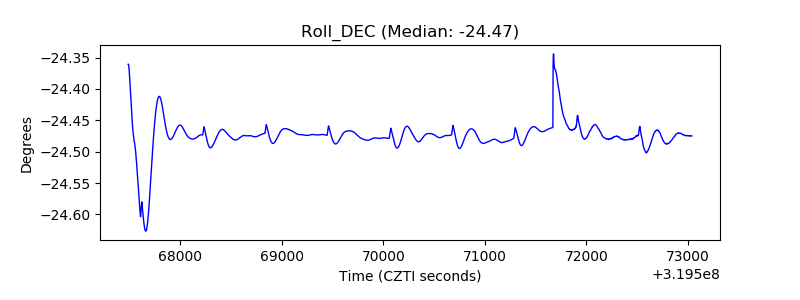 |
| _Roll_RA | 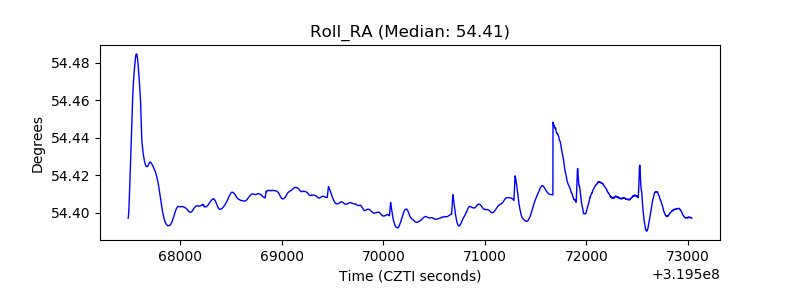 |
| Veto Counter | 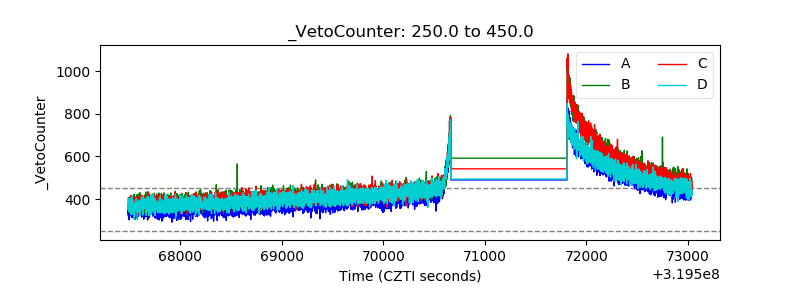 |