| Param | Original file | Final file |
|---|---|---|
| Filename | modeM0/AS1A07_027T06_9000003508_23722cztM0_level2.evt | modeM0/AS1A07_027T06_9000003508_23722cztM0_level2_quad_clean.evt |
| Size (bytes) | 477,172,800 | 95,068,800 |
| Size | 455.1 MB | 90.7 MB |
| Events in quadrant A | 3,187,134 | 620,094 |
| Events in quadrant B | 3,586,736 | 633,361 |
| Events in quadrant C | 3,242,998 | 608,993 |
| Events in quadrant D | 4,005,166 | 575,417 |
| Mode SS | |||
|---|---|---|---|
| Quadrant | BADHDUFLAG | Total packets | Discarded packets |
| A | 0 | 128 | 0 |
| B | 0 | 128 | 0 |
| C | 0 | 128 | 0 |
| D | 0 | 128 | 0 |
| Mode M9 | |||
|---|---|---|---|
| Quadrant | BADHDUFLAG | Total packets | Discarded packets |
| A | 0 | 14 | 0 |
| B | 0 | 15 | 0 |
| C | 0 | 15 | 0 |
| D | 0 | 15 | 0 |
| Mode M0 | |||
|---|---|---|---|
| Quadrant | BADHDUFLAG | Total packets | Discarded packets |
| A | 0 | 13409 | 2 |
| B | 0 | 14599 | 2 |
| C | 0 | 13474 | 2 |
| D | 0 | 15927 | 2 |
| Quadrant | Total seconds | Saturated seconds | Saturation percentage |
|---|---|---|---|
| A | 6323 | 47 | 0.743318% |
| B | 6323 | 70 | 1.107069% |
| C | 6323 | 85 | 1.344299% |
| D | 6323 | 127 | 2.008540% |
Noise dominated data is calculated using 1-second bins in cleaned event files. If a bin has >2000 counts, and if more than 50% of those come from <1% of pixels, then it is considered to be noise-dominated and hence unusable.
| Quadrant | # 1 sec bins | Bins with >0 counts | Bins with >2000 counts | High rate bins dominated by noise | Noise dominated (total time) | Noise dominated (detector-on time) | Marked lightcurve |
|---|---|---|---|---|---|---|---|
| A | 7558 | 6323 | 1 | 1 | 0.01% | 0.02% | 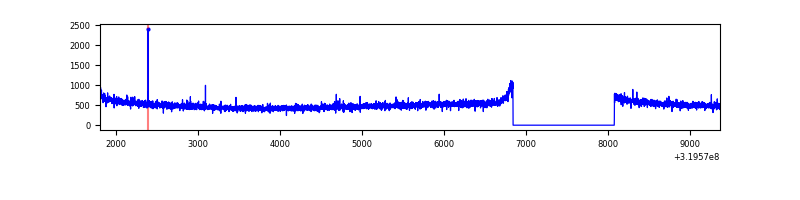 |
| B | 7558 | 6323 | 6 | 6 | 0.08% | 0.09% | 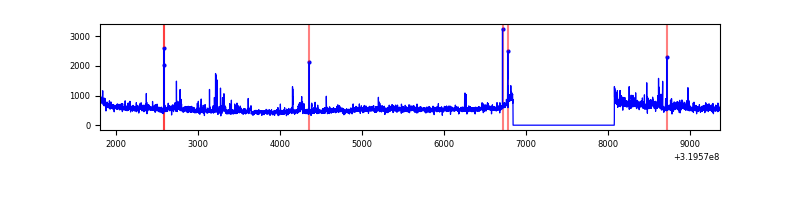 |
| C | 7558 | 6323 | 1 | 1 | 0.01% | 0.02% | 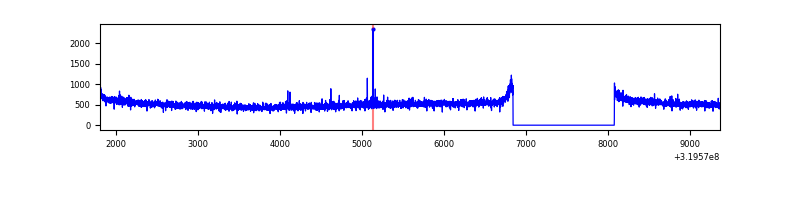 |
| D | 7558 | 6323 | 84 | 84 | 1.11% | 1.33% | 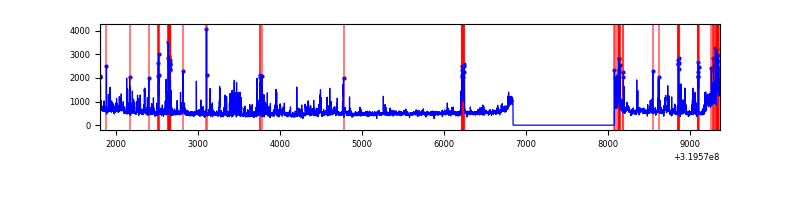 |
Top three noisy pixels from each quadrant. If the there are fewer than three noisy pixels in the level2.evt file, extra rows are filled as -1
| Pixel properties | Quadrant properties | ||||||
|---|---|---|---|---|---|---|---|
| Quadrant | DetID | PixID | Counts | Sigma | Mean | Median | Sigma |
| A | 13 | 254 | 11999 | 67.28 | 824 | 808 | 166.3 |
| A | 0 | 226 | 7201 | 38.44 | 824 | 808 | 166.3 |
| A | 3 | 137 | 6783 | 35.92 | 824 | 808 | 166.3 |
| B | 0 | 229 | 198852 | 1269.0 | 828 | 810 | 156.1 |
| B | 0 | 189 | 105868 | 673.18 | 828 | 810 | 156.1 |
| B | 12 | 111 | 18071 | 110.6 | 828 | 810 | 156.1 |
| C | 14 | 238 | 126926 | 682.27 | 791 | 799 | 184.9 |
| C | 7 | 247 | 30687 | 161.67 | 791 | 799 | 184.9 |
| C | 13 | 61 | 5585 | 25.89 | 791 | 799 | 184.9 |
| D | 1 | 52 | 413997 | 2171.74 | 786 | 763 | 190.3 |
| D | 13 | 174 | 206712 | 1082.36 | 786 | 763 | 190.3 |
| D | 7 | 238 | 203950 | 1067.84 | 786 | 763 | 190.3 |
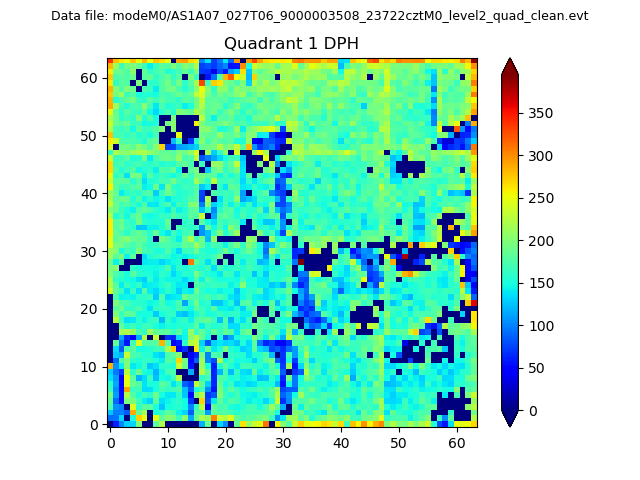
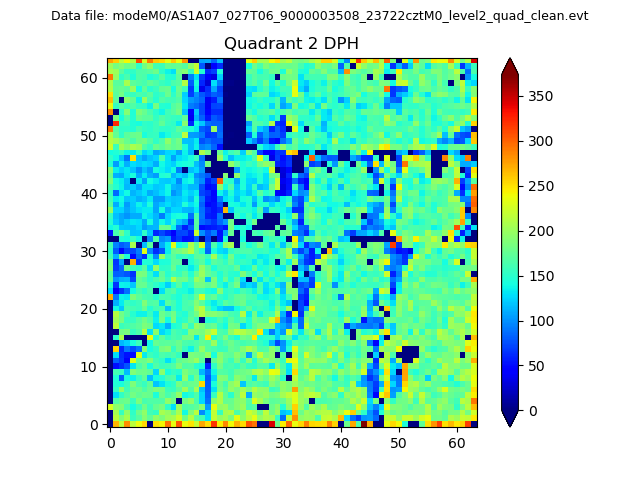
Histogram calculated using DETX and DETY for each event in the final _common_clean file
| Quadrant A |  |
 |
Quadrant B |
|---|---|---|---|
| Quadrant D | 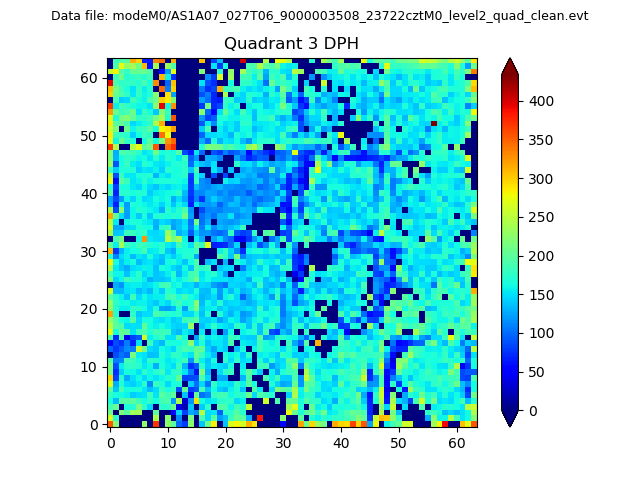 |
 |
Quadrant C |
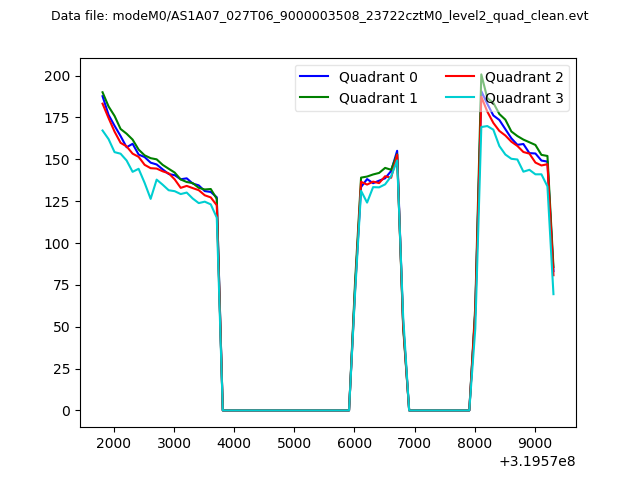
| Plot type | Count rate plots | Images |
|---|---|---|
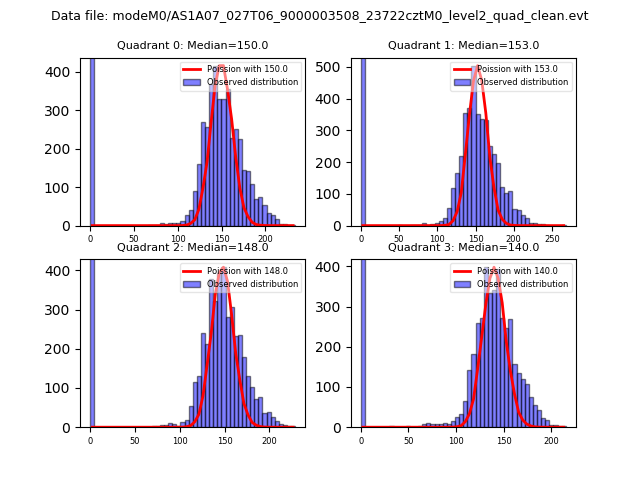
| Comparison with Poisson distribution Blue bars denote a histogram of data divided into 1 sec bins. Red curve is a Poisson curve with rate = median count rate of data. |
 |
 |
| Quadrant-wise count rates Data is divided into 100 sec bins |
 |
|
| Module-wise count rates for Quadrant A Data is divided into 100 sec bins |
 |
 |
| Module-wise count rates for Quadrant B Data is divided into 100 sec bins |
 |
 |
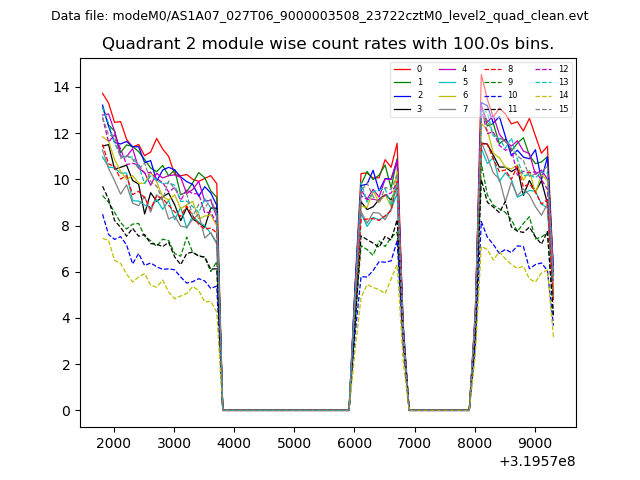
| Module-wise count rates for Quadrant C Data is divided into 100 sec bins |
 |
 |
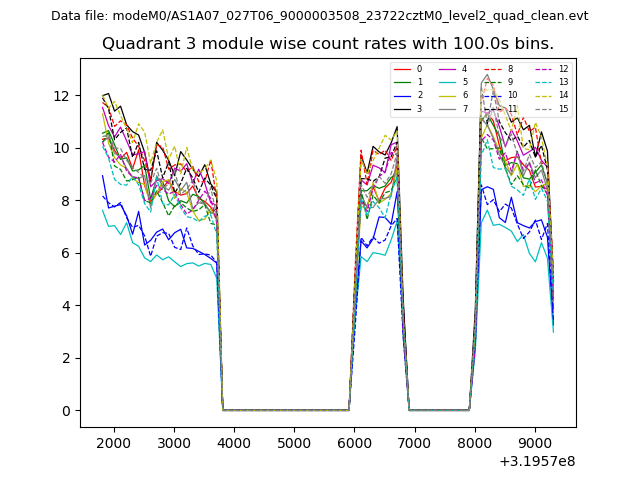
| Module-wise count rates for Quadrant D Data is divided into 100 sec bins |
 |
 |
| Parameter | Plot |
|---|---|
| CZT HV Monitor |  |
| D_VDD | 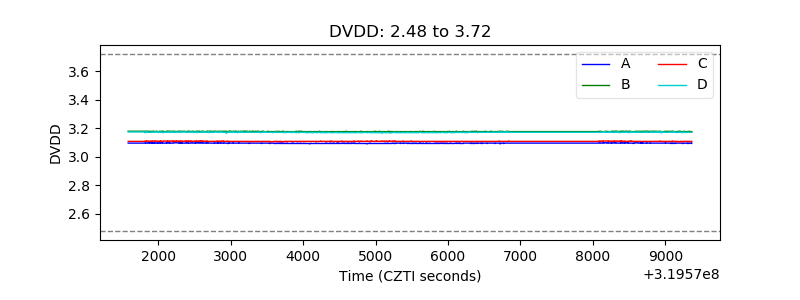 |
| Temperature 1 | 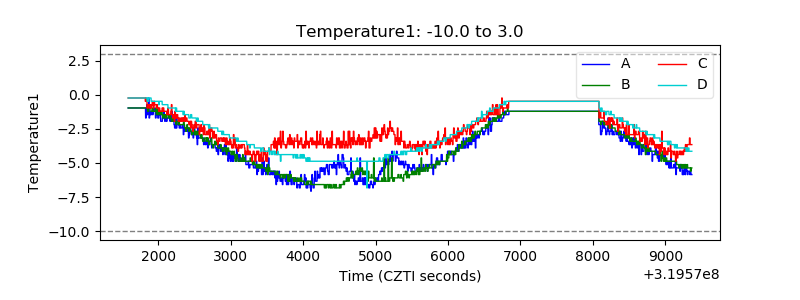 |
| Veto HV Monitor | 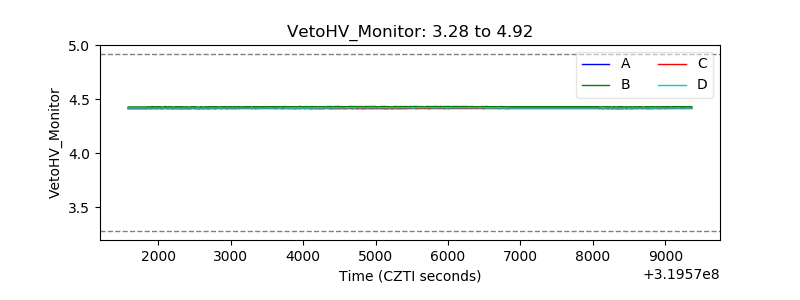 |
| Veto LLD | 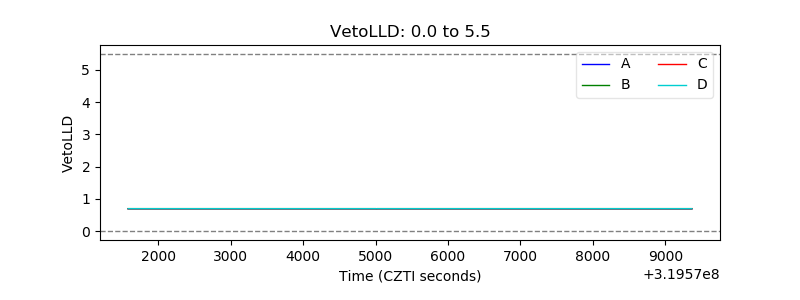 |
| Alpha Counter | 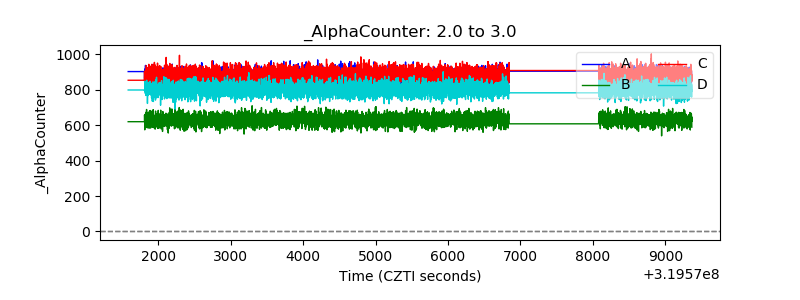 |
| _CPM_Rate | 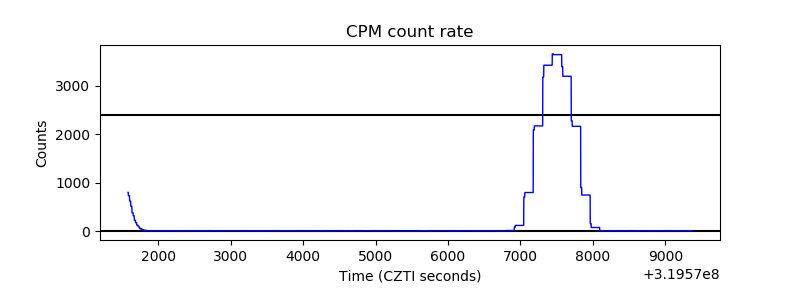 |
| CZT Counter | 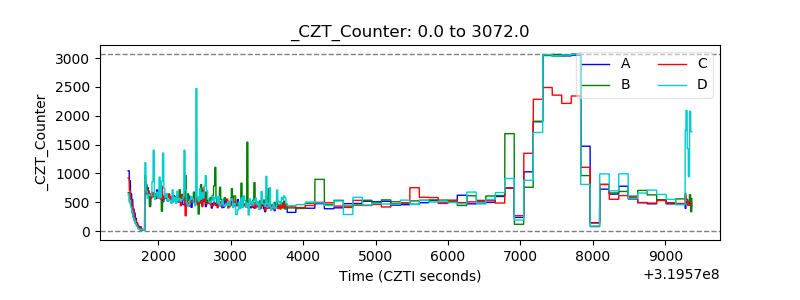 |
| +2.5 Volts monitor |  |
| +5 Volts monitor | 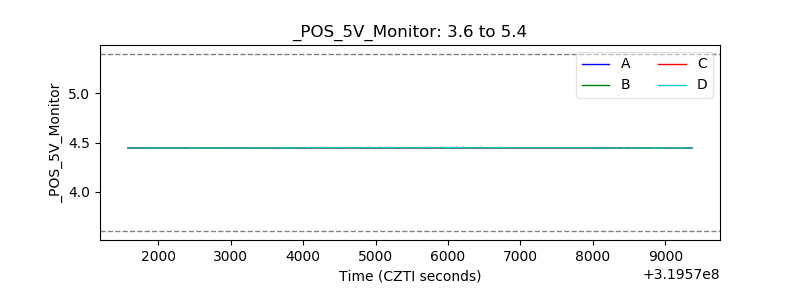 |
| _ROLL_ROT | 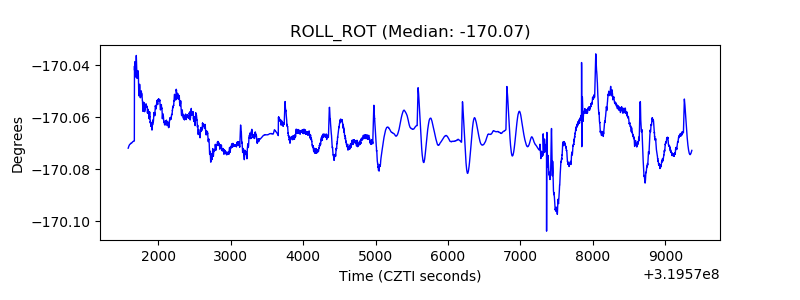 |
| _Roll_DEC | 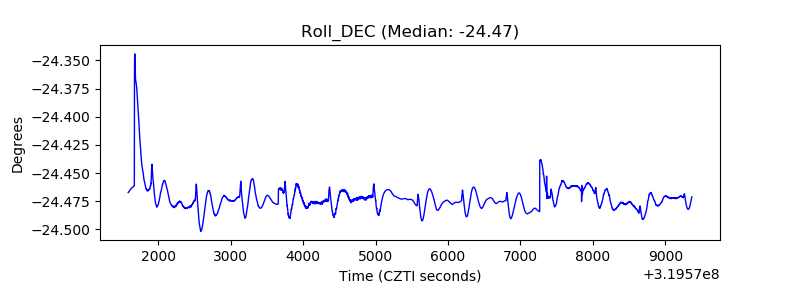 |
| _Roll_RA | 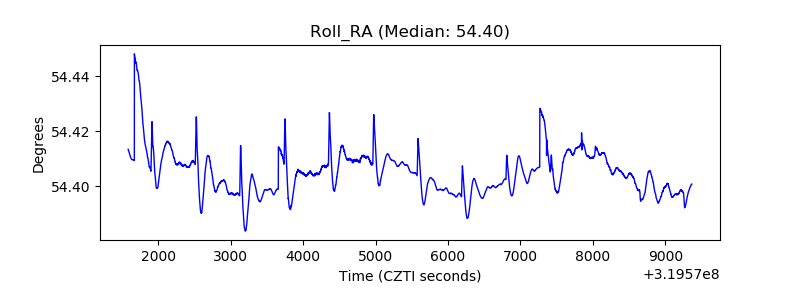 |
| Veto Counter | 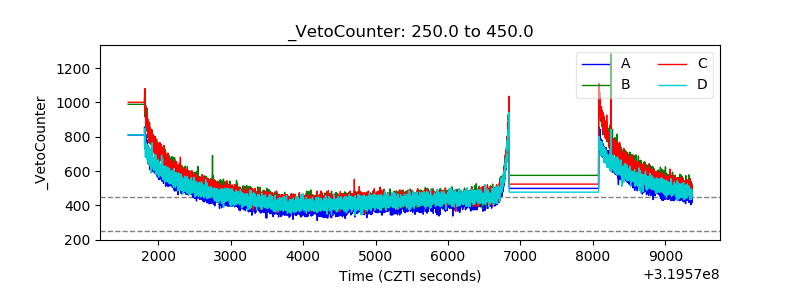 |