| Param | Original file | Final file |
|---|---|---|
| Filename | modeM0/AS1A07_027T06_9000003508_23724cztM0_level2.evt | modeM0/AS1A07_027T06_9000003508_23724cztM0_level2_quad_clean.evt |
| Size (bytes) | 540,296,640 | 84,640,320 |
| Size | 515.3 MB | 80.7 MB |
| Events in quadrant A | 3,205,454 | 546,000 |
| Events in quadrant B | 4,492,676 | 555,526 |
| Events in quadrant C | 3,448,065 | 535,811 |
| Events in quadrant D | 4,796,193 | 492,453 |
| Mode SS | |||
|---|---|---|---|
| Quadrant | BADHDUFLAG | Total packets | Discarded packets |
| A | 0 | 126 | 0 |
| B | 0 | 126 | 0 |
| C | 0 | 126 | 0 |
| D | 0 | 126 | 0 |
| Mode M9 | |||
|---|---|---|---|
| Quadrant | BADHDUFLAG | Total packets | Discarded packets |
| A | 0 | 20 | 0 |
| B | 0 | 21 | 0 |
| C | 0 | 21 | 0 |
| D | 0 | 21 | 0 |
| Mode M0 | |||
|---|---|---|---|
| Quadrant | BADHDUFLAG | Total packets | Discarded packets |
| A | 0 | 13124 | 2 |
| B | 0 | 17234 | 2 |
| C | 0 | 13876 | 2 |
| D | 0 | 18457 | 4 |
| Quadrant | Total seconds | Saturated seconds | Saturation percentage |
|---|---|---|---|
| A | 6206 | 33 | 0.531743% |
| B | 6206 | 438 | 7.057686% |
| C | 6206 | 135 | 2.175314% |
| D | 6205 | 297 | 4.786463% |
Noise dominated data is calculated using 1-second bins in cleaned event files. If a bin has >2000 counts, and if more than 50% of those come from <1% of pixels, then it is considered to be noise-dominated and hence unusable.
| Quadrant | # 1 sec bins | Bins with >0 counts | Bins with >2000 counts | High rate bins dominated by noise | Noise dominated (total time) | Noise dominated (detector-on time) | Marked lightcurve |
|---|---|---|---|---|---|---|---|
| A | 7536 | 6206 | 0 | 0 | 0.00% | 0.00% | 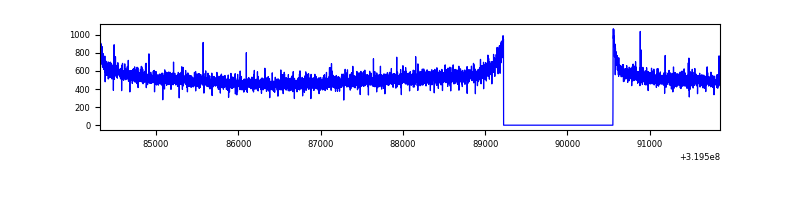 |
| B | 7536 | 6206 | 292 | 292 | 3.87% | 4.71% | 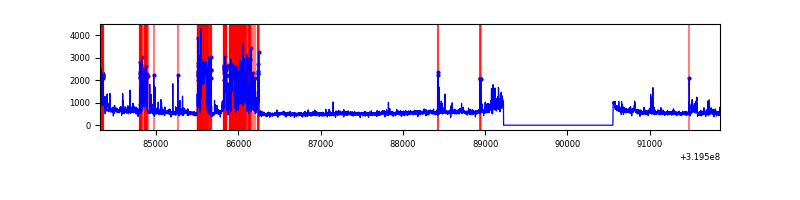 |
| C | 7536 | 6207 | 27 | 27 | 0.36% | 0.43% | 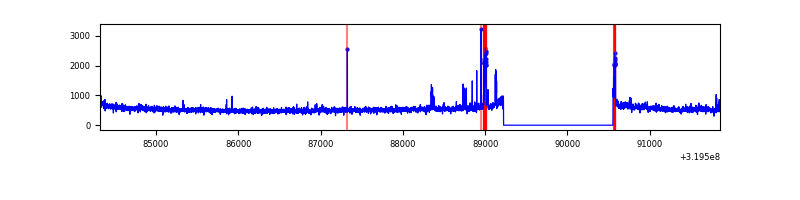 |
| D | 7535 | 6205 | 245 | 245 | 3.25% | 3.95% | 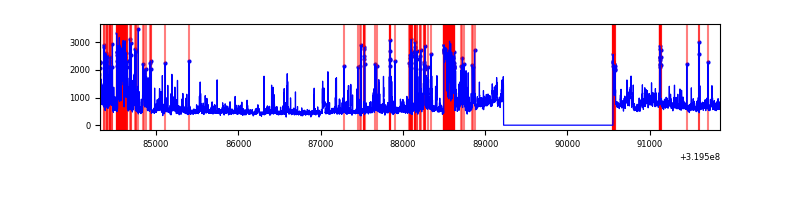 |
Top three noisy pixels from each quadrant. If the there are fewer than three noisy pixels in the level2.evt file, extra rows are filled as -1
| Pixel properties | Quadrant properties | ||||||
|---|---|---|---|---|---|---|---|
| Quadrant | DetID | PixID | Counts | Sigma | Mean | Median | Sigma |
| A | 13 | 254 | 11679 | 65.47 | 831 | 815 | 165.9 |
| A | 0 | 226 | 7209 | 38.53 | 831 | 815 | 165.9 |
| A | 3 | 137 | 6766 | 35.86 | 831 | 815 | 165.9 |
| B | 3 | 64 | 804316 | 5229.87 | 818 | 800 | 153.6 |
| B | 0 | 229 | 258982 | 1680.44 | 818 | 800 | 153.6 |
| B | 15 | 33 | 110004 | 710.78 | 818 | 800 | 153.6 |
| C | 10 | 9 | 167155 | 895.31 | 803 | 812 | 185.8 |
| C | 14 | 238 | 129598 | 693.16 | 803 | 812 | 185.8 |
| C | 7 | 247 | 15726 | 80.27 | 803 | 812 | 185.8 |
| D | 1 | 52 | 1506084 | 7812.91 | 788 | 764 | 192.7 |
| D | 13 | 174 | 135906 | 701.41 | 788 | 764 | 192.7 |
| D | 7 | 238 | 120970 | 623.89 | 788 | 764 | 192.7 |
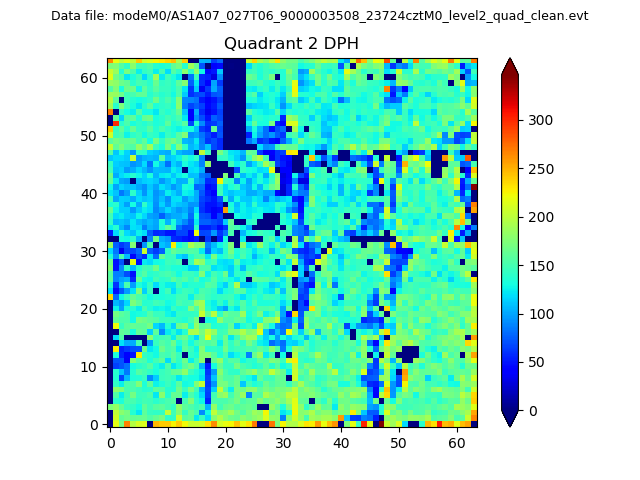
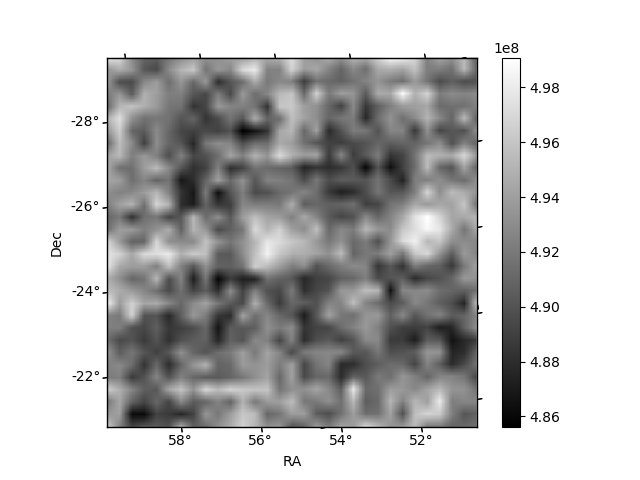
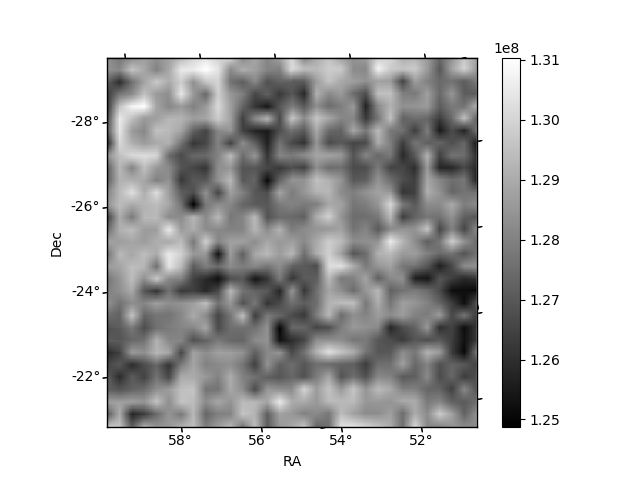
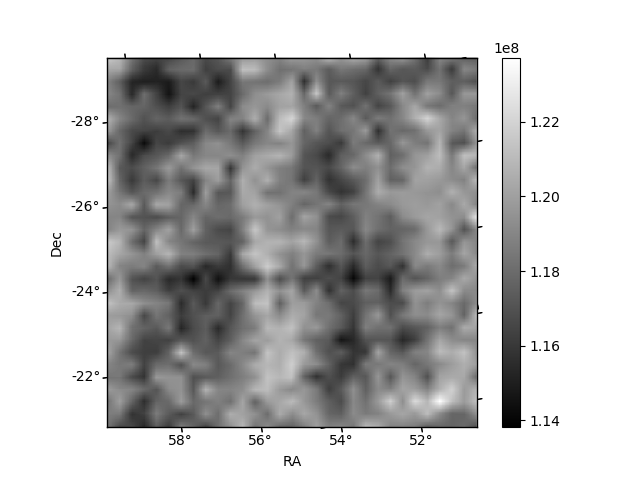
Histogram calculated using DETX and DETY for each event in the final _common_clean file
| Quadrant A | 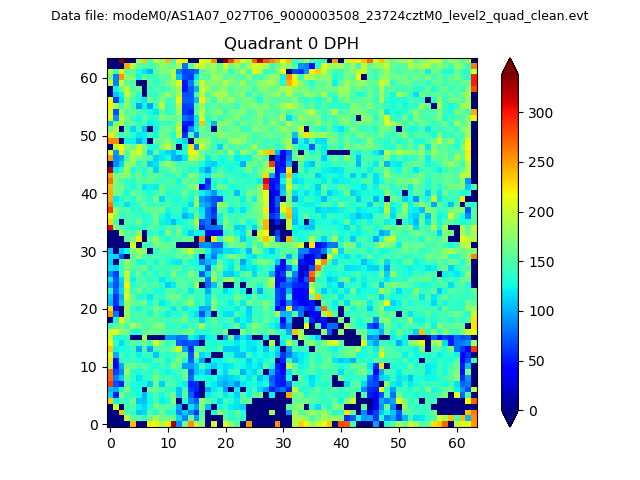 |
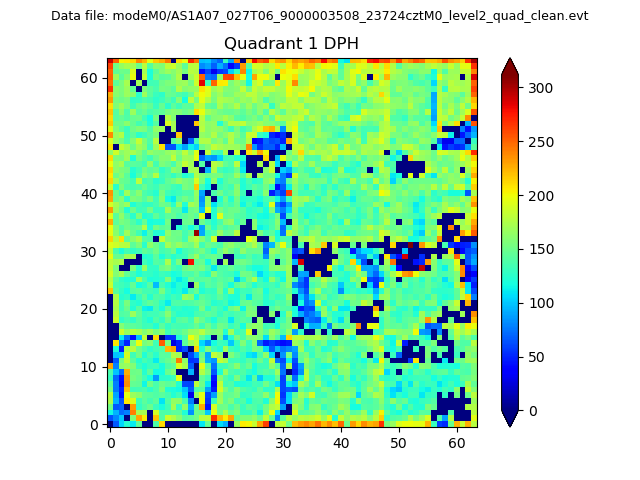 |
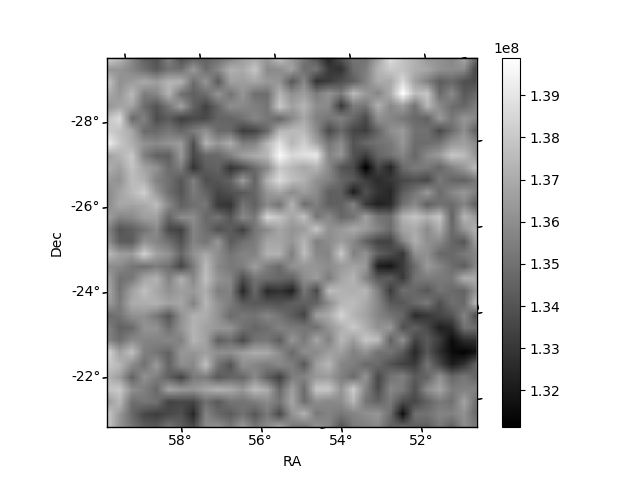
Quadrant B |
|---|---|---|---|
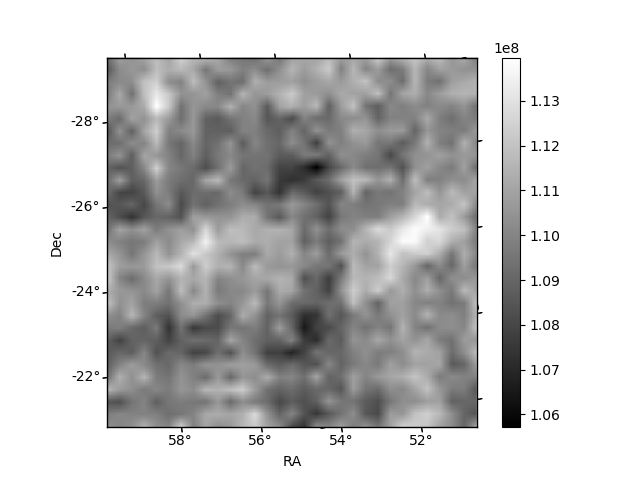
| Quadrant D | 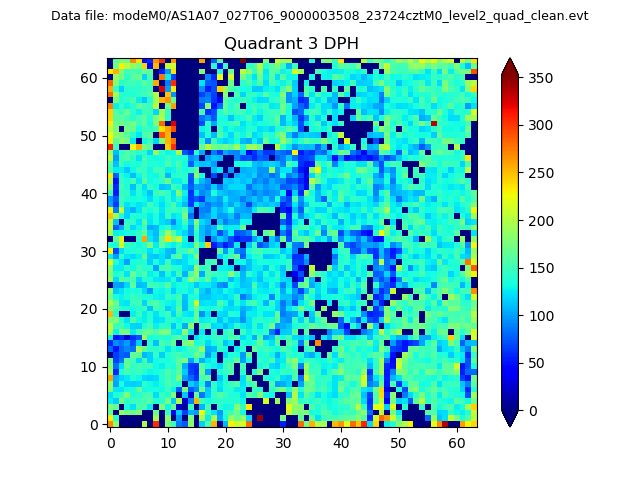 |
 |
Quadrant C |
| Plot type | Count rate plots | Images |
|---|---|---|
| Comparison with Poisson distribution Blue bars denote a histogram of data divided into 1 sec bins. Red curve is a Poisson curve with rate = median count rate of data. |
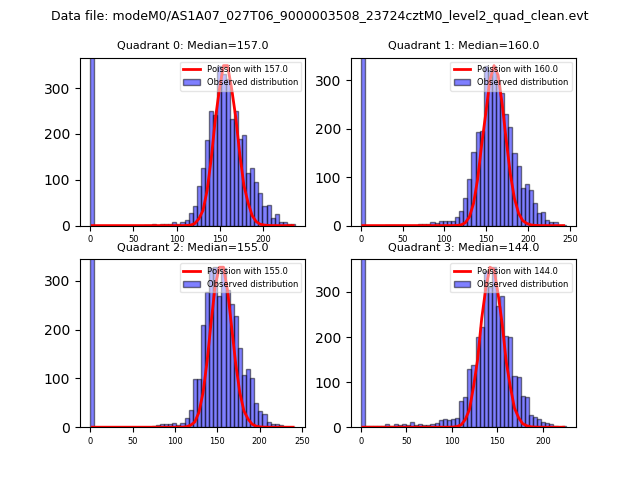 |
 |
| Quadrant-wise count rates Data is divided into 100 sec bins |
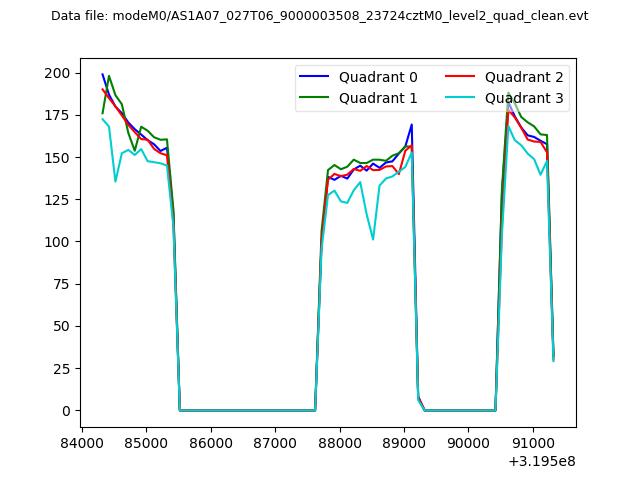 |
|
| Module-wise count rates for Quadrant A Data is divided into 100 sec bins |
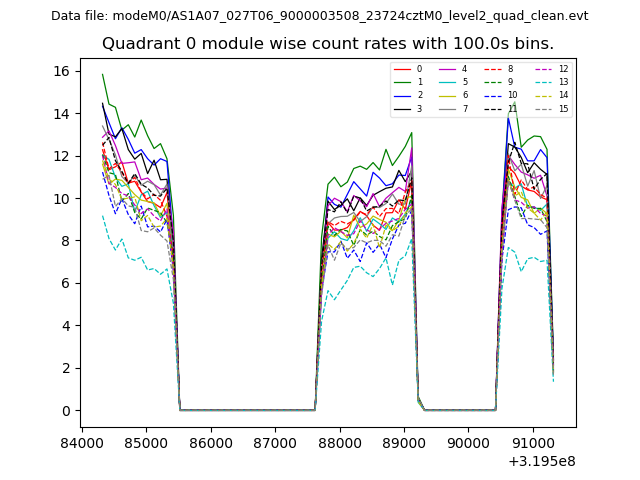 |
 |
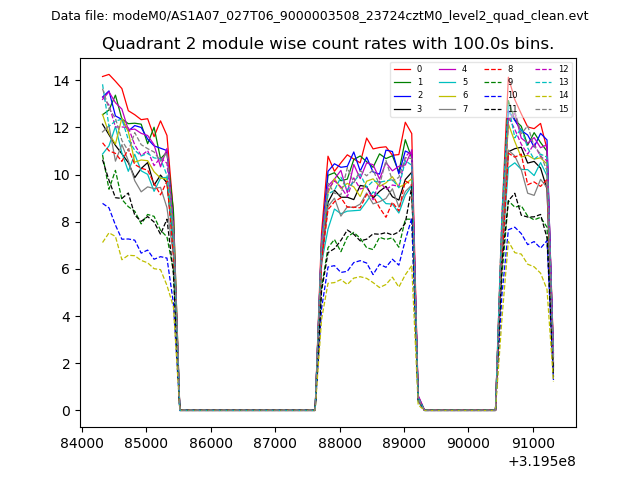
| Module-wise count rates for Quadrant B Data is divided into 100 sec bins |
 |
 |
| Module-wise count rates for Quadrant C Data is divided into 100 sec bins |
 |
 |
| Module-wise count rates for Quadrant D Data is divided into 100 sec bins |
 |
 |
| Parameter | Plot |
|---|---|
| CZT HV Monitor | 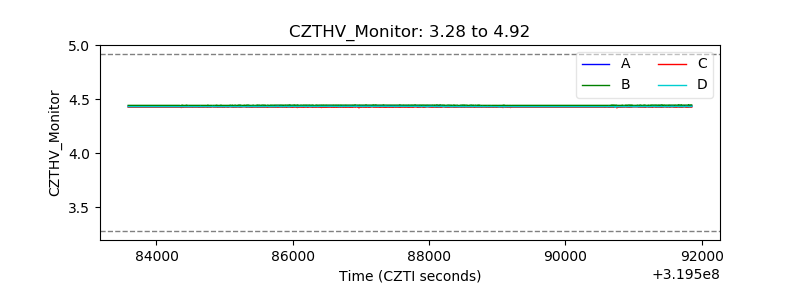 |
| D_VDD | 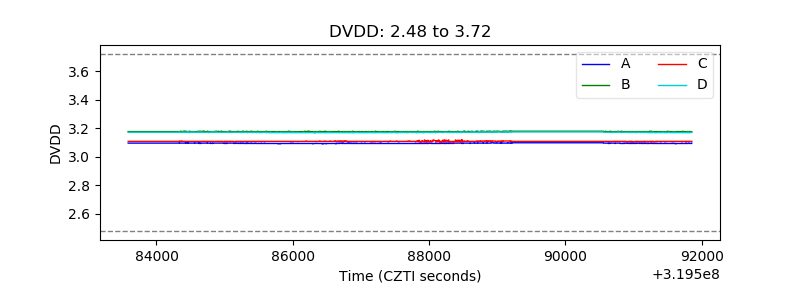 |
| Temperature 1 | 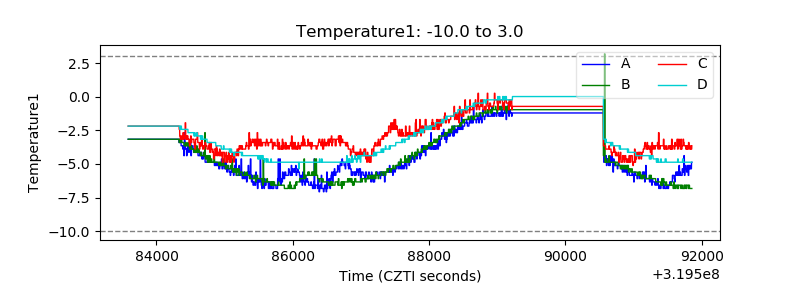 |
| Veto HV Monitor | 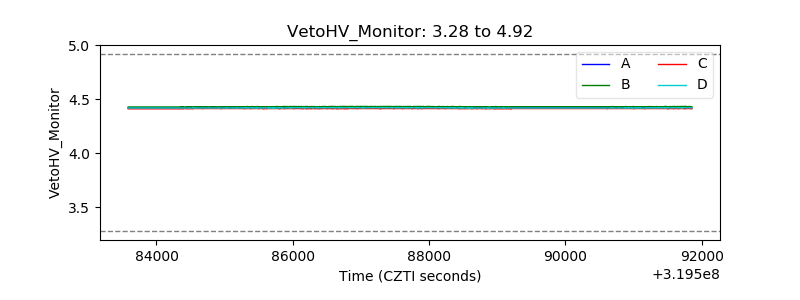 |
| Veto LLD | 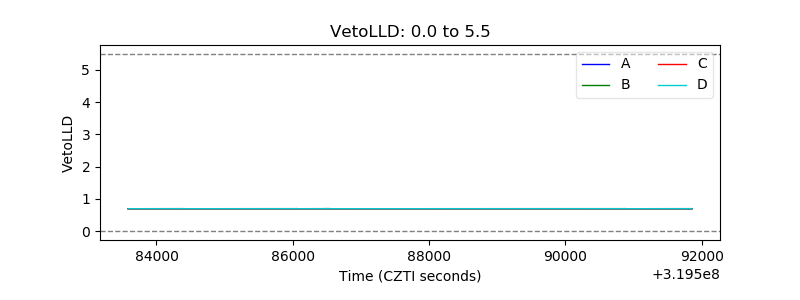 |
| Alpha Counter | 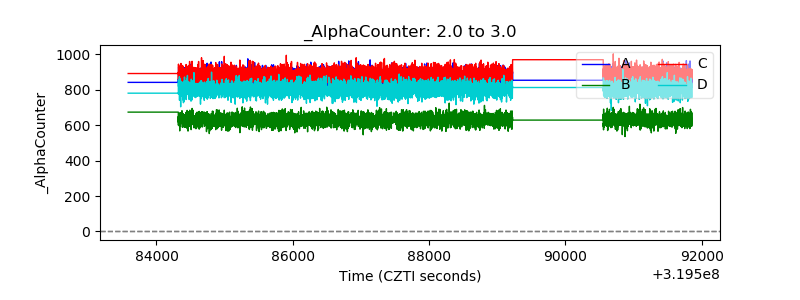 |
| _CPM_Rate | 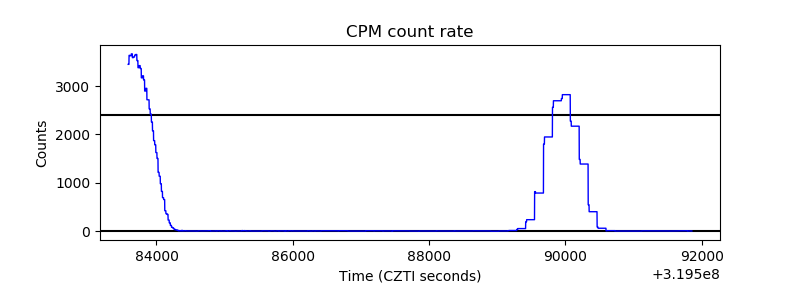 |
| CZT Counter | 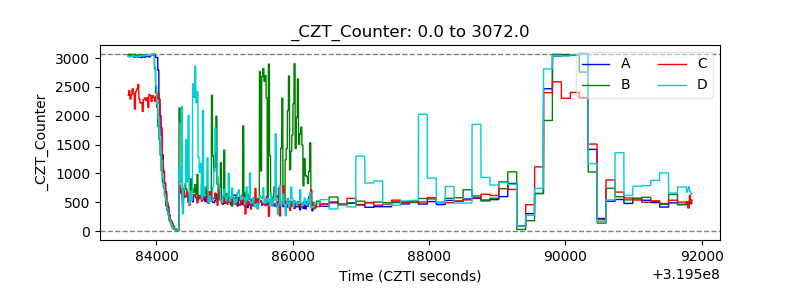 |
| +2.5 Volts monitor |  |
| +5 Volts monitor | 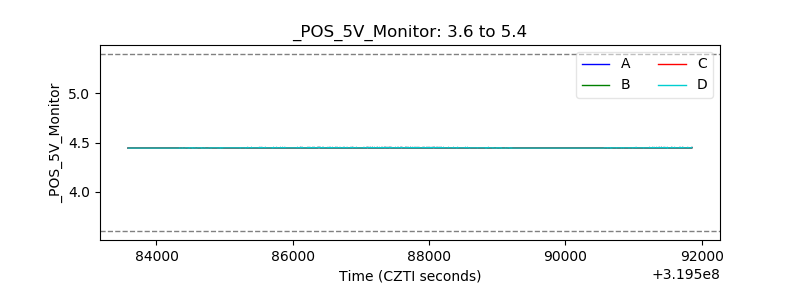 |
| _ROLL_ROT | 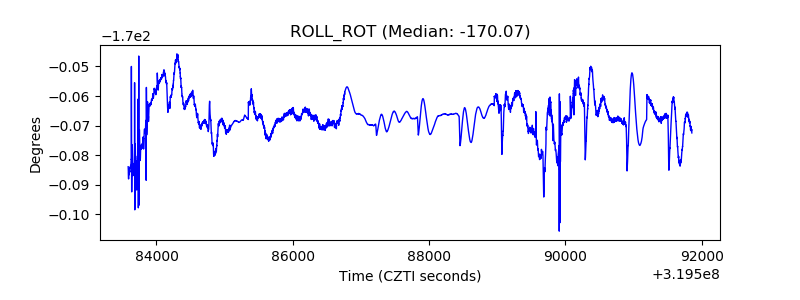 |
| _Roll_DEC | 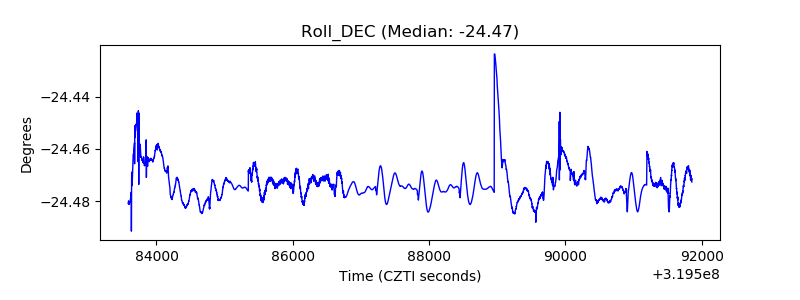 |
| _Roll_RA |  |
| Veto Counter | 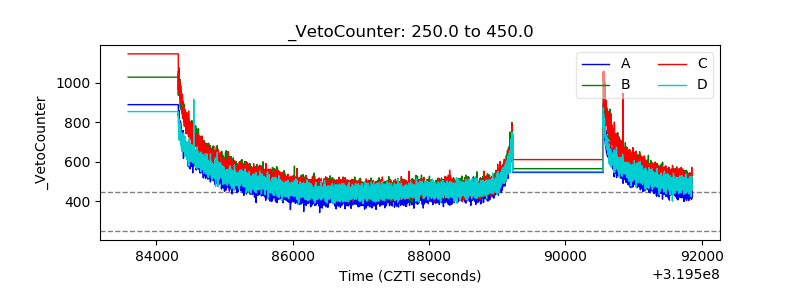 |