| Param | Original file | Final file |
|---|---|---|
| Filename | modeM0/AS1A07_027T06_9000003508_23725cztM0_level2.evt | modeM0/AS1A07_027T06_9000003508_23725cztM0_level2_quad_clean.evt |
| Size (bytes) | 523,693,440 | 75,335,040 |
| Size | 499.4 MB | 71.8 MB |
| Events in quadrant A | 3,280,519 | 464,601 |
| Events in quadrant B | 3,711,677 | 476,431 |
| Events in quadrant C | 3,728,638 | 456,138 |
| Events in quadrant D | 4,699,341 | 431,096 |
| Mode SS | |||
|---|---|---|---|
| Quadrant | BADHDUFLAG | Total packets | Discarded packets |
| A | 0 | 130 | 0 |
| B | 0 | 130 | 0 |
| C | 0 | 130 | 0 |
| D | 0 | 130 | 0 |
| Mode M9 | |||
|---|---|---|---|
| Quadrant | BADHDUFLAG | Total packets | Discarded packets |
| A | 0 | 16 | 0 |
| B | 0 | 17 | 0 |
| C | 0 | 17 | 0 |
| D | 0 | 17 | 0 |
| Mode M0 | |||
|---|---|---|---|
| Quadrant | BADHDUFLAG | Total packets | Discarded packets |
| A | 0 | 13504 | 2 |
| B | 0 | 14828 | 2 |
| C | 0 | 14891 | 2 |
| D | 0 | 18283 | 2 |
| Quadrant | Total seconds | Saturated seconds | Saturation percentage |
|---|---|---|---|
| A | 6498 | 15 | 0.230840% |
| B | 6498 | 53 | 0.815636% |
| C | 6498 | 91 | 1.400431% |
| D | 6498 | 155 | 2.385349% |
Noise dominated data is calculated using 1-second bins in cleaned event files. If a bin has >2000 counts, and if more than 50% of those come from <1% of pixels, then it is considered to be noise-dominated and hence unusable.
| Quadrant | # 1 sec bins | Bins with >0 counts | Bins with >2000 counts | High rate bins dominated by noise | Noise dominated (total time) | Noise dominated (detector-on time) | Marked lightcurve |
|---|---|---|---|---|---|---|---|
| A | 7818 | 6499 | 0 | 0 | 0.00% | 0.00% | 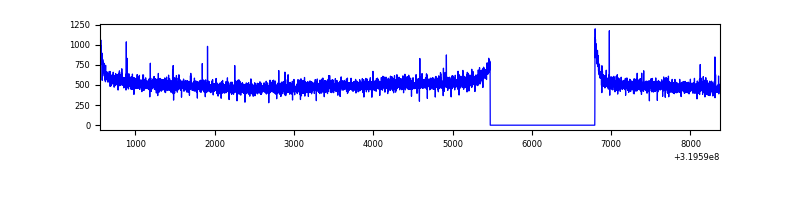 |
| B | 7818 | 6499 | 8 | 8 | 0.10% | 0.12% | 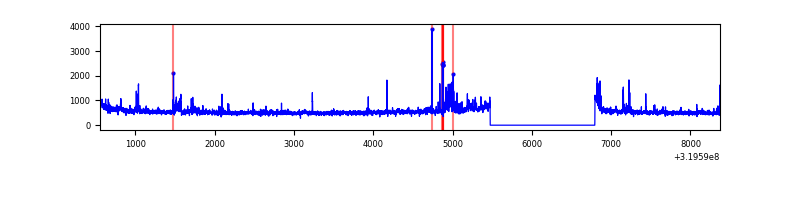 |
| C | 7818 | 6499 | 11 | 11 | 0.14% | 0.17% | 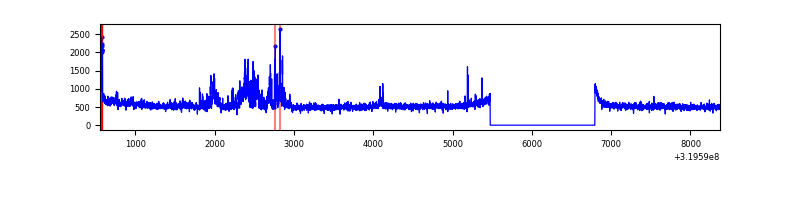 |
| D | 7818 | 6499 | 119 | 119 | 1.52% | 1.83% | 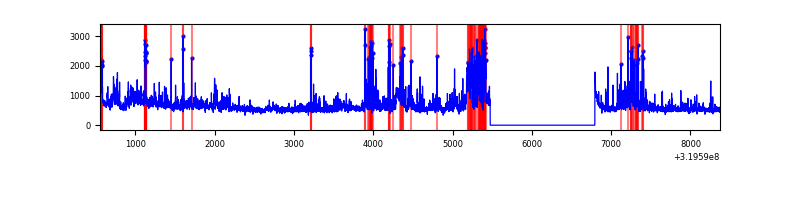 |
Top three noisy pixels from each quadrant. If the there are fewer than three noisy pixels in the level2.evt file, extra rows are filled as -1
| Pixel properties | Quadrant properties | ||||||
|---|---|---|---|---|---|---|---|
| Quadrant | DetID | PixID | Counts | Sigma | Mean | Median | Sigma |
| A | 13 | 254 | 11454 | 62.43 | 851 | 836 | 170.1 |
| A | 0 | 226 | 7487 | 39.11 | 851 | 836 | 170.1 |
| A | 3 | 137 | 7247 | 37.7 | 851 | 836 | 170.1 |
| B | 0 | 229 | 147209 | 912.73 | 857 | 838 | 160.4 |
| B | 15 | 33 | 90304 | 557.88 | 857 | 838 | 160.4 |
| B | 0 | 189 | 42008 | 256.72 | 857 | 838 | 160.4 |
| C | 10 | 9 | 358522 | 1881.02 | 823 | 831 | 190.2 |
| C | 14 | 238 | 132609 | 692.99 | 823 | 831 | 190.2 |
| C | 7 | 247 | 16355 | 81.64 | 823 | 831 | 190.2 |
| D | 1 | 52 | 894556 | 4531.29 | 816 | 795 | 197.2 |
| D | 7 | 238 | 367160 | 1857.44 | 816 | 795 | 197.2 |
| D | 13 | 174 | 297301 | 1503.26 | 816 | 795 | 197.2 |
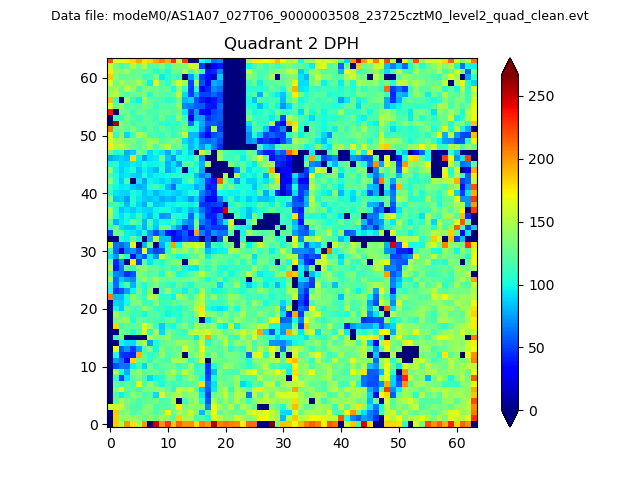
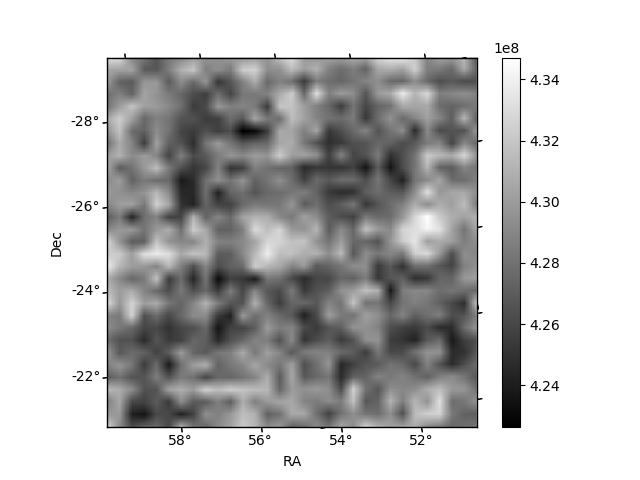
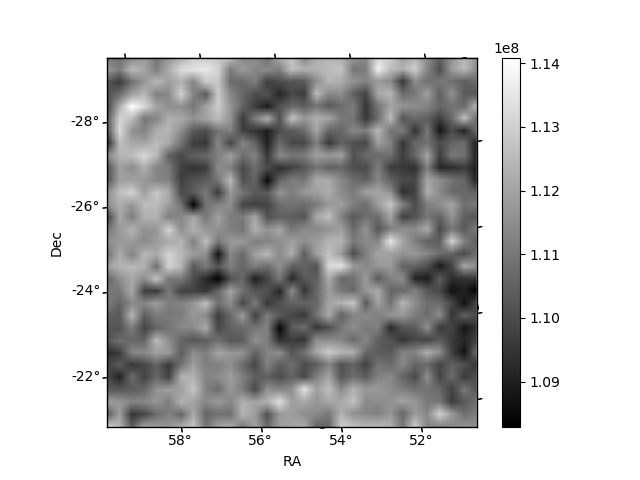
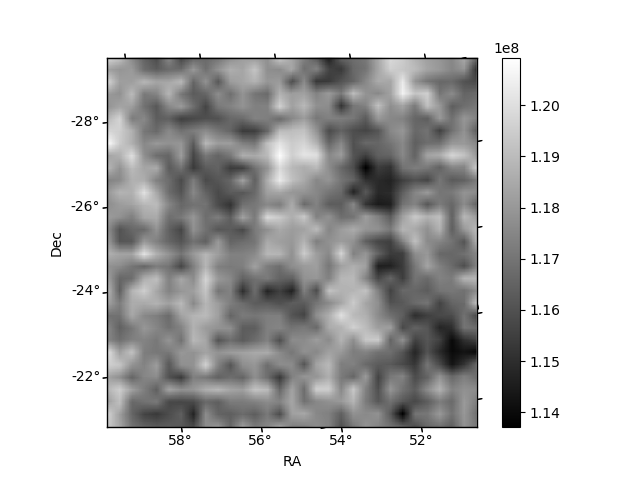
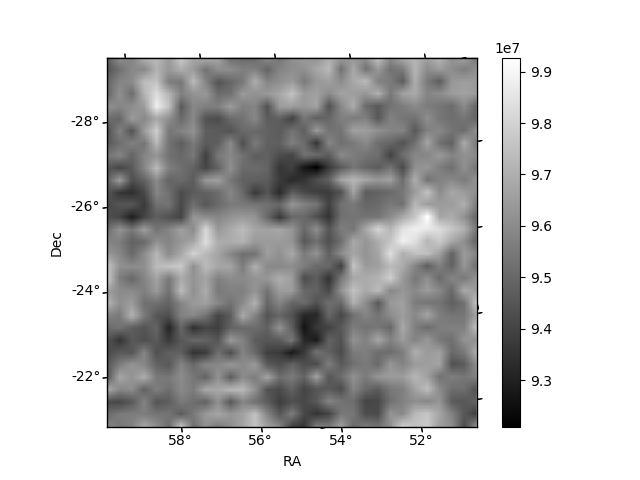
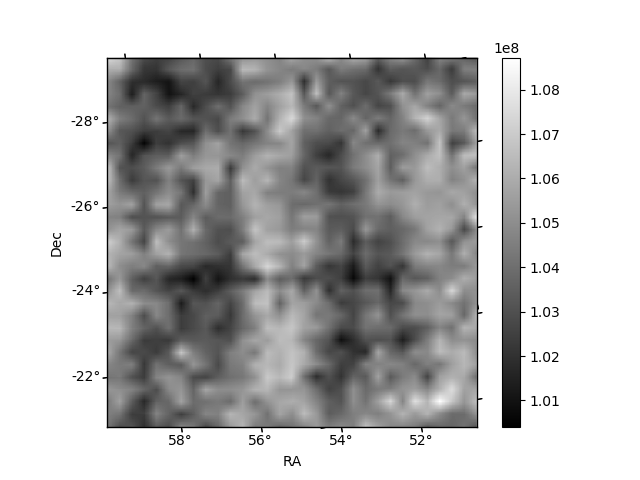
Histogram calculated using DETX and DETY for each event in the final _common_clean file
| Quadrant A | 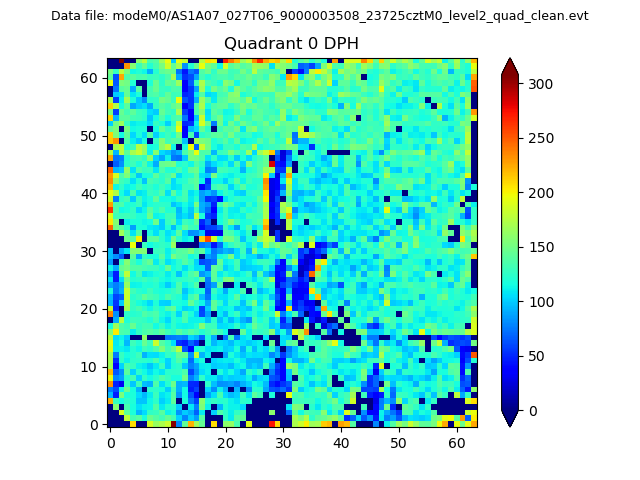 |
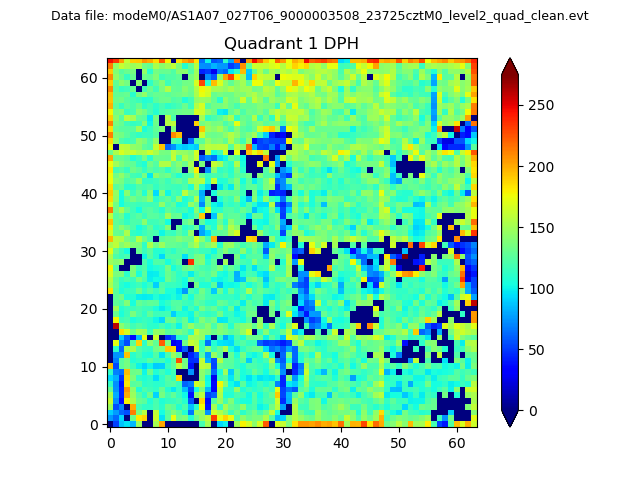 |
Quadrant B |
|---|---|---|---|
| Quadrant D | 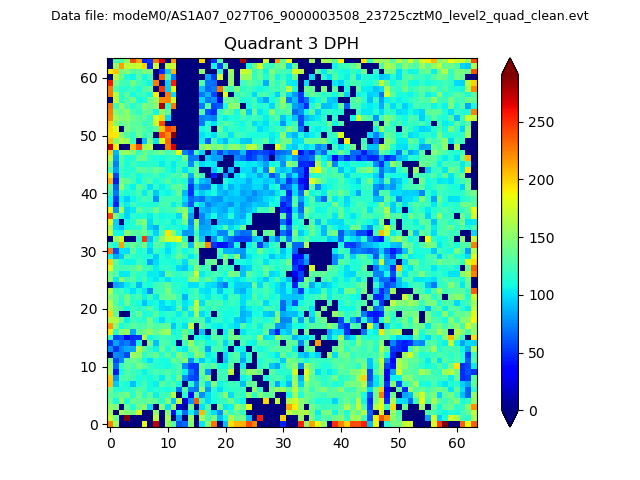 |
 |
Quadrant C |
| Plot type | Count rate plots | Images |
|---|---|---|
| Comparison with Poisson distribution Blue bars denote a histogram of data divided into 1 sec bins. Red curve is a Poisson curve with rate = median count rate of data. |
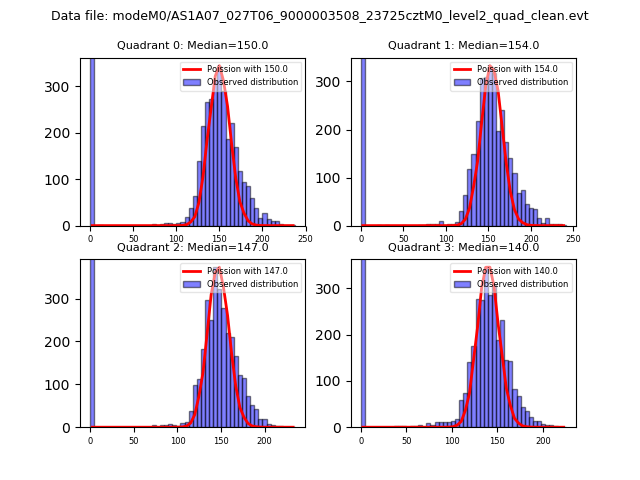 |
 |
| Quadrant-wise count rates Data is divided into 100 sec bins |
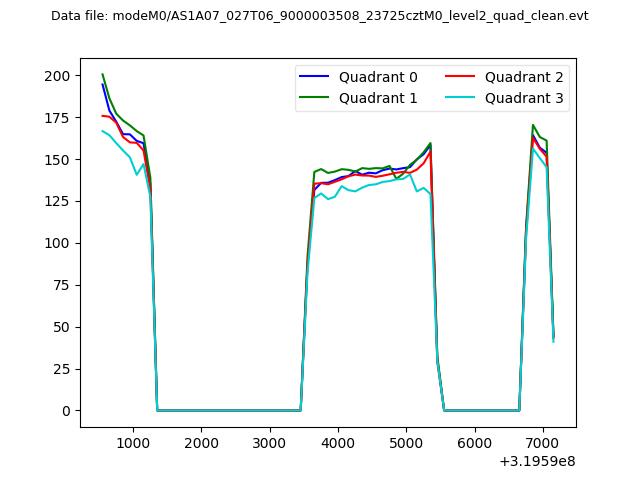 |
|
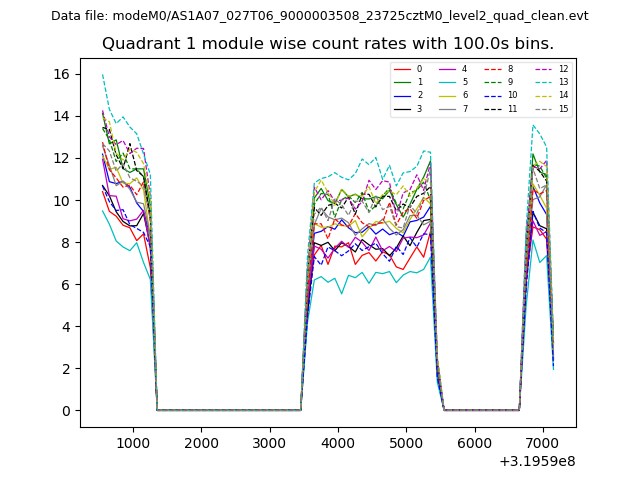
| Module-wise count rates for Quadrant A Data is divided into 100 sec bins |
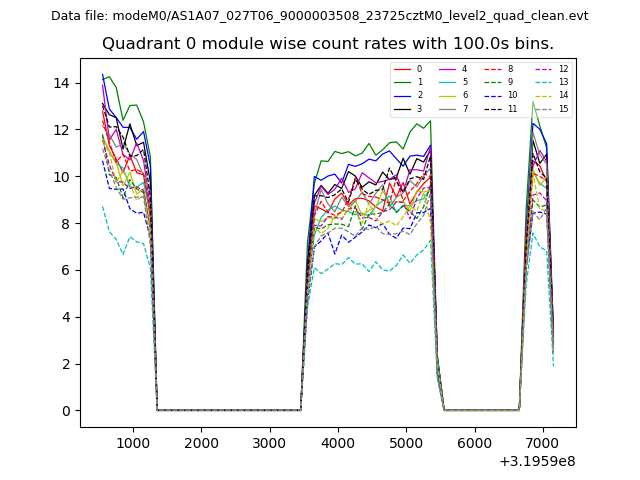 |
 |
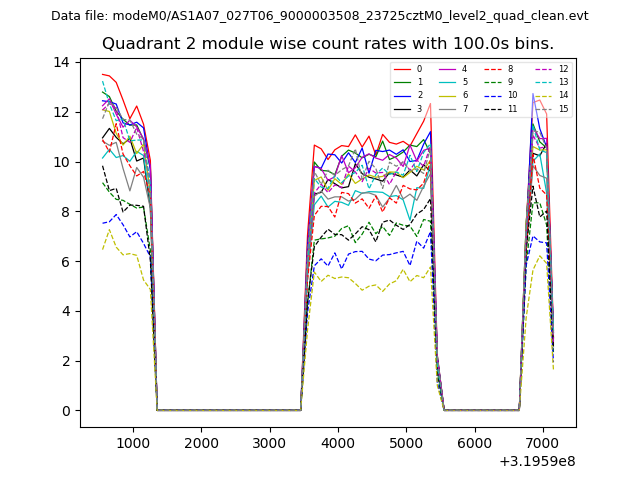
| Module-wise count rates for Quadrant B Data is divided into 100 sec bins |
 |
 |
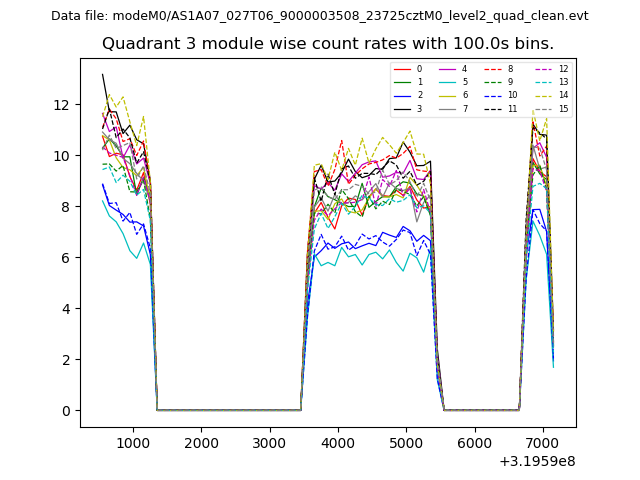
| Module-wise count rates for Quadrant C Data is divided into 100 sec bins |
 |
 |
| Module-wise count rates for Quadrant D Data is divided into 100 sec bins |
 |
 |
| Parameter | Plot |
|---|---|
| CZT HV Monitor | 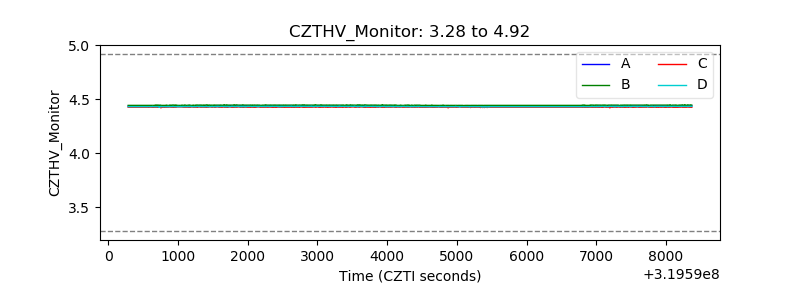 |
| D_VDD | 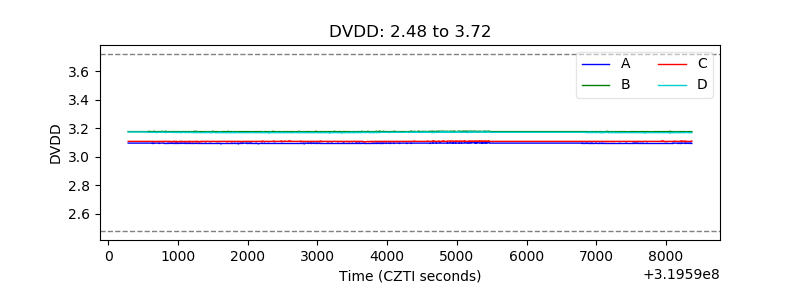 |
| Temperature 1 | 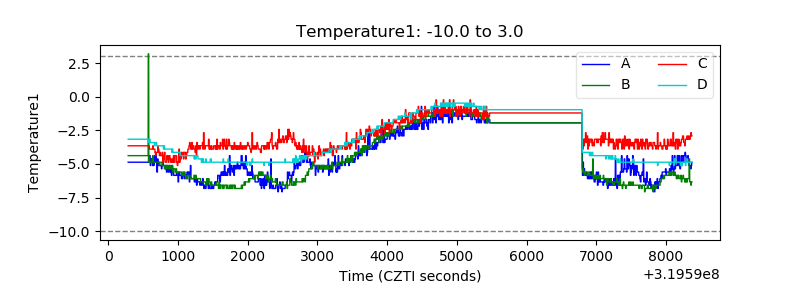 |
| Veto HV Monitor | 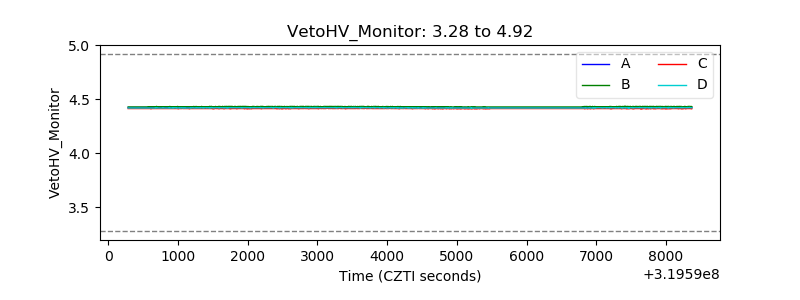 |
| Veto LLD | 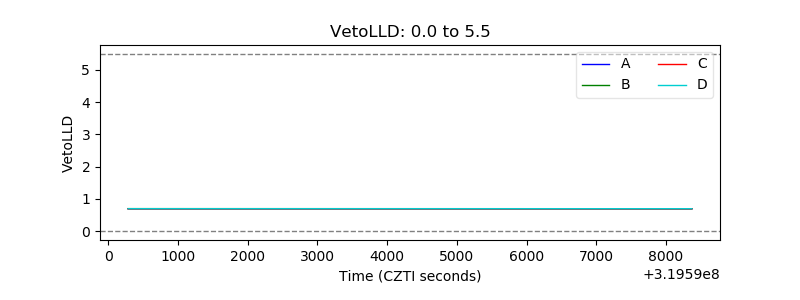 |
| Alpha Counter | 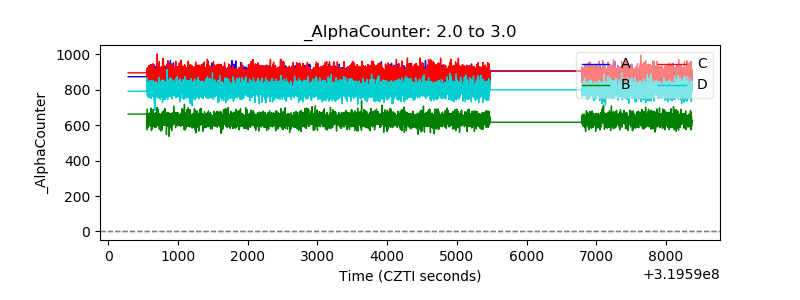 |
| _CPM_Rate | 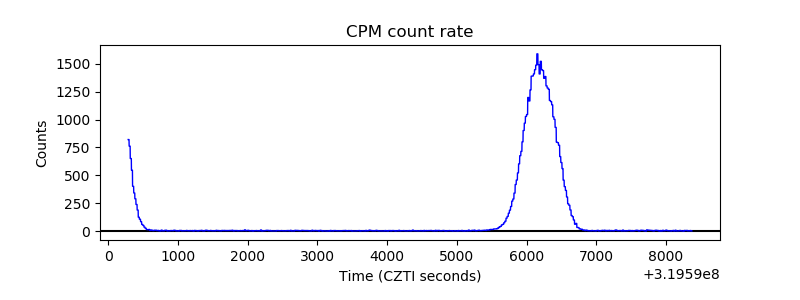 |
| CZT Counter | 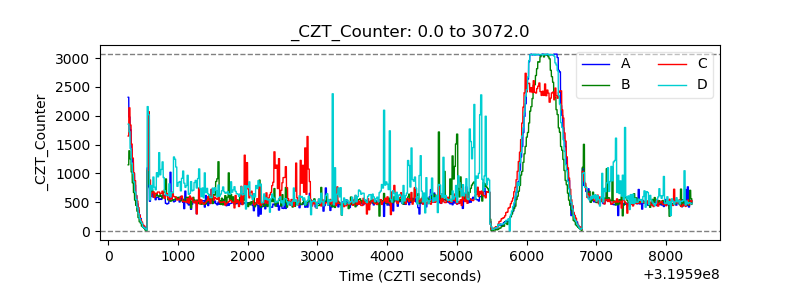 |
| +2.5 Volts monitor |  |
| +5 Volts monitor |  |
| _ROLL_ROT | 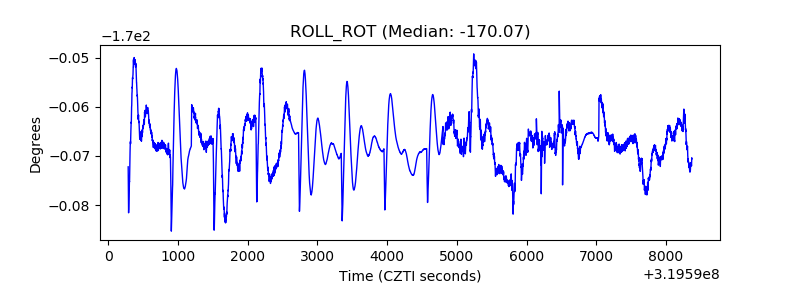 |
| _Roll_DEC | 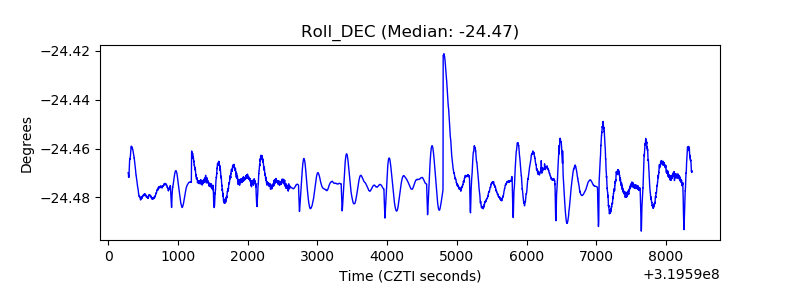 |
| _Roll_RA | 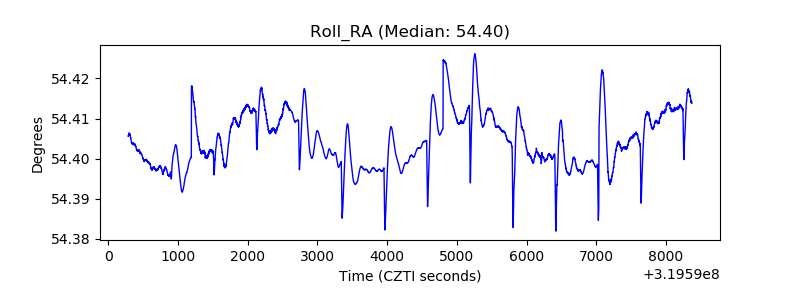 |
| Veto Counter | 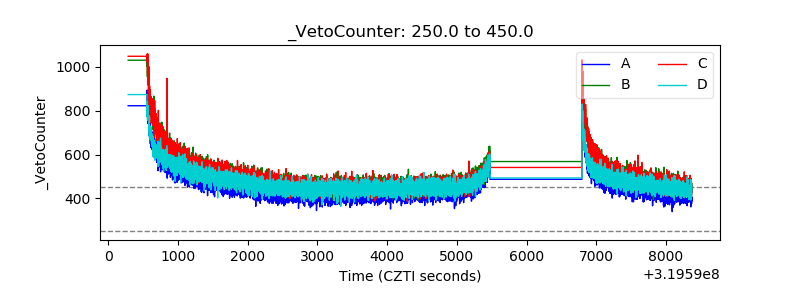 |