| Param | Original file | Final file |
|---|---|---|
| Filename | modeM0/AS1A07_027T06_9000003508_23727cztM0_level2.evt | modeM0/AS1A07_027T06_9000003508_23727cztM0_level2_quad_clean.evt |
| Size (bytes) | 540,198,720 | 75,041,280 |
| Size | 515.2 MB | 71.6 MB |
| Events in quadrant A | 3,524,019 | 449,822 |
| Events in quadrant B | 4,198,364 | 448,492 |
| Events in quadrant C | 3,670,514 | 442,358 |
| Events in quadrant D | 4,477,483 | 429,154 |
| Mode SS | |||
|---|---|---|---|
| Quadrant | BADHDUFLAG | Total packets | Discarded packets |
| A | 0 | 148 | 0 |
| B | 0 | 148 | 0 |
| C | 0 | 148 | 0 |
| D | 0 | 148 | 0 |
| Mode M9 | |||
|---|---|---|---|
| Quadrant | BADHDUFLAG | Total packets | Discarded packets |
| A | 0 | 17 | 0 |
| B | 0 | 17 | 0 |
| C | 0 | 17 | 0 |
| D | 0 | 17 | 0 |
| Mode M0 | |||
|---|---|---|---|
| Quadrant | BADHDUFLAG | Total packets | Discarded packets |
| A | 0 | 15002 | 3 |
| B | 0 | 16898 | 2 |
| C | 0 | 15254 | 2 |
| D | 0 | 17838 | 2 |
| Quadrant | Total seconds | Saturated seconds | Saturation percentage |
|---|---|---|---|
| A | 7215 | 117 | 1.621622% |
| B | 7215 | 231 | 3.201663% |
| C | 7215 | 199 | 2.758143% |
| D | 7216 | 204 | 2.827051% |
Noise dominated data is calculated using 1-second bins in cleaned event files. If a bin has >2000 counts, and if more than 50% of those come from <1% of pixels, then it is considered to be noise-dominated and hence unusable.
| Quadrant | # 1 sec bins | Bins with >0 counts | Bins with >2000 counts | High rate bins dominated by noise | Noise dominated (total time) | Noise dominated (detector-on time) | Marked lightcurve |
|---|---|---|---|---|---|---|---|
| A | 8890 | 7216 | 0 | 0 | 0.00% | 0.00% | 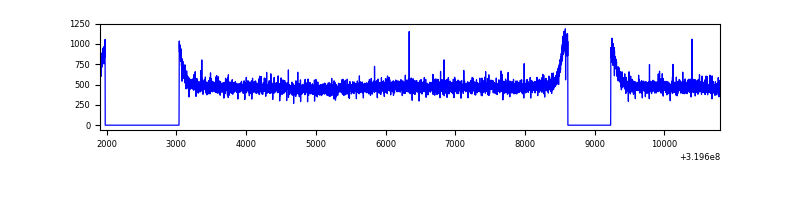 |
| B | 8890 | 7216 | 44 | 44 | 0.49% | 0.61% | 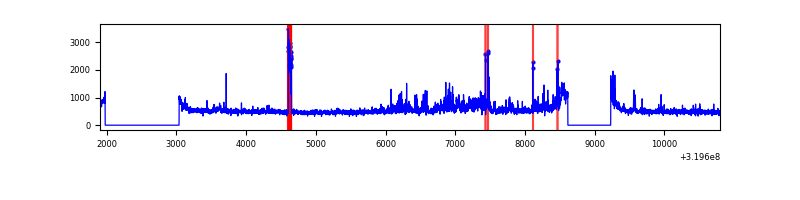 |
| C | 8890 | 7216 | 1 | 1 | 0.01% | 0.01% | 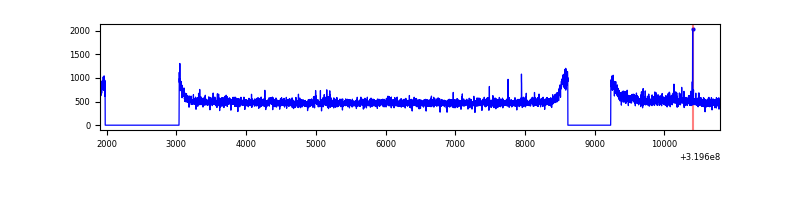 |
| D | 8891 | 7217 | 86 | 86 | 0.97% | 1.19% | 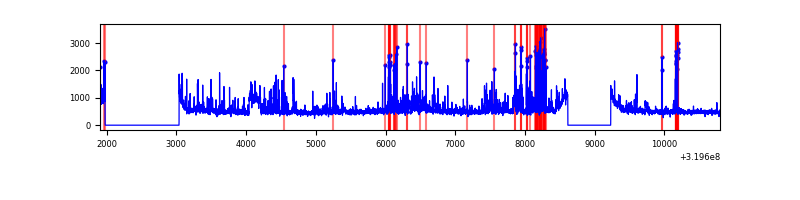 |
Top three noisy pixels from each quadrant. If the there are fewer than three noisy pixels in the level2.evt file, extra rows are filled as -1
| Pixel properties | Quadrant properties | ||||||
|---|---|---|---|---|---|---|---|
| Quadrant | DetID | PixID | Counts | Sigma | Mean | Median | Sigma |
| A | 13 | 254 | 13126 | 65.98 | 913 | 895 | 185.4 |
| A | 3 | 137 | 8175 | 39.27 | 913 | 895 | 185.4 |
| A | 0 | 226 | 7852 | 37.53 | 913 | 895 | 185.4 |
| B | 0 | 189 | 198925 | 1140.93 | 905 | 884 | 173.6 |
| B | 0 | 229 | 193403 | 1109.12 | 905 | 884 | 173.6 |
| B | 10 | 249 | 99843 | 570.11 | 905 | 884 | 173.6 |
| C | 14 | 238 | 137788 | 656.18 | 881 | 886 | 208.6 |
| C | 7 | 247 | 72763 | 344.51 | 881 | 886 | 208.6 |
| C | 9 | 244 | 14638 | 65.91 | 881 | 886 | 208.6 |
| D | 1 | 52 | 807311 | 3732.64 | 884 | 858 | 216.1 |
| D | 7 | 238 | 212374 | 978.99 | 884 | 858 | 216.1 |
| D | 8 | 195 | 45742 | 207.74 | 884 | 858 | 216.1 |
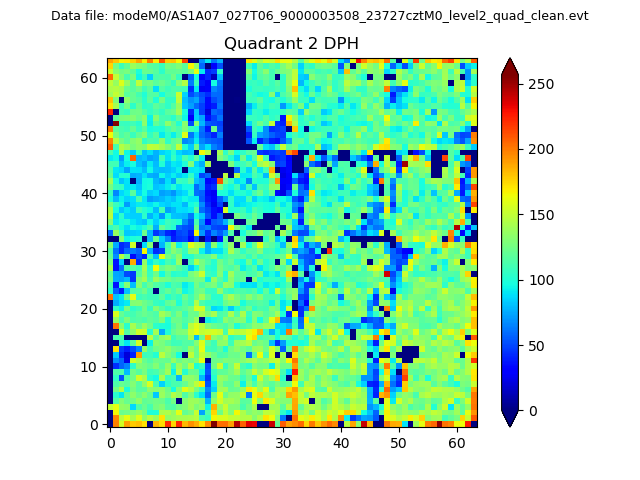
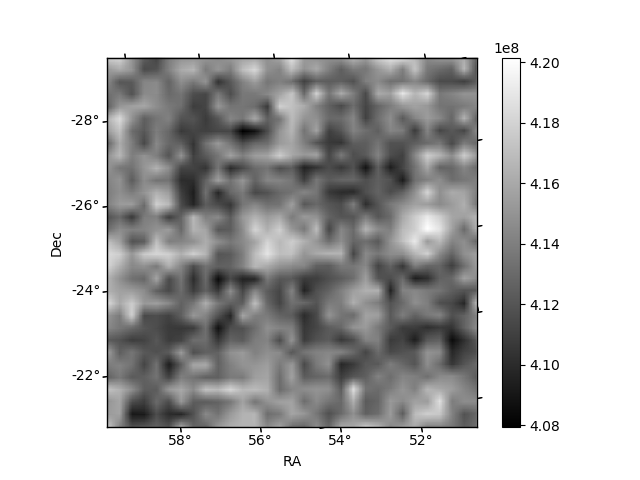
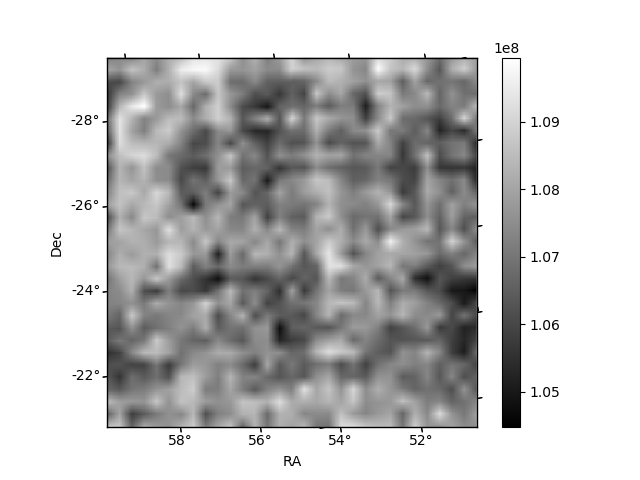
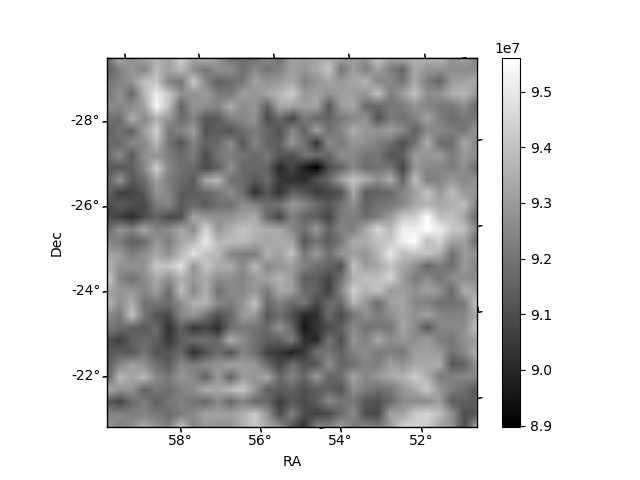
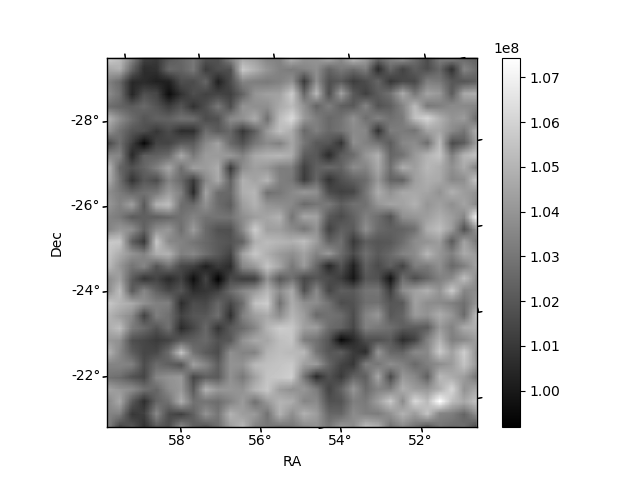
Histogram calculated using DETX and DETY for each event in the final _common_clean file
| Quadrant A | 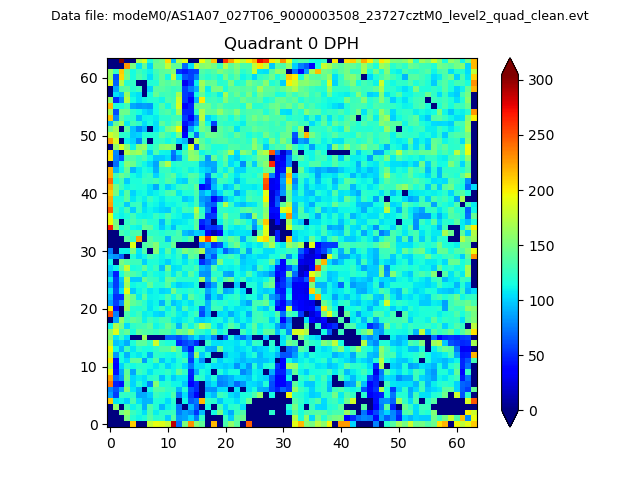 |
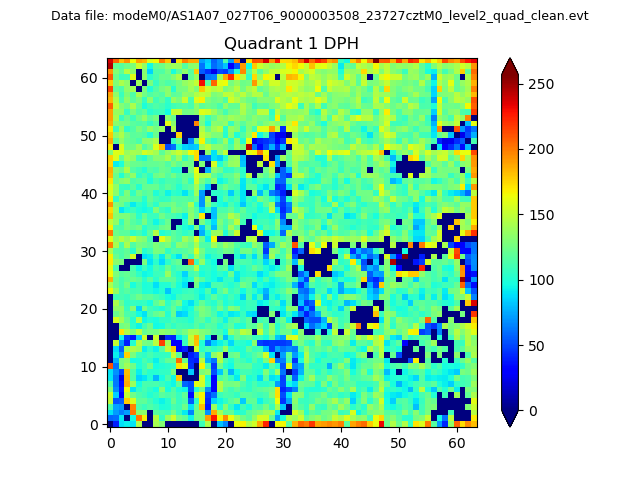 |
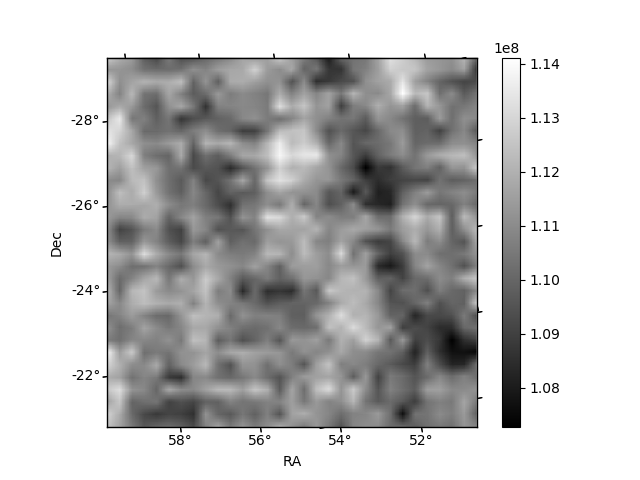
Quadrant B |
|---|---|---|---|
| Quadrant D | 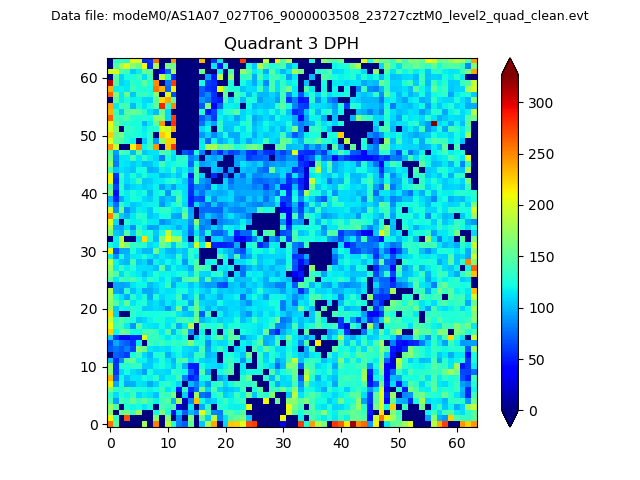 |
 |
Quadrant C |
| Plot type | Count rate plots | Images |
|---|---|---|
| Comparison with Poisson distribution Blue bars denote a histogram of data divided into 1 sec bins. Red curve is a Poisson curve with rate = median count rate of data. |
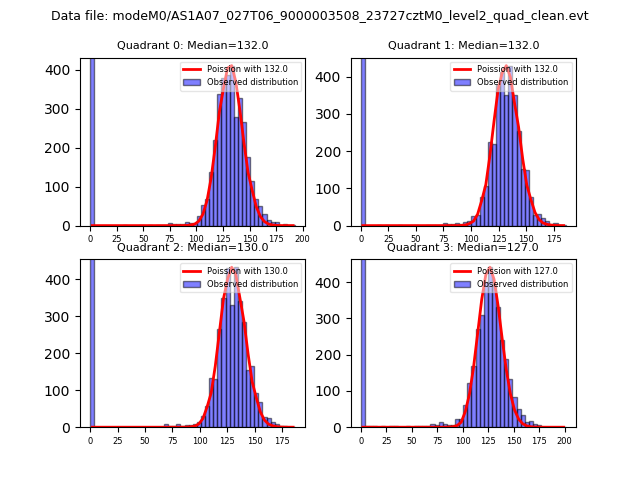 |
 |
| Quadrant-wise count rates Data is divided into 100 sec bins |
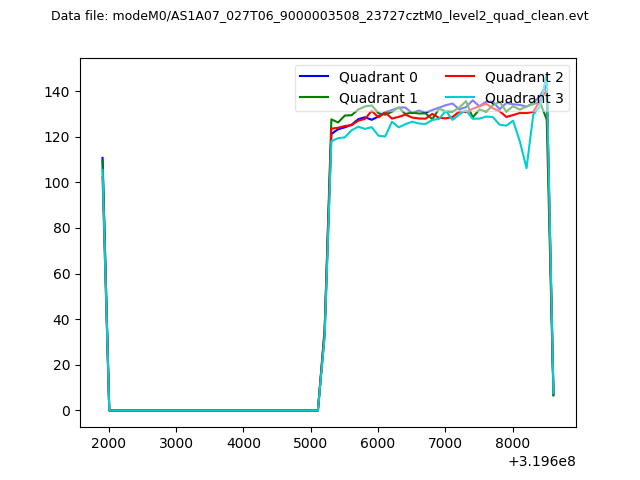 |
|
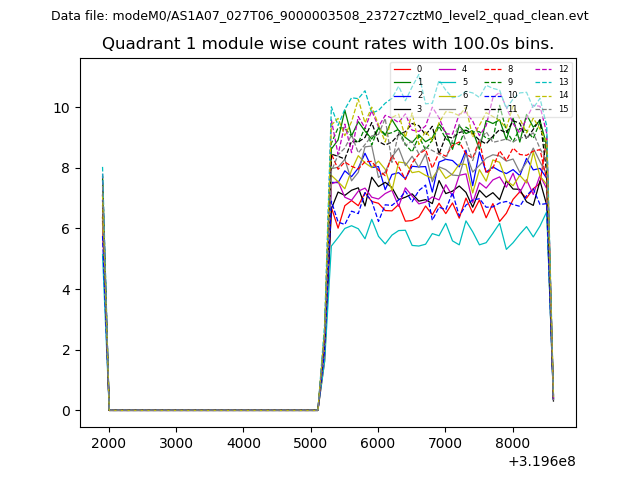
| Module-wise count rates for Quadrant A Data is divided into 100 sec bins |
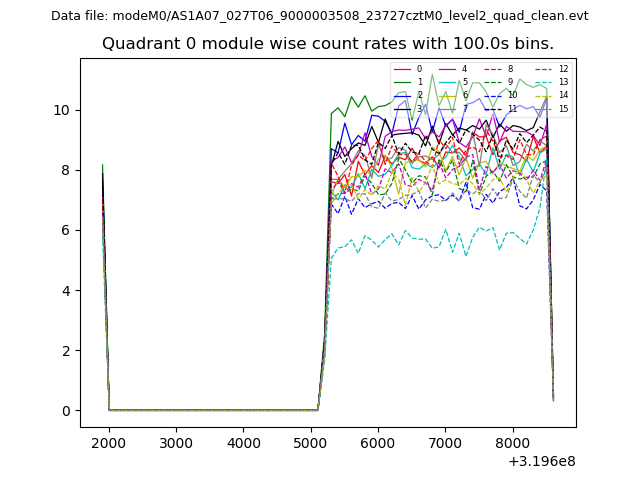 |
 |
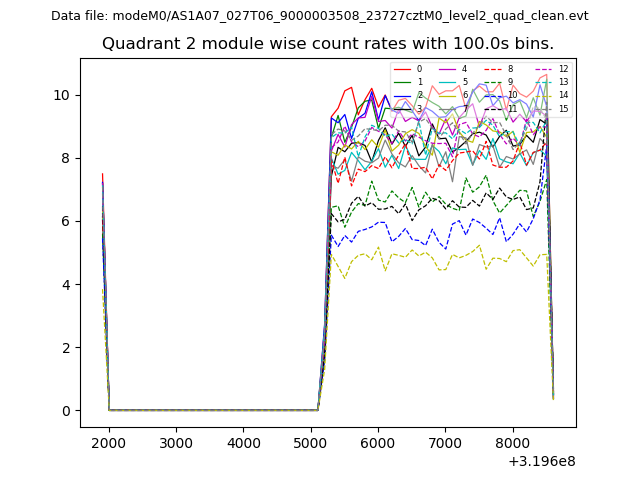
| Module-wise count rates for Quadrant B Data is divided into 100 sec bins |
 |
 |
| Module-wise count rates for Quadrant C Data is divided into 100 sec bins |
 |
 |
| Module-wise count rates for Quadrant D Data is divided into 100 sec bins |
 |
 |
| Parameter | Plot |
|---|---|
| CZT HV Monitor | 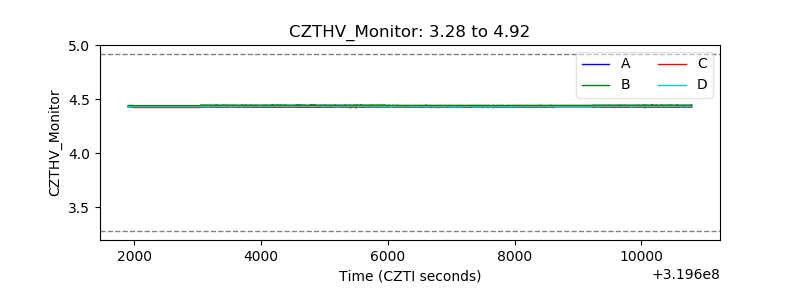 |
| D_VDD |  |
| Temperature 1 | 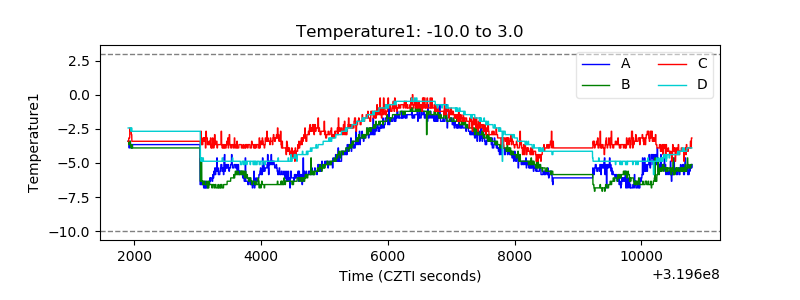 |
| Veto HV Monitor | 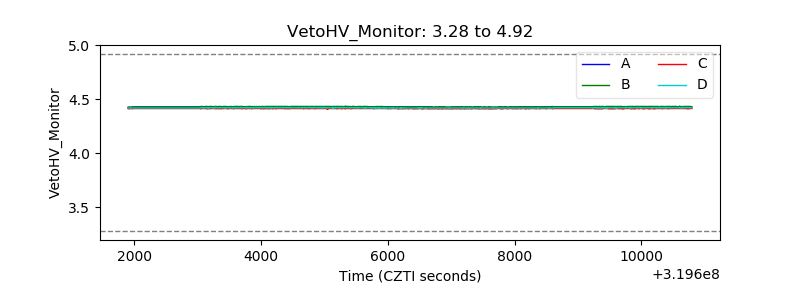 |
| Veto LLD |  |
| Alpha Counter | 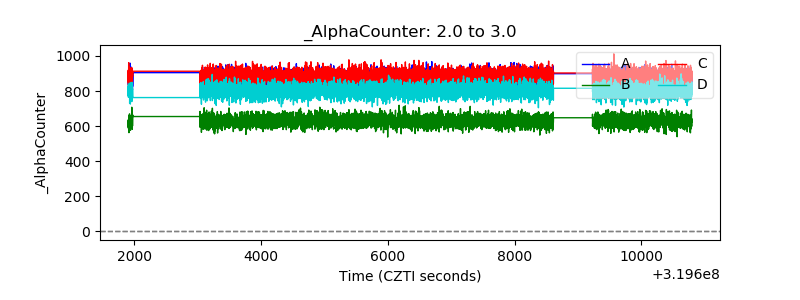 |
| _CPM_Rate | 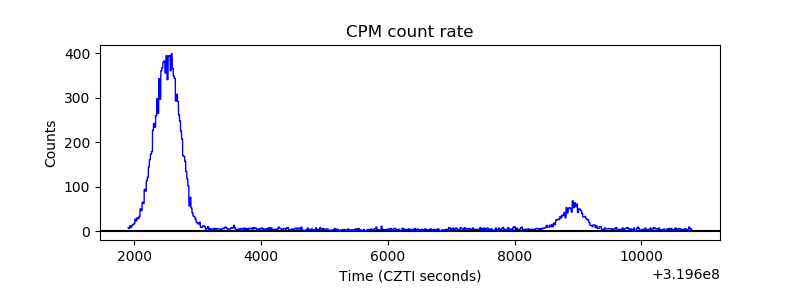 |
| CZT Counter | 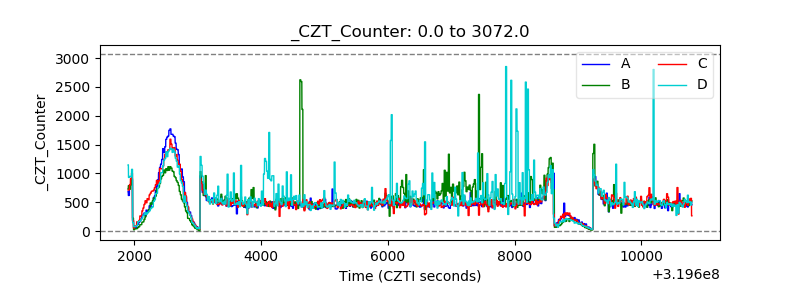 |
| +2.5 Volts monitor |  |
| +5 Volts monitor | 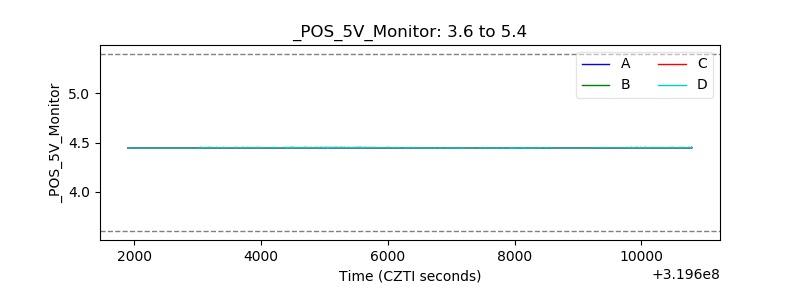 |
| _ROLL_ROT |  |
| _Roll_DEC | 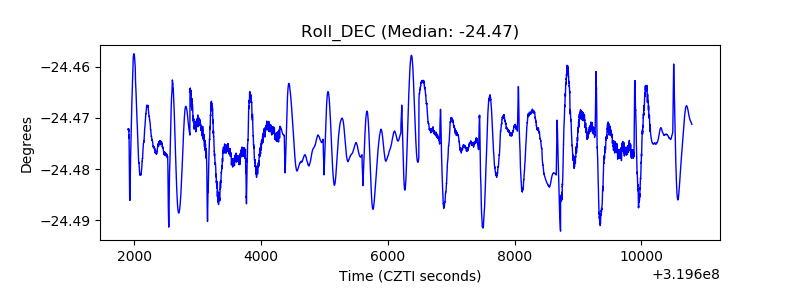 |
| _Roll_RA | 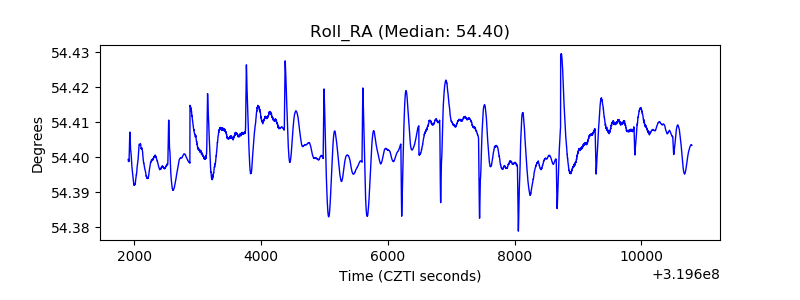 |
| Veto Counter | 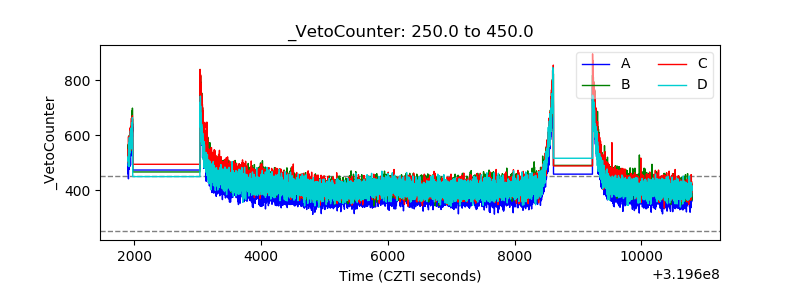 |