| Param | Original file | Final file |
|---|---|---|
| Filename | modeM0/AS1A07_027T06_9000003508_23728cztM0_level2.evt | modeM0/AS1A07_027T06_9000003508_23728cztM0_level2_quad_clean.evt |
| Size (bytes) | 418,109,760 | 77,209,920 |
| Size | 398.7 MB | 73.6 MB |
| Events in quadrant A | 2,738,789 | 491,570 |
| Events in quadrant B | 3,272,611 | 489,825 |
| Events in quadrant C | 2,873,684 | 483,624 |
| Events in quadrant D | 3,386,807 | 471,497 |
| Mode SS | |||
|---|---|---|---|
| Quadrant | BADHDUFLAG | Total packets | Discarded packets |
| A | 0 | 118 | 0 |
| B | 0 | 118 | 0 |
| C | 0 | 118 | 0 |
| D | 0 | 118 | 0 |
| Mode M9 | |||
|---|---|---|---|
| Quadrant | BADHDUFLAG | Total packets | Discarded packets |
| A | 0 | 6 | 0 |
| B | 0 | 6 | 0 |
| C | 0 | 6 | 0 |
| D | 0 | 6 | 0 |
| Mode M0 | |||
|---|---|---|---|
| Quadrant | BADHDUFLAG | Total packets | Discarded packets |
| A | 0 | 11859 | 1 |
| B | 0 | 13297 | 1 |
| C | 0 | 12099 | 1 |
| D | 0 | 13716 | 1 |
| Quadrant | Total seconds | Saturated seconds | Saturation percentage |
|---|---|---|---|
| A | 5739 | 106 | 1.847012% |
| B | 5739 | 183 | 3.188709% |
| C | 5739 | 138 | 2.404600% |
| D | 5740 | 154 | 2.682927% |
Noise dominated data is calculated using 1-second bins in cleaned event files. If a bin has >2000 counts, and if more than 50% of those come from <1% of pixels, then it is considered to be noise-dominated and hence unusable.
| Quadrant | # 1 sec bins | Bins with >0 counts | Bins with >2000 counts | High rate bins dominated by noise | Noise dominated (total time) | Noise dominated (detector-on time) | Marked lightcurve |
|---|---|---|---|---|---|---|---|
| A | 6354 | 5739 | 0 | 0 | 0.00% | 0.00% | 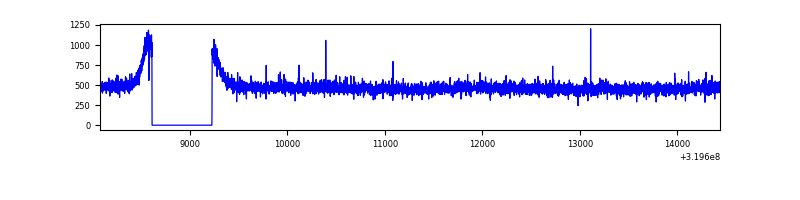 |
| B | 6354 | 5739 | 28 | 28 | 0.44% | 0.49% | 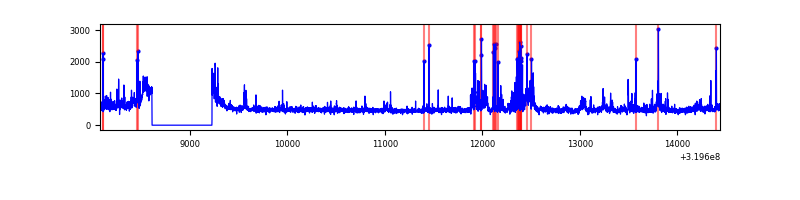 |
| C | 6354 | 5739 | 1 | 1 | 0.02% | 0.02% | 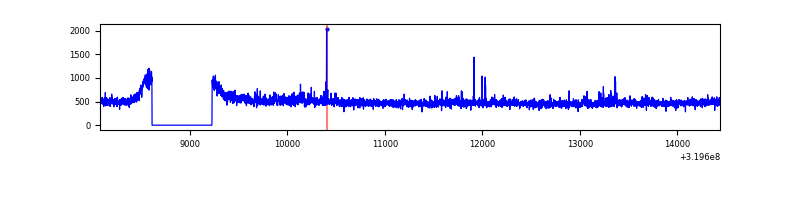 |
| D | 6355 | 5740 | 73 | 73 | 1.15% | 1.27% | 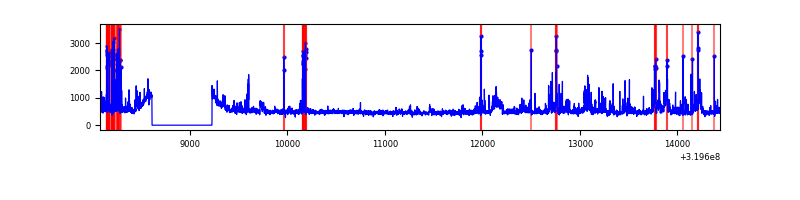 |
Top three noisy pixels from each quadrant. If the there are fewer than three noisy pixels in the level2.evt file, extra rows are filled as -1
| Pixel properties | Quadrant properties | ||||||
|---|---|---|---|---|---|---|---|
| Quadrant | DetID | PixID | Counts | Sigma | Mean | Median | Sigma |
| A | 13 | 254 | 10607 | 68.13 | 710 | 694 | 145.5 |
| A | 3 | 137 | 6381 | 39.09 | 710 | 694 | 145.5 |
| A | 0 | 226 | 5923 | 35.94 | 710 | 694 | 145.5 |
| B | 0 | 229 | 143148 | 1050.49 | 700 | 684 | 135.6 |
| B | 3 | 64 | 123833 | 908.07 | 700 | 684 | 135.6 |
| B | 15 | 33 | 95300 | 697.67 | 700 | 684 | 135.6 |
| C | 14 | 238 | 105364 | 650.45 | 679 | 684 | 160.9 |
| C | 7 | 247 | 66035 | 406.07 | 679 | 684 | 160.9 |
| C | 10 | 9 | 33132 | 201.62 | 679 | 684 | 160.9 |
| D | 1 | 52 | 360097 | 2128.93 | 687 | 667 | 168.8 |
| D | 7 | 238 | 108753 | 640.2 | 687 | 667 | 168.8 |
| D | 12 | 227 | 96882 | 569.89 | 687 | 667 | 168.8 |
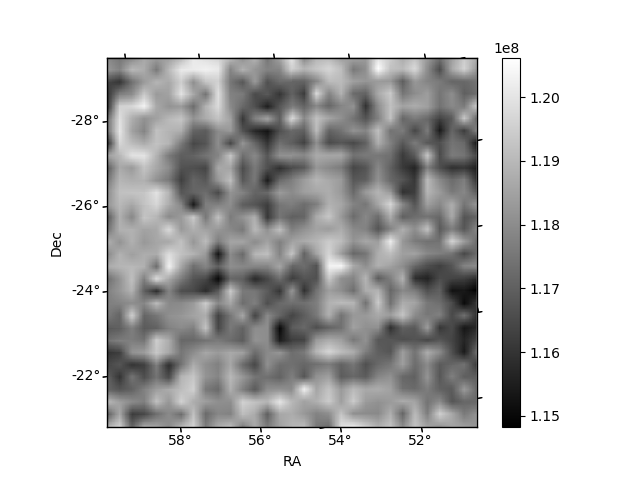
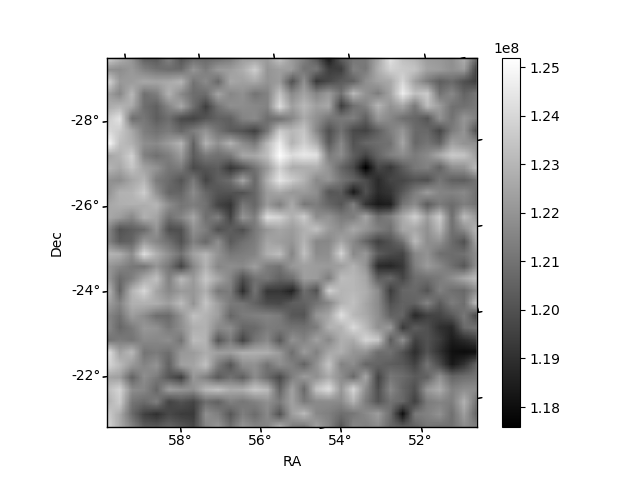
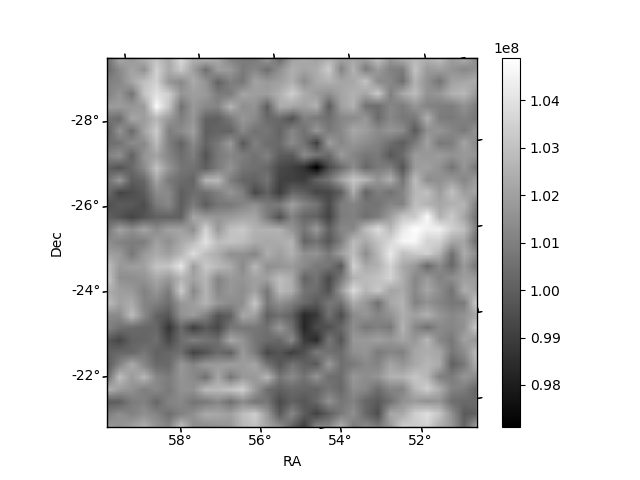
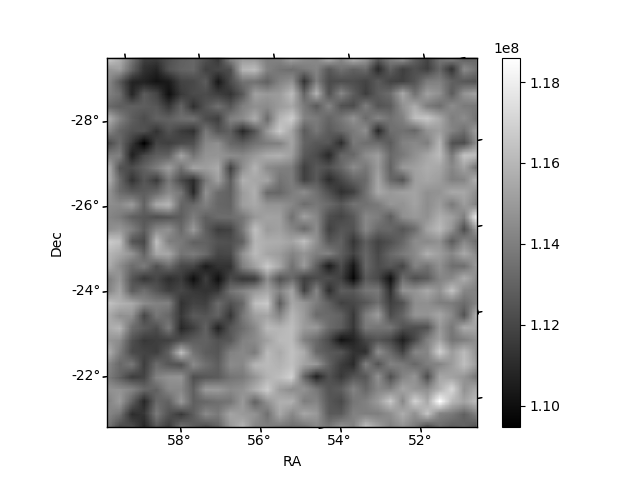
Histogram calculated using DETX and DETY for each event in the final _common_clean file
| Quadrant A |  |
 |
Quadrant B |
|---|---|---|---|
| Quadrant D |  |
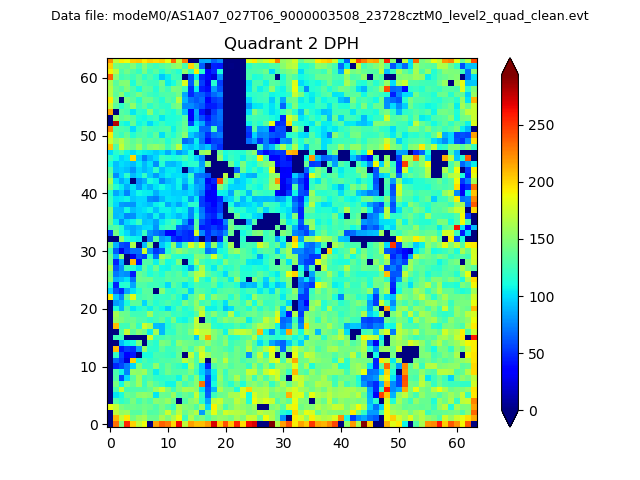 |
Quadrant C |
| Plot type | Count rate plots | Images |
|---|---|---|
| Comparison with Poisson distribution Blue bars denote a histogram of data divided into 1 sec bins. Red curve is a Poisson curve with rate = median count rate of data. |
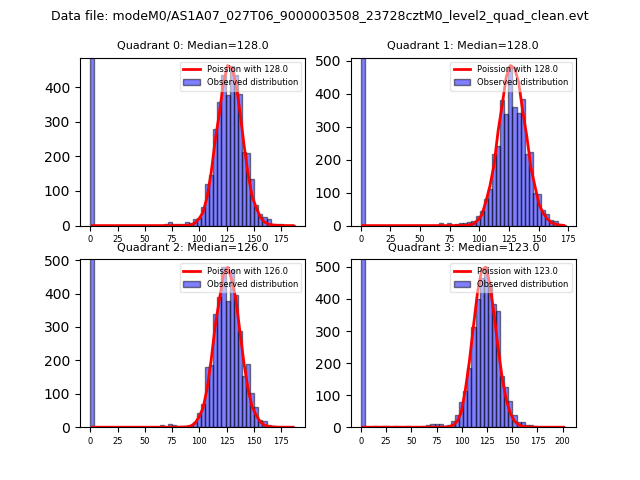 |
 |
| Quadrant-wise count rates Data is divided into 100 sec bins |
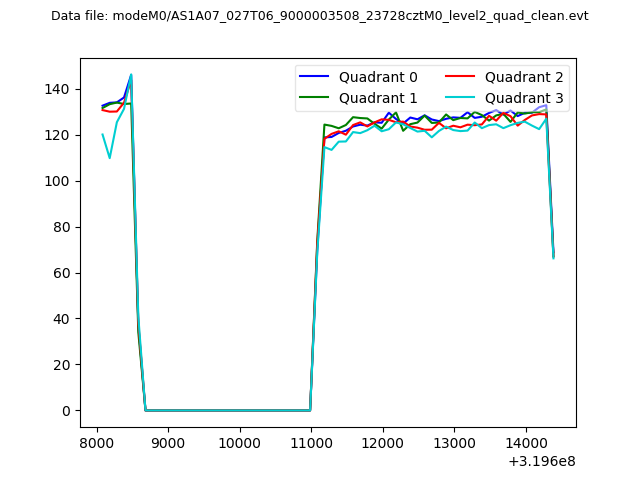 |
|
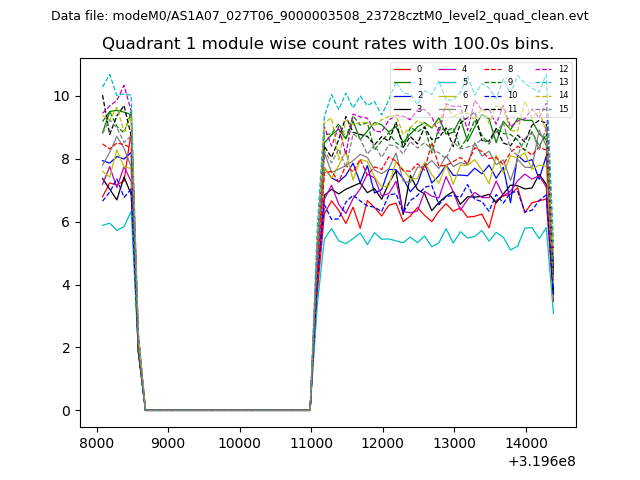
| Module-wise count rates for Quadrant A Data is divided into 100 sec bins |
 |
 |
| Module-wise count rates for Quadrant B Data is divided into 100 sec bins |
 |
 |
| Module-wise count rates for Quadrant C Data is divided into 100 sec bins |
 |
 |
| Module-wise count rates for Quadrant D Data is divided into 100 sec bins |
 |
 |
| Parameter | Plot |
|---|---|
| CZT HV Monitor | 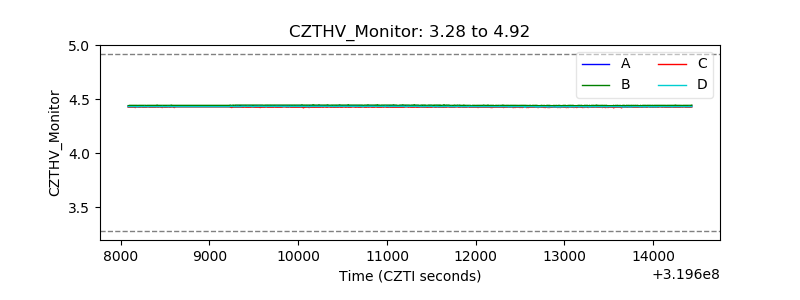 |
| D_VDD | 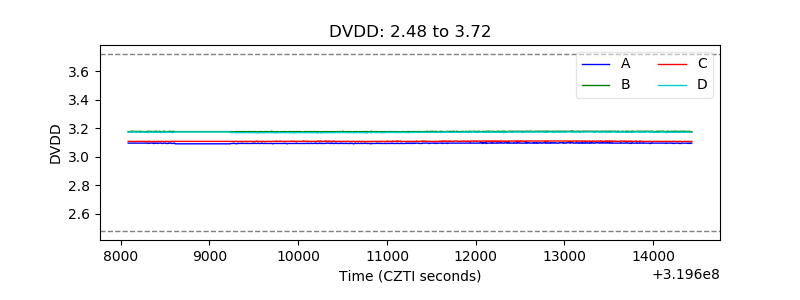 |
| Temperature 1 | 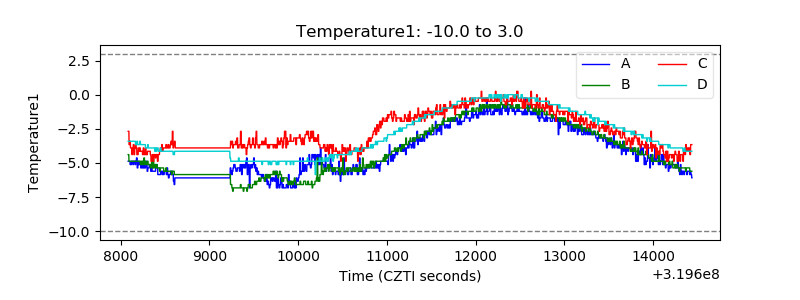 |
| Veto HV Monitor |  |
| Veto LLD | 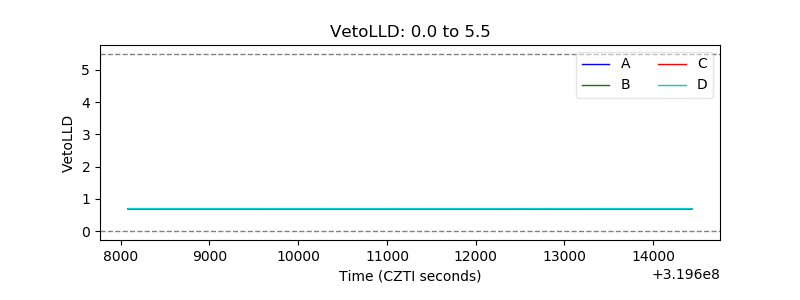 |
| Alpha Counter | 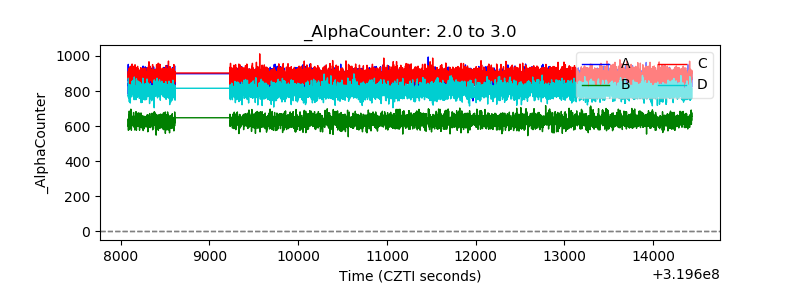 |
| _CPM_Rate | 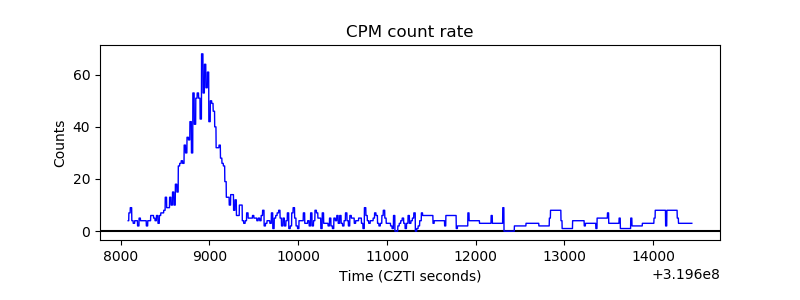 |
| CZT Counter | 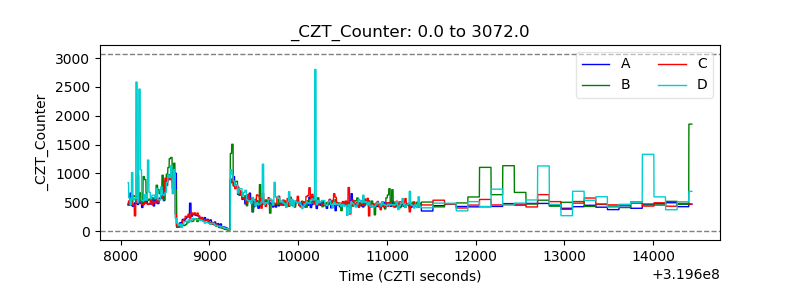 |
| +2.5 Volts monitor |  |
| +5 Volts monitor |  |
| _ROLL_ROT | 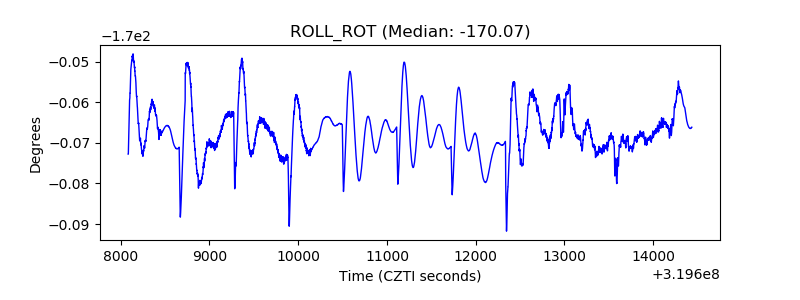 |
| _Roll_DEC | 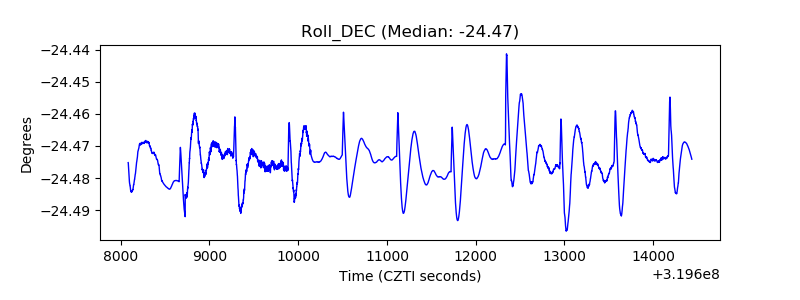 |
| _Roll_RA | 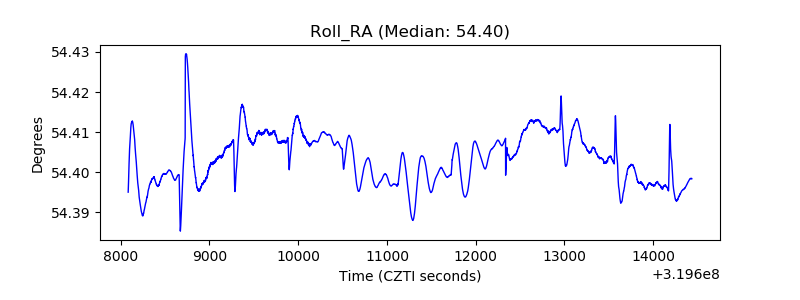 |
| Veto Counter | 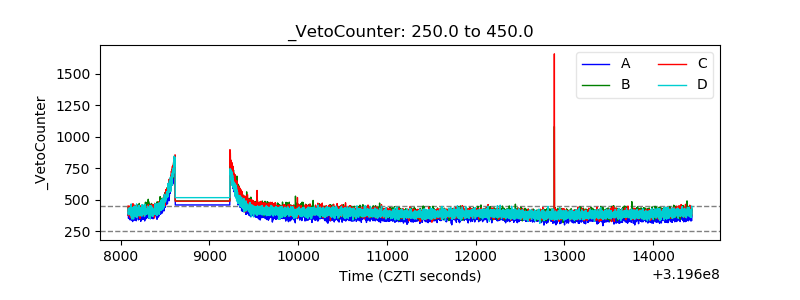 |