| Param | Original file | Final file |
|---|---|---|
| Filename | modeM0/AS1A07_027T08_9000003514cztM0_level2.fits | modeM0/AS1A07_027T08_9000003514cztM0_level2_quad_clean.evt |
| Size (bytes) | 181,249,920 | 111,611,520 |
| Size | 172.9 MB | 106.4 MB |
| Events in quadrant A | 1,141,878 | 570,142 |
| Events in quadrant B | 1,094,752 | 574,917 |
| Events in quadrant C | 1,095,184 | 539,325 |
| Events in quadrant D | 947,278 | 483,295 |
| Mode M9 | |||
|---|---|---|---|
| Quadrant | BADHDUFLAG | Total packets | Discarded packets |
| A | 0 | 49 | 0 |
| B | 0 | 49 | 0 |
| C | 0 | 49 | 0 |
| D | 0 | 49 | 0 |
| Mode SS | |||
|---|---|---|---|
| Quadrant | BADHDUFLAG | Total packets | Discarded packets |
| A | 0 | 362 | 0 |
| B | 0 | 362 | 0 |
| C | 0 | 362 | 0 |
| D | 0 | 362 | 0 |
| Mode M0 | |||
|---|---|---|---|
| Quadrant | BADHDUFLAG | Total packets | Discarded packets |
| A | 0 | 36665 | 0 |
| B | 0 | 39437 | 0 |
| C | 0 | 37628 | 0 |
| D | 0 | 48339 | 0 |
| Quadrant | Total seconds | Saturated seconds | Saturation percentage |
|---|---|---|---|
| A | 17552 | 120 | 0.683683% |
| B | 17552 | 185 | 1.054011% |
| C | 17552 | 330 | 1.880128% |
| D | 17552 | 302 | 1.720602% |
Noise dominated data is calculated using 1-second bins in cleaned event files. If a bin has >2000 counts, and if more than 50% of those come from <1% of pixels, then it is considered to be noise-dominated and hence unusable.
| Quadrant | # 1 sec bins | Bins with >0 counts | Bins with >2000 counts | High rate bins dominated by noise | Noise dominated (total time) | Noise dominated (detector-on time) | Marked lightcurve |
|---|---|---|---|---|---|---|---|
| A | 22532 | 17549 | 0 | 0 | 0.00% | 0.00% |  |
| B | 22532 | 17548 | 0 | 0 | 0.00% | 0.00% |  |
| C | 22532 | 17531 | 0 | 0 | 0.00% | 0.00% |  |
| D | 22532 | 17547 | 0 | 0 | 0.00% | 0.00% |  |
Top three noisy pixels from each quadrant. If the there are fewer than three noisy pixels in the level2.evt file, extra rows are filled as -1
| Pixel properties | Quadrant properties | ||||||
|---|---|---|---|---|---|---|---|
| Quadrant | DetID | PixID | Counts | Sigma | Mean | Median | Sigma |
| A | 0 | 29 | 1199 | 12.38 | 297 | 281 | 74.1 |
| A | 9 | 19 | 895 | 8.28 | 297 | 281 | 74.1 |
| A | 7 | 110 | 891 | 8.23 | 297 | 281 | 74.1 |
| B | 2 | 9 | 880 | 10.38 | 290 | 279 | 57.9 |
| B | 2 | 8 | 771 | 8.49 | 290 | 279 | 57.9 |
| B | 5 | 255 | 727 | 7.74 | 290 | 279 | 57.9 |
| C | 9 | 209 | 746 | 6.34 | 289 | 271 | 75.0 |
| C | 12 | 250 | 733 | 6.16 | 289 | 271 | 75.0 |
| C | 12 | 241 | 729 | 6.11 | 289 | 271 | 75.0 |
| D | 6 | 231 | 755 | 6.95 | 270 | 246 | 73.2 |
| D | 15 | 46 | 709 | 6.32 | 270 | 246 | 73.2 |
| D | 3 | 14 | 673 | 5.83 | 270 | 246 | 73.2 |
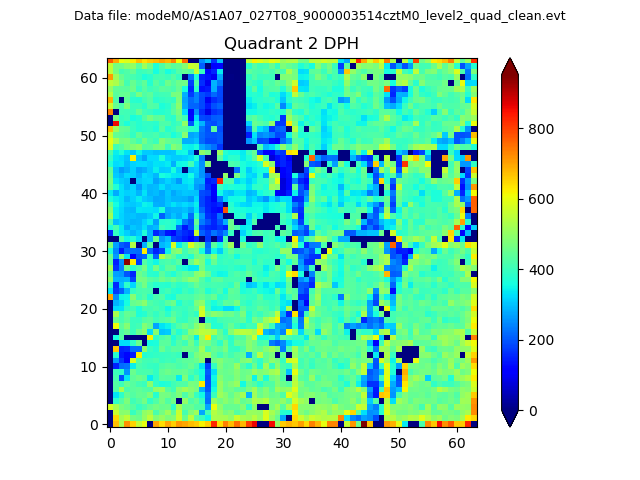
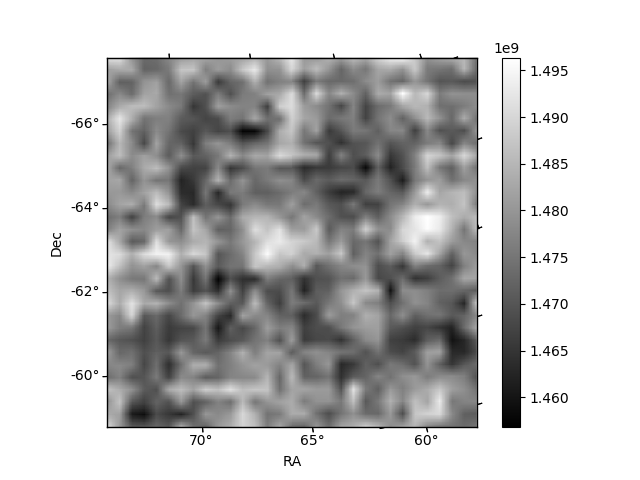
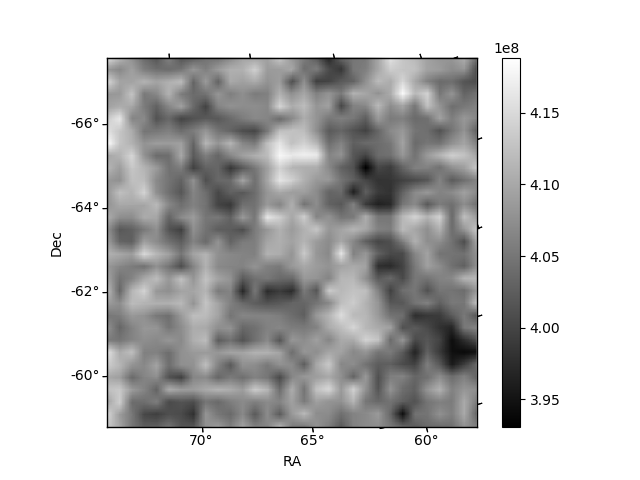
Histogram calculated using DETX and DETY for each event in the final _common_clean file
| Quadrant A | 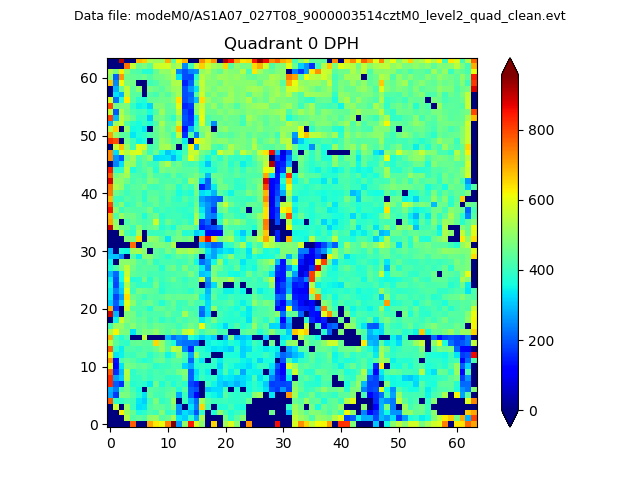 |
 |
Quadrant B |
|---|---|---|---|
| Quadrant D | 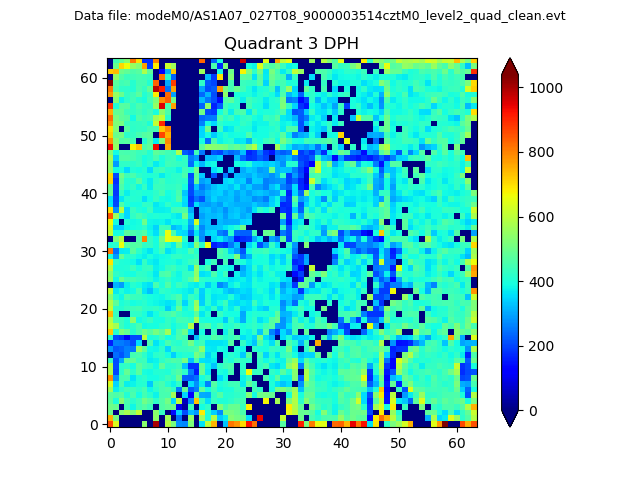 |
 |
Quadrant C |
| Plot type | Count rate plots | Images |
|---|---|---|
| Comparison with Poisson distribution Blue bars denote a histogram of data divided into 1 sec bins. Red curve is a Poisson curve with rate = median count rate of data. |
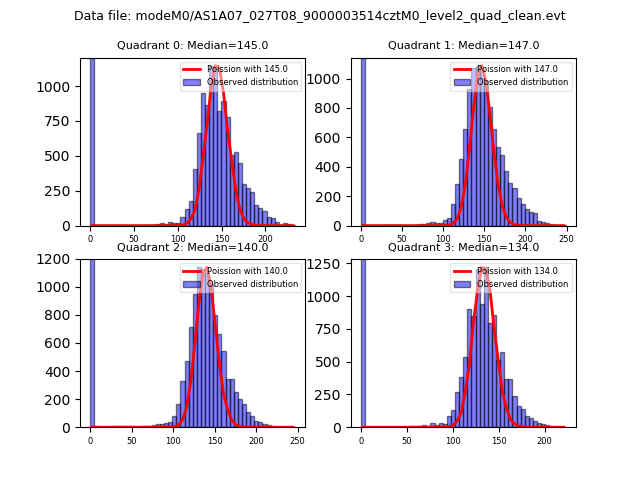 |
 |
| Quadrant-wise count rates Data is divided into 100 sec bins |
 |
|
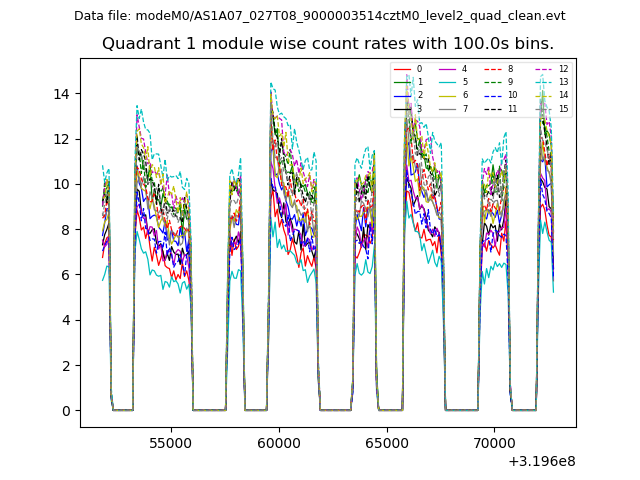
| Module-wise count rates for Quadrant A Data is divided into 100 sec bins |
 |
 |
| Module-wise count rates for Quadrant B Data is divided into 100 sec bins |
 |
 |
| Module-wise count rates for Quadrant C Data is divided into 100 sec bins |
 |
 |
| Module-wise count rates for Quadrant D Data is divided into 100 sec bins |
 |
 |
| Parameter | Plot |
|---|---|
| CZT HV Monitor |  |
| D_VDD | 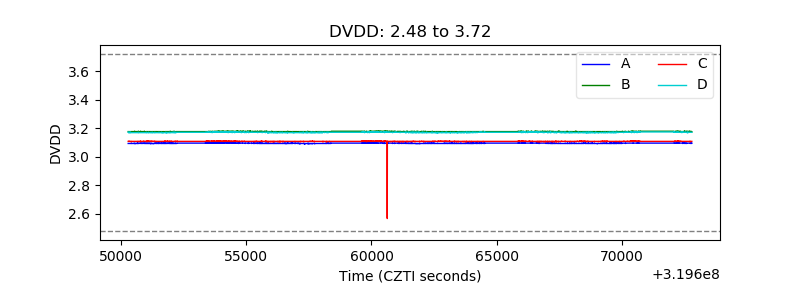 |
| Temperature 1 |  |
| Veto HV Monitor | 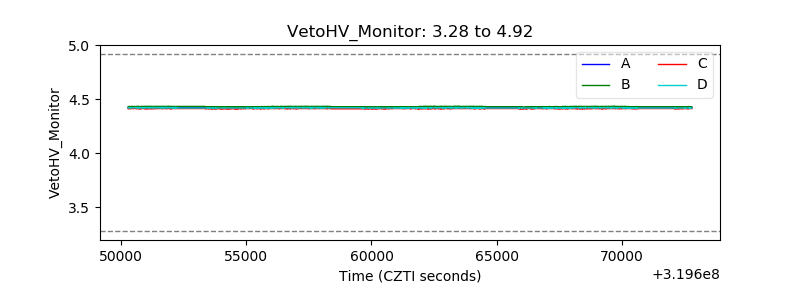 |
| Veto LLD | 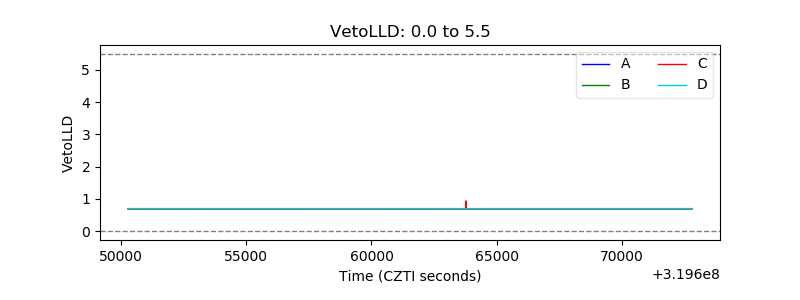 |
| Alpha Counter |  |
| _CPM_Rate |  |
| CZT Counter |  |
| +2.5 Volts monitor |  |
| +5 Volts monitor |  |
| _ROLL_ROT |  |
| _Roll_DEC |  |
| _Roll_RA |  |
| Veto Counter |  |