| Param | Original file | Final file |
|---|---|---|
| Filename | modeM0/AS1A07_027T09_9000003512cztM0_level2.fits | modeM0/AS1A07_027T09_9000003512cztM0_level2_quad_clean.evt |
| Size (bytes) | 135,403,200 | 120,539,520 |
| Size | 129.1 MB | 115.0 MB |
| Events in quadrant A | 828,276 | 703,406 |
| Events in quadrant B | 783,270 | 677,772 |
| Events in quadrant C | 812,042 | 678,410 |
| Events in quadrant D | 684,854 | 597,796 |
| Mode M9 | |||
|---|---|---|---|
| Quadrant | BADHDUFLAG | Total packets | Discarded packets |
| A | 0 | 23 | 0 |
| B | 0 | 23 | 0 |
| C | 0 | 23 | 0 |
| D | 0 | 23 | 0 |
| Mode M0 | |||
|---|---|---|---|
| Quadrant | BADHDUFLAG | Total packets | Discarded packets |
| A | 0 | 29502 | 0 |
| B | 0 | 34731 | 0 |
| C | 0 | 29739 | 0 |
| D | 0 | 53359 | 0 |
| Mode SS | |||
|---|---|---|---|
| Quadrant | BADHDUFLAG | Total packets | Discarded packets |
| A | 0 | 296 | 0 |
| B | 0 | 296 | 0 |
| C | 0 | 296 | 0 |
| D | 0 | 296 | 0 |
| Quadrant | Total seconds | Saturated seconds | Saturation percentage |
|---|---|---|---|
| A | 14363 | 151 | 1.051312% |
| B | 14363 | 468 | 3.258372% |
| C | 14363 | 208 | 1.448165% |
| D | 14363 | 563 | 3.919794% |
Noise dominated data is calculated using 1-second bins in cleaned event files. If a bin has >2000 counts, and if more than 50% of those come from <1% of pixels, then it is considered to be noise-dominated and hence unusable.
| Quadrant | # 1 sec bins | Bins with >0 counts | Bins with >2000 counts | High rate bins dominated by noise | Noise dominated (total time) | Noise dominated (detector-on time) | Marked lightcurve |
|---|---|---|---|---|---|---|---|
| A | 16713 | 14360 | 0 | 0 | 0.00% | 0.00% |  |
| B | 16713 | 14355 | 0 | 0 | 0.00% | 0.00% |  |
| C | 16713 | 14360 | 0 | 0 | 0.00% | 0.00% |  |
| D | 16713 | 14358 | 0 | 0 | 0.00% | 0.00% |  |
Top three noisy pixels from each quadrant. If the there are fewer than three noisy pixels in the level2.evt file, extra rows are filled as -1
| Pixel properties | Quadrant properties | ||||||
|---|---|---|---|---|---|---|---|
| Quadrant | DetID | PixID | Counts | Sigma | Mean | Median | Sigma |
| A | 0 | 29 | 781 | 10.39 | 215 | 202 | 55.7 |
| A | 7 | 110 | 645 | 7.95 | 215 | 202 | 55.7 |
| A | 0 | 30 | 624 | 7.57 | 215 | 202 | 55.7 |
| B | 2 | 9 | 651 | 10.61 | 206 | 196 | 42.9 |
| B | 2 | 8 | 544 | 8.11 | 206 | 196 | 42.9 |
| B | 14 | 254 | 534 | 7.88 | 206 | 196 | 42.9 |
| C | 3 | 234 | 572 | 6.47 | 214 | 199 | 57.6 |
| C | 9 | 209 | 561 | 6.28 | 214 | 199 | 57.6 |
| C | 3 | 126 | 560 | 6.27 | 214 | 199 | 57.6 |
| D | 3 | 14 | 538 | 6.71 | 195 | 177 | 53.8 |
| D | 15 | 46 | 497 | 5.95 | 195 | 177 | 53.8 |
| D | 6 | 67 | 493 | 5.87 | 195 | 177 | 53.8 |
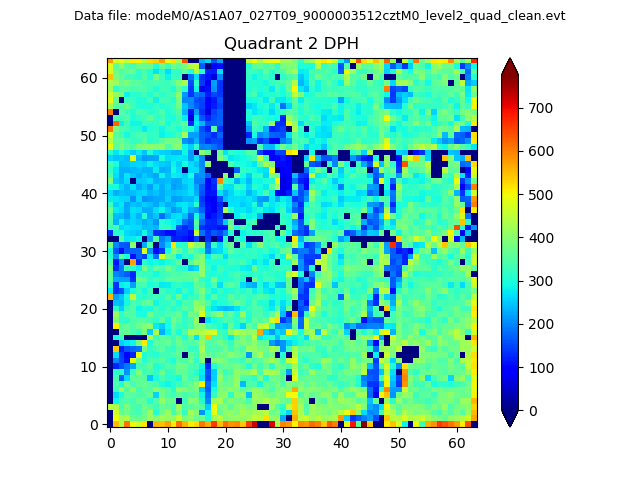
Histogram calculated using DETX and DETY for each event in the final _common_clean file
| Quadrant A |  |
 |
Quadrant B |
|---|---|---|---|
| Quadrant D |  |
 |
Quadrant C |
| Plot type | Count rate plots | Images |
|---|---|---|
| Comparison with Poisson distribution Blue bars denote a histogram of data divided into 1 sec bins. Red curve is a Poisson curve with rate = median count rate of data. |
 |
 |
| Quadrant-wise count rates Data is divided into 100 sec bins |
 |
|
| Module-wise count rates for Quadrant A Data is divided into 100 sec bins |
 |
 |
| Module-wise count rates for Quadrant B Data is divided into 100 sec bins |
 |
 |
| Module-wise count rates for Quadrant C Data is divided into 100 sec bins |
 |
 |
| Module-wise count rates for Quadrant D Data is divided into 100 sec bins |
 |
 |
| Parameter | Plot |
|---|---|
| CZT HV Monitor | 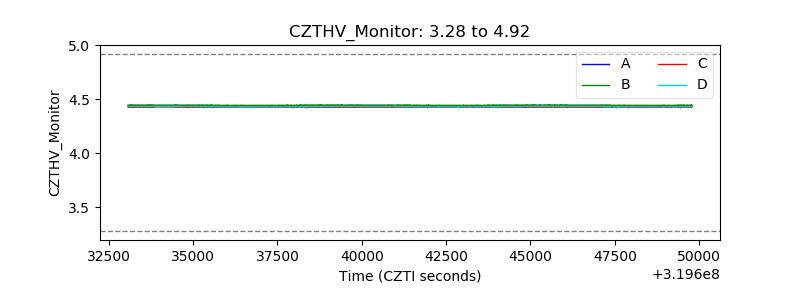 |
| D_VDD |  |
| Temperature 1 |  |
| Veto HV Monitor | 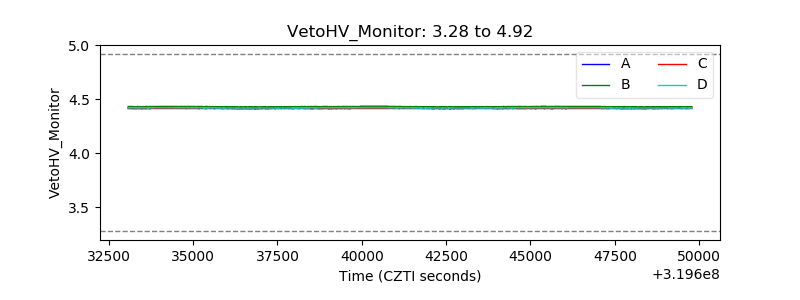 |
| Veto LLD | 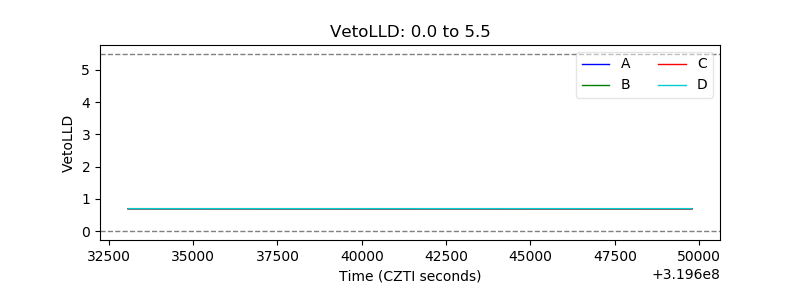 |
| Alpha Counter |  |
| _CPM_Rate |  |
| CZT Counter |  |
| +2.5 Volts monitor | 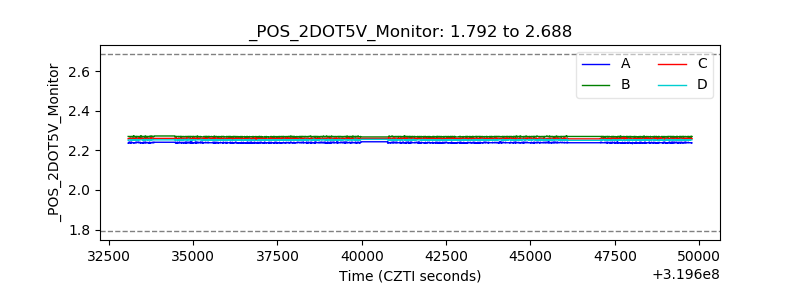 |
| +5 Volts monitor |  |
| _ROLL_ROT |  |
| _Roll_DEC |  |
| _Roll_RA | 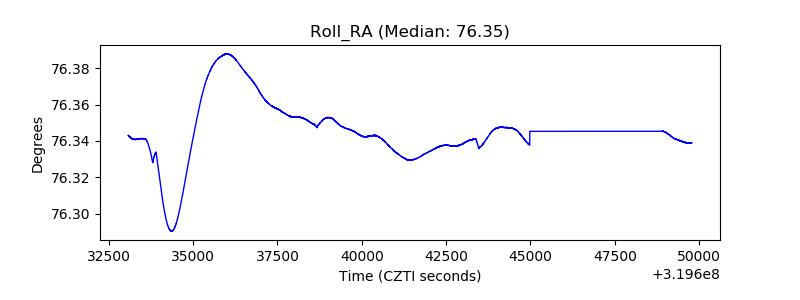 |
| Veto Counter |  |