| Param | Original file | Final file |
|---|---|---|
| Filename | modeM0/AS1A07_027T09_9000003512_23734cztM0_level2.evt | modeM0/AS1A07_027T09_9000003512_23734cztM0_level2_quad_clean.evt |
| Size (bytes) | 196,871,040 | 47,465,280 |
| Size | 187.8 MB | 45.3 MB |
| Events in quadrant A | 1,122,065 | 322,731 |
| Events in quadrant B | 1,344,180 | 323,534 |
| Events in quadrant C | 1,128,615 | 312,304 |
| Events in quadrant D | 2,197,331 | 300,796 |
| Mode M0 | |||
|---|---|---|---|
| Quadrant | BADHDUFLAG | Total packets | Discarded packets |
| A | 0 | 5045 | 0 |
| B | 0 | 5655 | 0 |
| C | 0 | 5059 | 0 |
| D | 0 | 8339 | 0 |
| Mode SS | |||
|---|---|---|---|
| Quadrant | BADHDUFLAG | Total packets | Discarded packets |
| A | 0 | 50 | 0 |
| B | 0 | 50 | 0 |
| C | 0 | 50 | 0 |
| D | 0 | 50 | 0 |
| Quadrant | Total seconds | Saturated seconds | Saturation percentage |
|---|---|---|---|
| A | 2472 | 0 | 0.000000% |
| B | 2473 | 14 | 0.566114% |
| C | 2473 | 7 | 0.283057% |
| D | 2473 | 52 | 2.102709% |
Noise dominated data is calculated using 1-second bins in cleaned event files. If a bin has >2000 counts, and if more than 50% of those come from <1% of pixels, then it is considered to be noise-dominated and hence unusable.
| Quadrant | # 1 sec bins | Bins with >0 counts | Bins with >2000 counts | High rate bins dominated by noise | Noise dominated (total time) | Noise dominated (detector-on time) | Marked lightcurve |
|---|---|---|---|---|---|---|---|
| A | 2472 | 2472 | 0 | 0 | 0.00% | 0.00% | 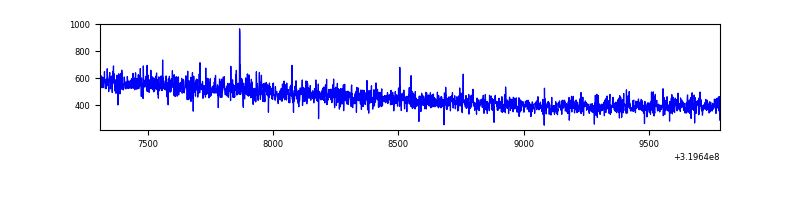 |
| B | 2473 | 2473 | 13 | 13 | 0.53% | 0.53% | 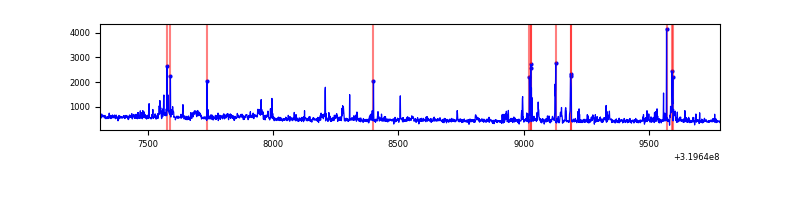 |
| C | 2473 | 2473 | 0 | 0 | 0.00% | 0.00% | 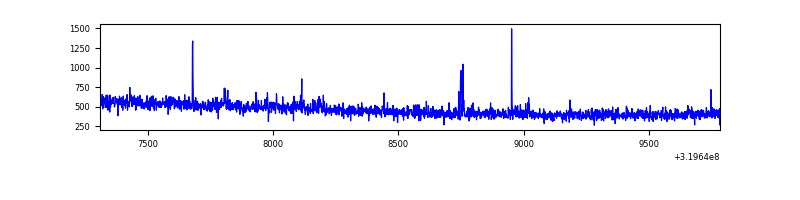 |
| D | 2473 | 2473 | 61 | 61 | 2.47% | 2.47% | 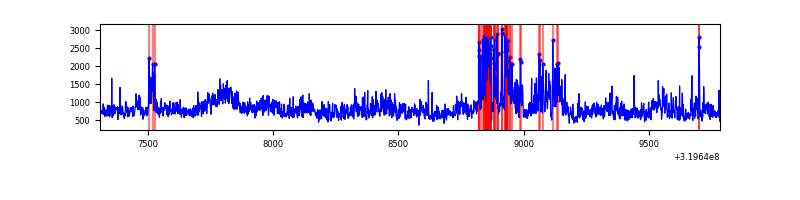 |
Top three noisy pixels from each quadrant. If the there are fewer than three noisy pixels in the level2.evt file, extra rows are filled as -1
| Pixel properties | Quadrant properties | ||||||
|---|---|---|---|---|---|---|---|
| Quadrant | DetID | PixID | Counts | Sigma | Mean | Median | Sigma |
| A | 13 | 254 | 4568 | 70.11 | 290 | 284 | 61.1 |
| A | 0 | 226 | 2617 | 38.18 | 290 | 284 | 61.1 |
| A | 3 | 137 | 2509 | 36.41 | 290 | 284 | 61.1 |
| B | 0 | 229 | 110742 | 1931.39 | 287 | 281 | 57.2 |
| B | 3 | 64 | 47459 | 824.9 | 287 | 281 | 57.2 |
| B | 0 | 189 | 37242 | 646.26 | 287 | 281 | 57.2 |
| C | 14 | 238 | 43264 | 657.46 | 271 | 273 | 65.4 |
| C | 7 | 247 | 19958 | 301.04 | 271 | 273 | 65.4 |
| C | 2 | 16 | 7686 | 113.37 | 271 | 273 | 65.4 |
| D | 8 | 195 | 769779 | 11279.88 | 275 | 266 | 68.2 |
| D | 1 | 52 | 312730 | 4580.24 | 275 | 266 | 68.2 |
| D | 13 | 174 | 32285 | 469.35 | 275 | 266 | 68.2 |
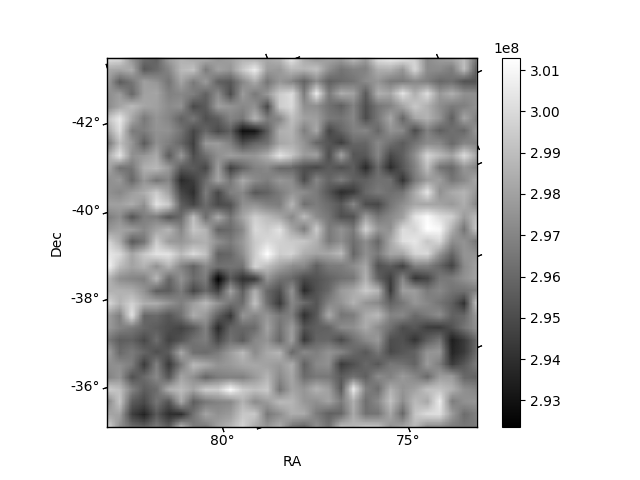
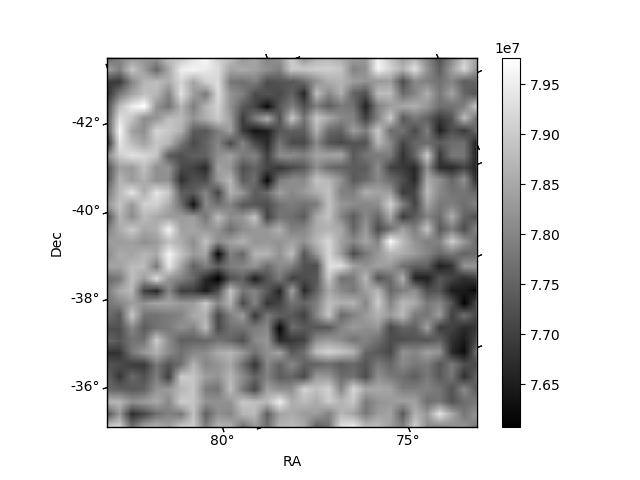
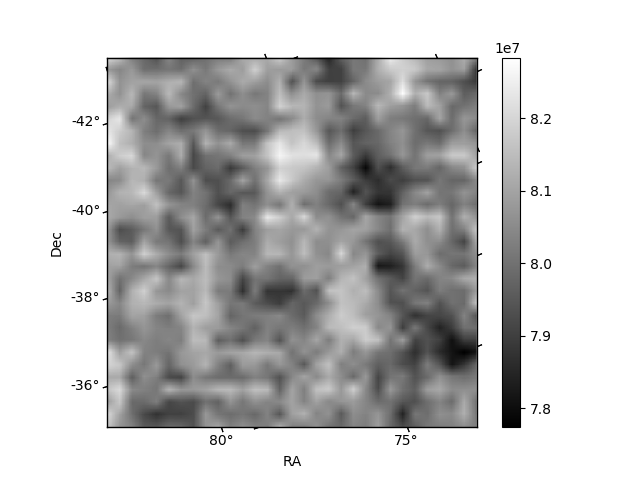
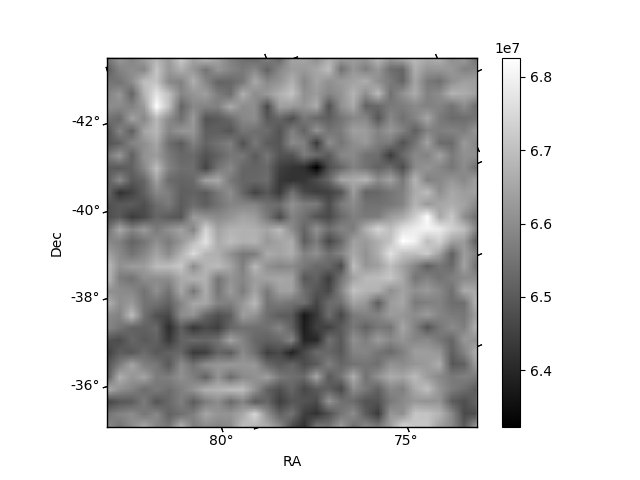
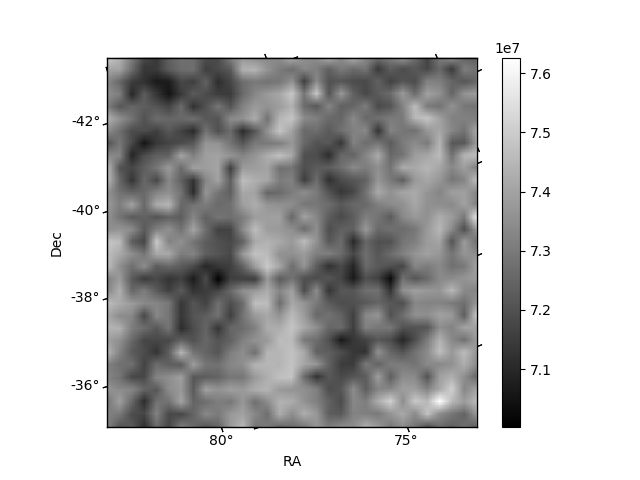
Histogram calculated using DETX and DETY for each event in the final _common_clean file
| Quadrant A | 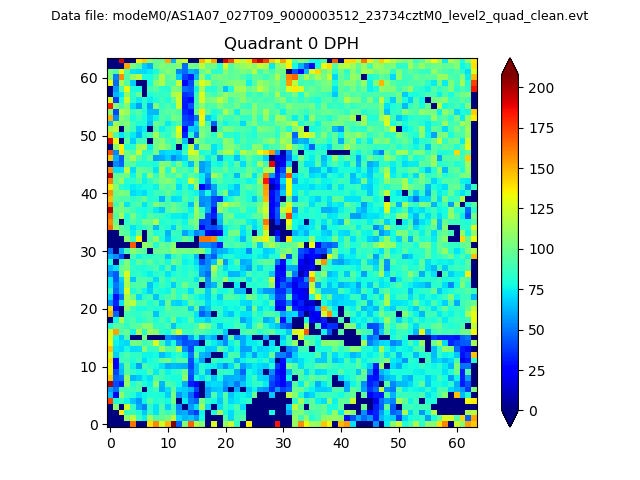 |
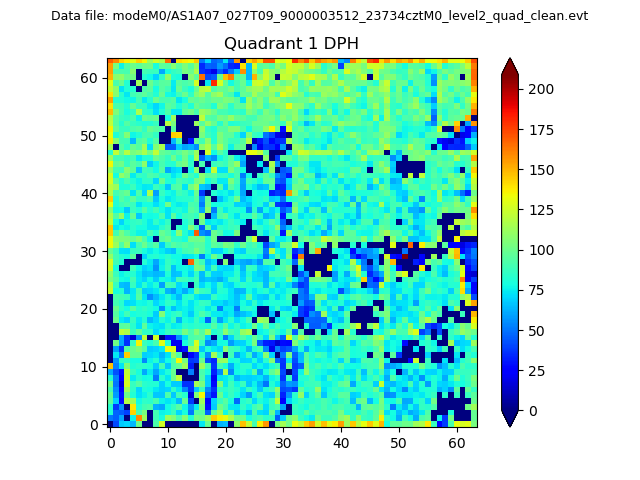 |
Quadrant B |
|---|---|---|---|
| Quadrant D | 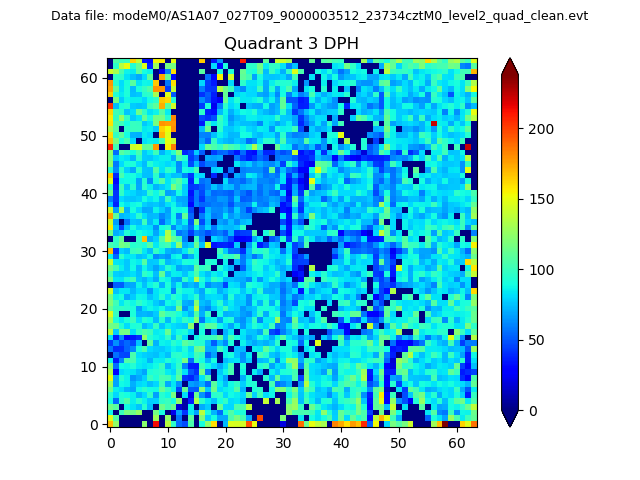 |
 |
Quadrant C |
| Plot type | Count rate plots | Images |
|---|---|---|
| Comparison with Poisson distribution Blue bars denote a histogram of data divided into 1 sec bins. Red curve is a Poisson curve with rate = median count rate of data. |
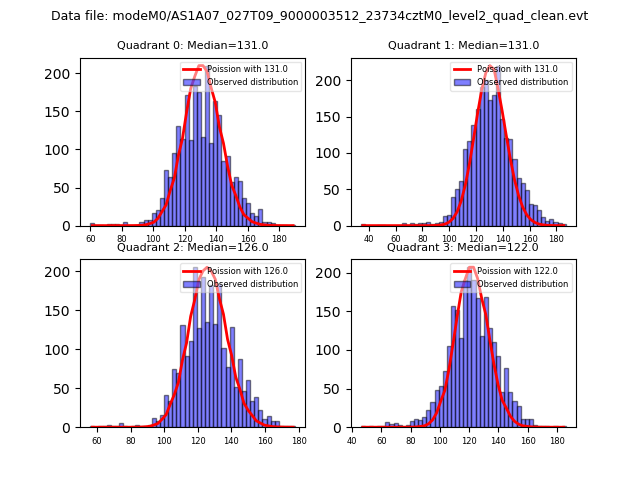 |
 |
| Quadrant-wise count rates Data is divided into 100 sec bins |
 |
|
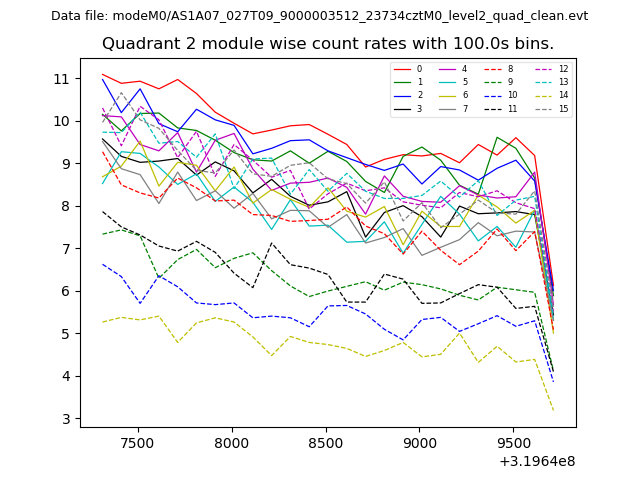
| Module-wise count rates for Quadrant A Data is divided into 100 sec bins |
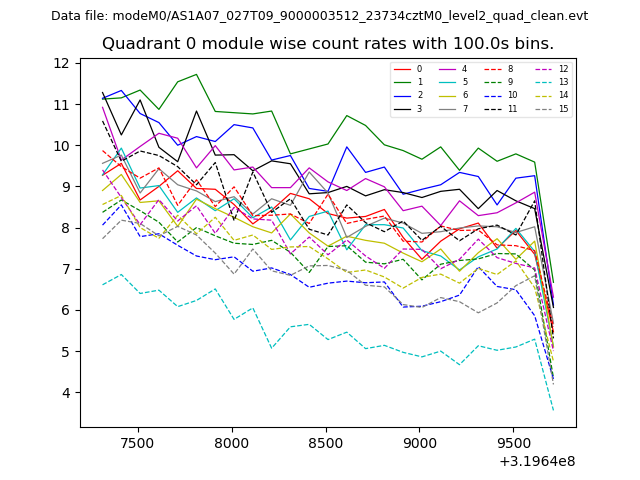 |
 |
| Module-wise count rates for Quadrant B Data is divided into 100 sec bins |
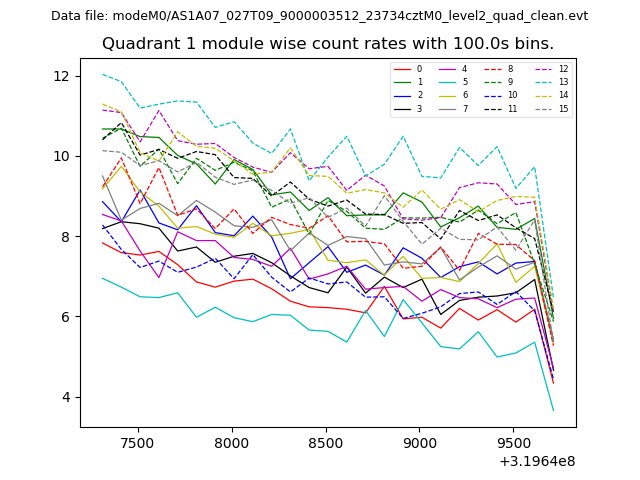 |
 |
| Module-wise count rates for Quadrant C Data is divided into 100 sec bins |
 |
 |
| Module-wise count rates for Quadrant D Data is divided into 100 sec bins |
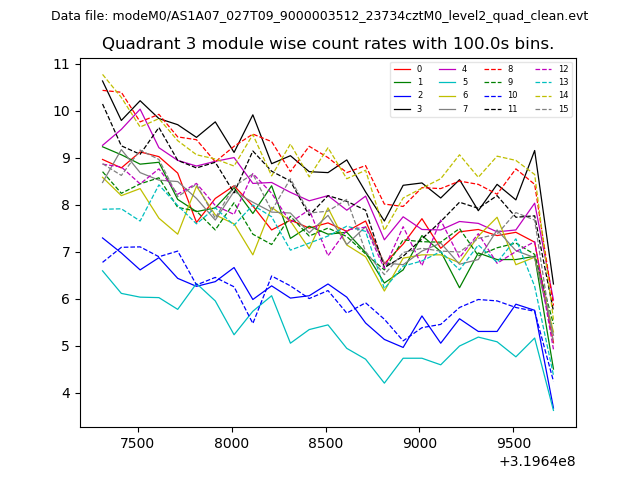 |
 |
| Parameter | Plot |
|---|---|
| CZT HV Monitor | 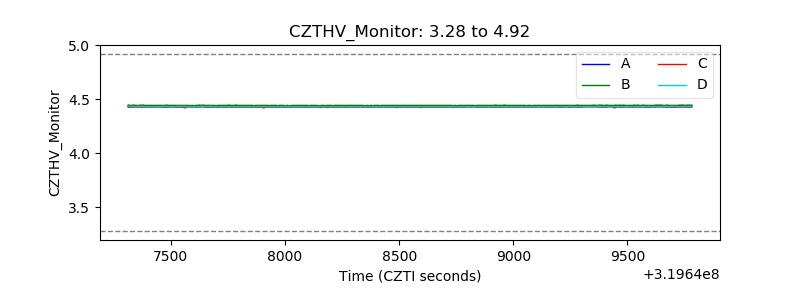 |
| D_VDD | 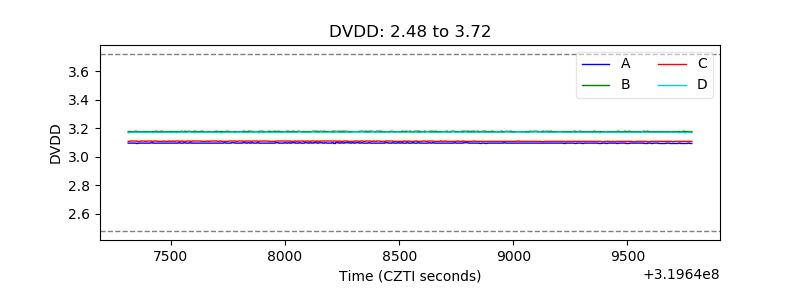 |
| Temperature 1 | 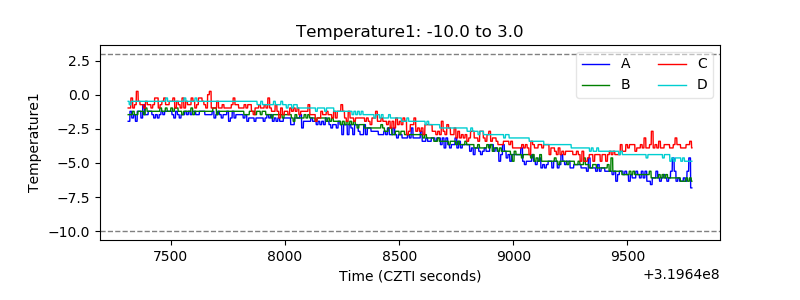 |
| Veto HV Monitor | 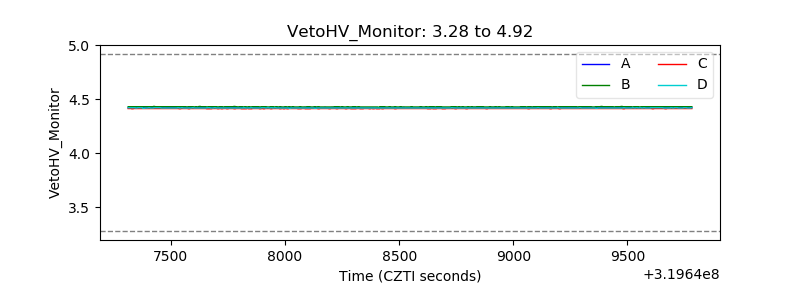 |
| Veto LLD | 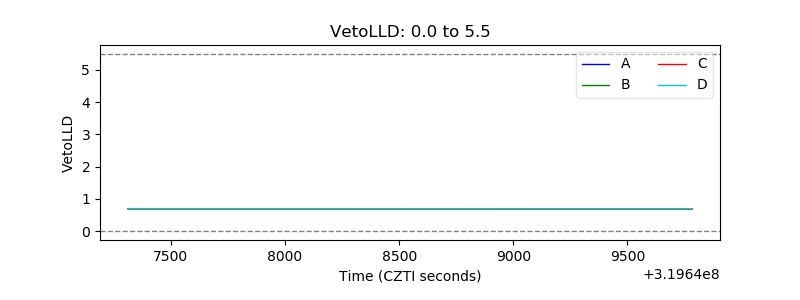 |
| Alpha Counter | 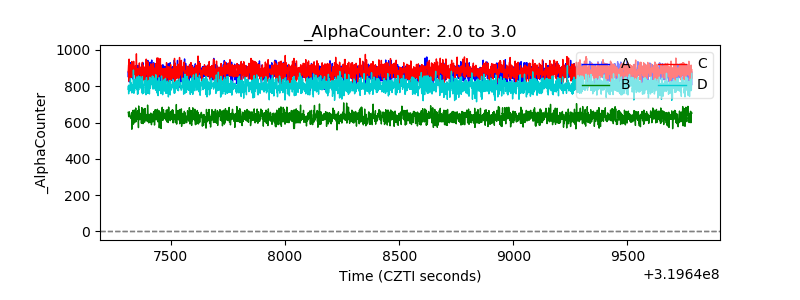 |
| _CPM_Rate | 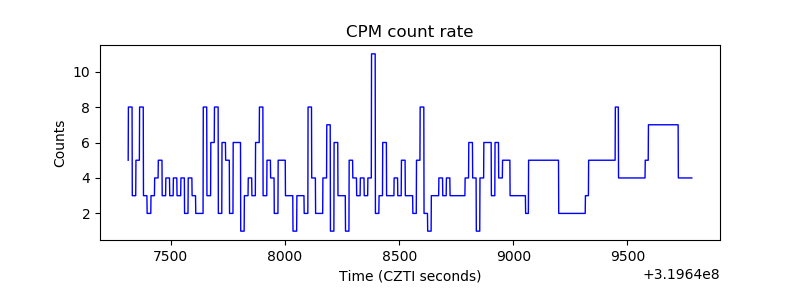 |
| CZT Counter | 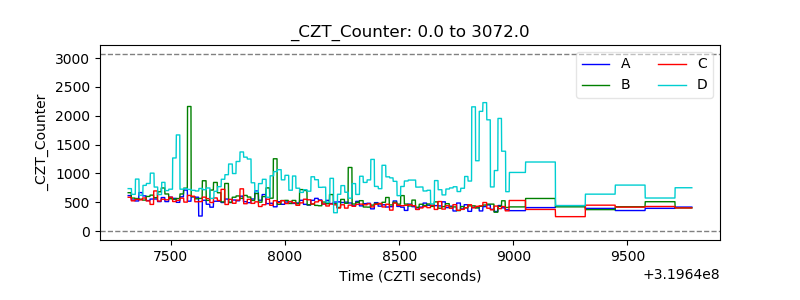 |
| +2.5 Volts monitor |  |
| +5 Volts monitor | 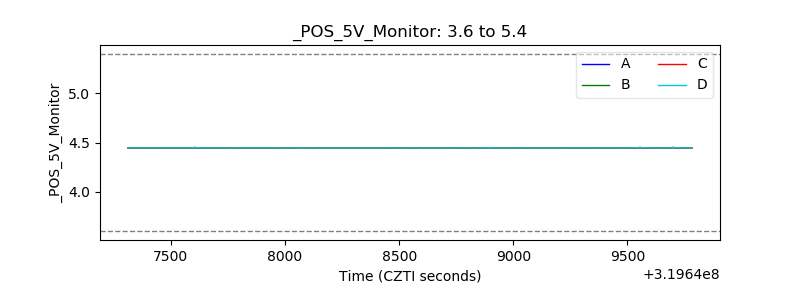 |
| _ROLL_ROT | 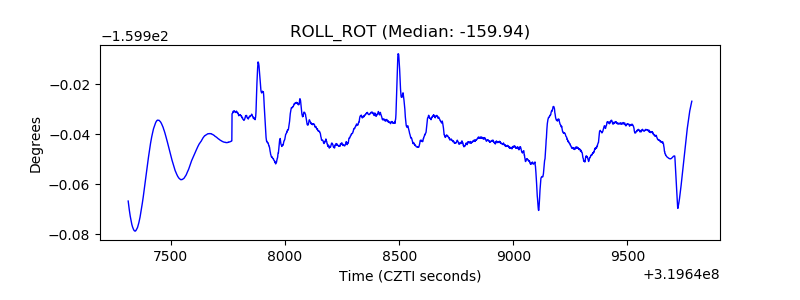 |
| _Roll_DEC | 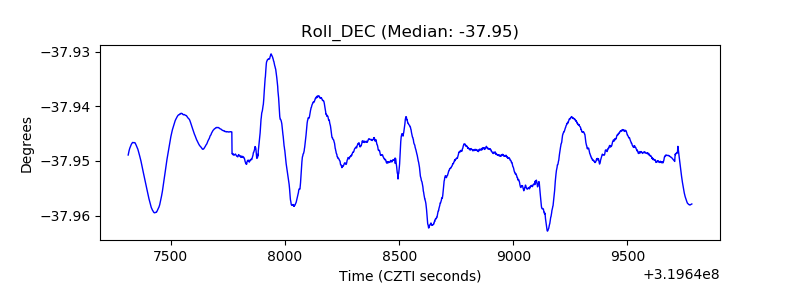 |
| _Roll_RA | 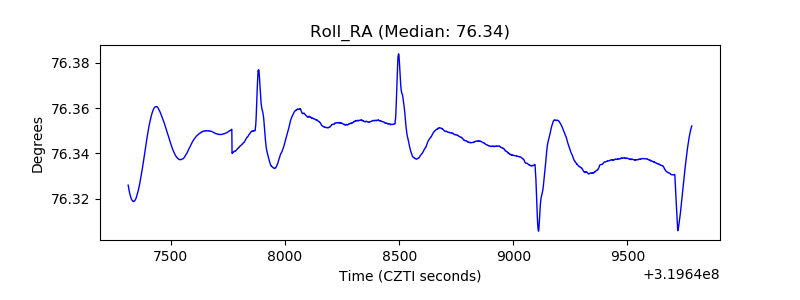 |
| Veto Counter | 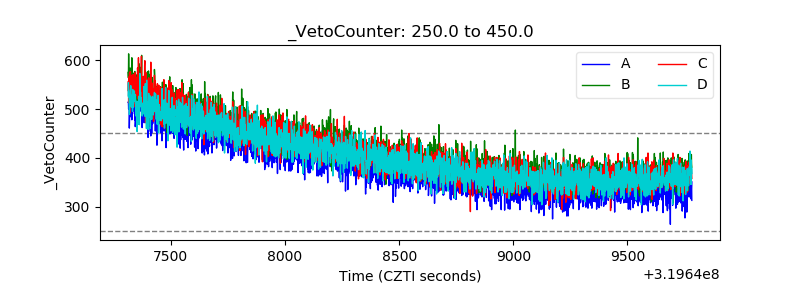 |