| Param | Original file | Final file |
|---|---|---|
| Filename | modeM0/AS1A07_027T14_9000003510cztM0_level2.fits | modeM0/AS1A07_027T14_9000003510cztM0_level2_quad_clean.evt |
| Size (bytes) | 138,836,160 | 132,698,880 |
| Size | 132.4 MB | 126.6 MB |
| Events in quadrant A | 847,950 | 787,748 |
| Events in quadrant B | 807,292 | 783,464 |
| Events in quadrant C | 829,682 | 759,000 |
| Events in quadrant D | 686,260 | 655,563 |
| Mode M0 | |||
|---|---|---|---|
| Quadrant | BADHDUFLAG | Total packets | Discarded packets |
| A | 0 | 30539 | 0 |
| B | 0 | 35014 | 0 |
| C | 0 | 30668 | 0 |
| D | 0 | 57403 | 0 |
| Mode SS | |||
|---|---|---|---|
| Quadrant | BADHDUFLAG | Total packets | Discarded packets |
| A | 0 | 304 | 0 |
| B | 0 | 304 | 0 |
| C | 0 | 304 | 0 |
| D | 0 | 304 | 0 |
| Mode M9 | |||
|---|---|---|---|
| Quadrant | BADHDUFLAG | Total packets | Discarded packets |
| A | 0 | 6 | 0 |
| B | 0 | 6 | 0 |
| C | 0 | 6 | 0 |
| D | 0 | 6 | 0 |
| Quadrant | Total seconds | Saturated seconds | Saturation percentage |
|---|---|---|---|
| A | 14955 | 270 | 1.805416% |
| B | 14955 | 495 | 3.309930% |
| C | 14955 | 311 | 2.079572% |
| D | 14955 | 2266 | 15.152123% |
Noise dominated data is calculated using 1-second bins in cleaned event files. If a bin has >2000 counts, and if more than 50% of those come from <1% of pixels, then it is considered to be noise-dominated and hence unusable.
| Quadrant | # 1 sec bins | Bins with >0 counts | Bins with >2000 counts | High rate bins dominated by noise | Noise dominated (total time) | Noise dominated (detector-on time) | Marked lightcurve |
|---|---|---|---|---|---|---|---|
| A | 15565 | 14954 | 0 | 0 | 0.00% | 0.00% |  |
| B | 15565 | 14950 | 0 | 0 | 0.00% | 0.00% |  |
| C | 15565 | 14953 | 0 | 0 | 0.00% | 0.00% |  |
| D | 15565 | 14951 | 0 | 0 | 0.00% | 0.00% |  |
Top three noisy pixels from each quadrant. If the there are fewer than three noisy pixels in the level2.evt file, extra rows are filled as -1
| Pixel properties | Quadrant properties | ||||||
|---|---|---|---|---|---|---|---|
| Quadrant | DetID | PixID | Counts | Sigma | Mean | Median | Sigma |
| A | 0 | 29 | 784 | 10.03 | 220 | 206 | 57.6 |
| A | 7 | 110 | 710 | 8.75 | 220 | 206 | 57.6 |
| A | 0 | 30 | 655 | 7.79 | 220 | 206 | 57.6 |
| B | 2 | 9 | 679 | 10.5 | 213 | 202 | 45.4 |
| B | 5 | 128 | 564 | 7.97 | 213 | 202 | 45.4 |
| B | 2 | 8 | 547 | 7.6 | 213 | 202 | 45.4 |
| C | 2 | 191 | 591 | 6.69 | 219 | 203 | 58.0 |
| C | 3 | 235 | 586 | 6.6 | 219 | 203 | 58.0 |
| C | 12 | 241 | 578 | 6.46 | 219 | 203 | 58.0 |
| D | 4 | 246 | 553 | 6.78 | 196 | 177 | 55.5 |
| D | 3 | 14 | 518 | 6.15 | 196 | 177 | 55.5 |
| D | 6 | 231 | 517 | 6.13 | 196 | 177 | 55.5 |
Histogram calculated using DETX and DETY for each event in the final _common_clean file
| Quadrant A | 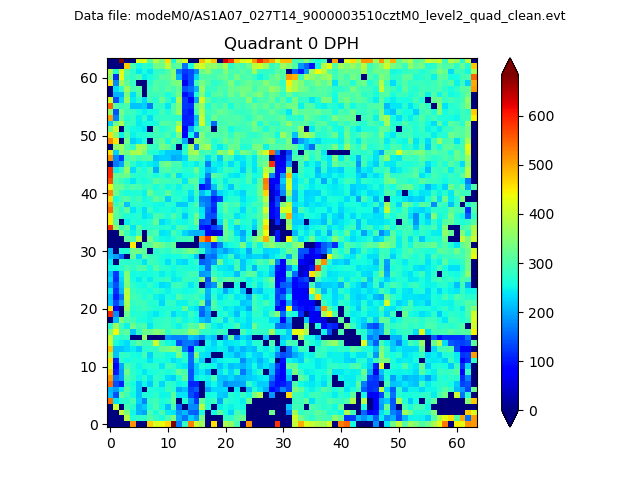 |
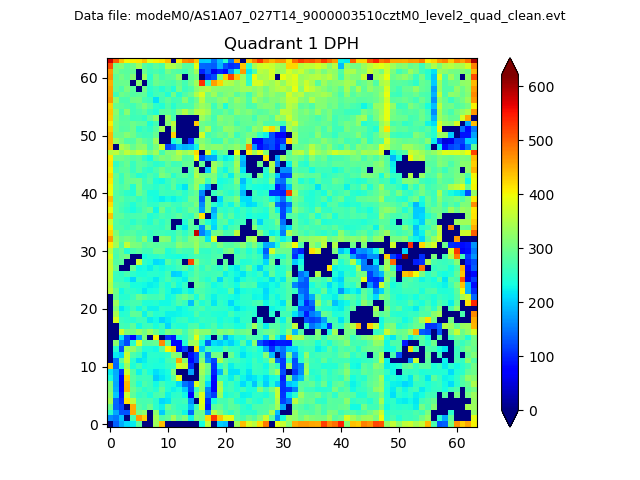 |
Quadrant B |
|---|---|---|---|
| Quadrant D |  |
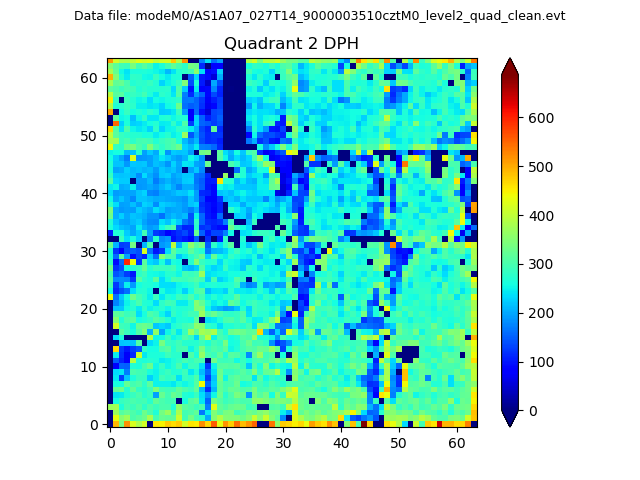 |
Quadrant C |
| Plot type | Count rate plots | Images |
|---|---|---|
| Comparison with Poisson distribution Blue bars denote a histogram of data divided into 1 sec bins. Red curve is a Poisson curve with rate = median count rate of data. |
 |
 |
| Quadrant-wise count rates Data is divided into 100 sec bins |
 |
|
| Module-wise count rates for Quadrant A Data is divided into 100 sec bins |
 |
 |
| Module-wise count rates for Quadrant B Data is divided into 100 sec bins |
 |
 |
| Module-wise count rates for Quadrant C Data is divided into 100 sec bins |
 |
 |
| Module-wise count rates for Quadrant D Data is divided into 100 sec bins |
 |
 |
| Parameter | Plot |
|---|---|
| CZT HV Monitor |  |
| D_VDD | 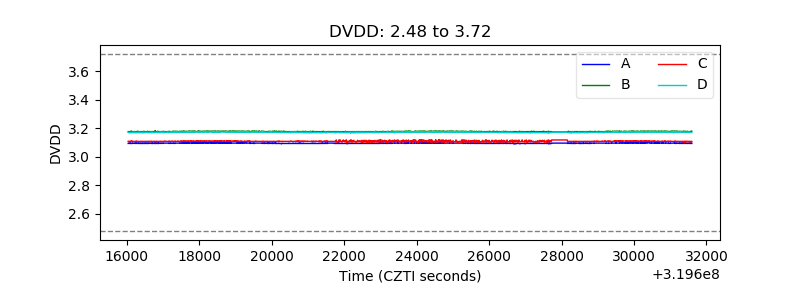 |
| Temperature 1 |  |
| Veto HV Monitor |  |
| Veto LLD |  |
| Alpha Counter |  |
| _CPM_Rate |  |
| CZT Counter |  |
| +2.5 Volts monitor |  |
| +5 Volts monitor |  |
| _ROLL_ROT |  |
| _Roll_DEC |  |
| _Roll_RA | 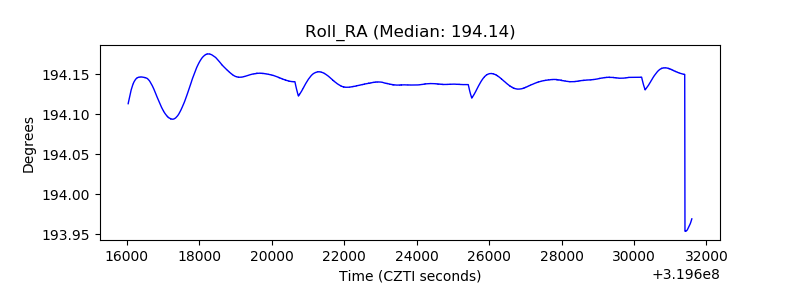 |
| Veto Counter |  |