| Param | Original file | Final file |
|---|---|---|
| Filename | modeM0/AS1A07_027T14_9000003510_23728cztM0_level2.evt | modeM0/AS1A07_027T14_9000003510_23728cztM0_level2_quad_clean.evt |
| Size (bytes) | 77,434,560 | 18,656,640 |
| Size | 73.8 MB | 17.8 MB |
| Events in quadrant A | 527,380 | 118,031 |
| Events in quadrant B | 545,349 | 123,023 |
| Events in quadrant C | 528,814 | 118,486 |
| Events in quadrant D | 659,645 | 115,063 |
| Mode M0 | |||
|---|---|---|---|
| Quadrant | BADHDUFLAG | Total packets | Discarded packets |
| A | 0 | 2376 | 0 |
| B | 0 | 2388 | 0 |
| C | 0 | 2386 | 0 |
| D | 0 | 2720 | 3 |
| Mode SS | |||
|---|---|---|---|
| Quadrant | BADHDUFLAG | Total packets | Discarded packets |
| A | 0 | 24 | 0 |
| B | 0 | 24 | 0 |
| C | 0 | 24 | 0 |
| D | 0 | 24 | 0 |
| Quadrant | Total seconds | Saturated seconds | Saturation percentage |
|---|---|---|---|
| A | 1187 | 0 | 0.000000% |
| B | 1187 | 1 | 0.084246% |
| C | 1187 | 2 | 0.168492% |
| D | 1186 | 1 | 0.084317% |
Noise dominated data is calculated using 1-second bins in cleaned event files. If a bin has >2000 counts, and if more than 50% of those come from <1% of pixels, then it is considered to be noise-dominated and hence unusable.
| Quadrant | # 1 sec bins | Bins with >0 counts | Bins with >2000 counts | High rate bins dominated by noise | Noise dominated (total time) | Noise dominated (detector-on time) | Marked lightcurve |
|---|---|---|---|---|---|---|---|
| A | 1187 | 1187 | 0 | 0 | 0.00% | 0.00% | 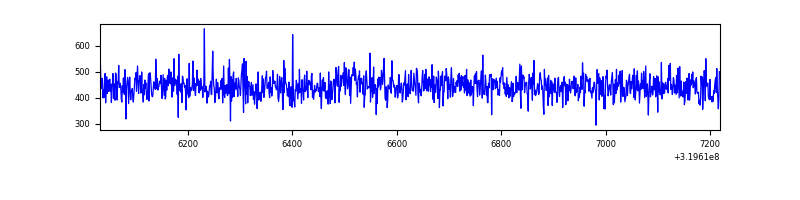 |
| B | 1187 | 1187 | 0 | 0 | 0.00% | 0.00% | 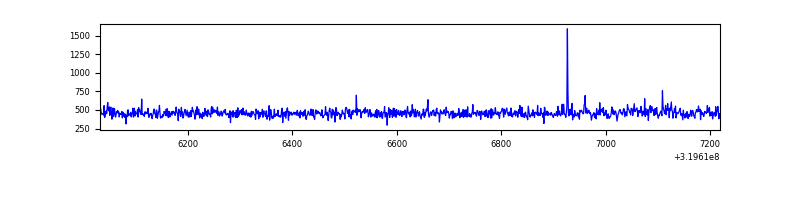 |
| C | 1187 | 1187 | 0 | 0 | 0.00% | 0.00% | 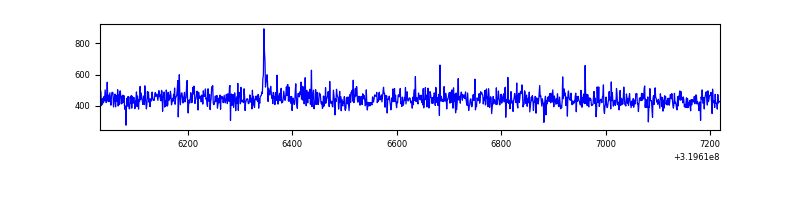 |
| D | 1186 | 1186 | 1 | 1 | 0.08% | 0.08% | 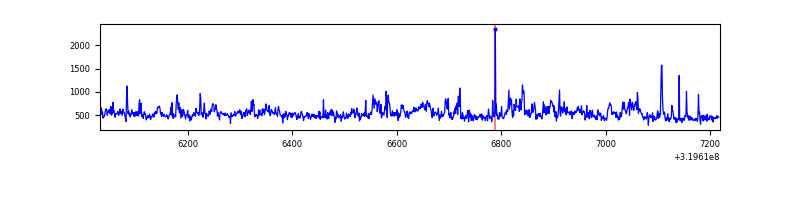 |
Top three noisy pixels from each quadrant. If the there are fewer than three noisy pixels in the level2.evt file, extra rows are filled as -1
| Pixel properties | Quadrant properties | ||||||
|---|---|---|---|---|---|---|---|
| Quadrant | DetID | PixID | Counts | Sigma | Mean | Median | Sigma |
| A | 13 | 254 | 1942 | 60.65 | 136 | 133 | 29.8 |
| A | 3 | 137 | 1263 | 37.88 | 136 | 133 | 29.8 |
| A | 0 | 226 | 1146 | 33.96 | 136 | 133 | 29.8 |
| B | 0 | 189 | 6607 | 228.09 | 135 | 132 | 28.4 |
| B | 0 | 228 | 4818 | 165.07 | 135 | 132 | 28.4 |
| B | 0 | 229 | 4184 | 142.74 | 135 | 132 | 28.4 |
| C | 14 | 238 | 19911 | 617.46 | 129 | 130 | 32.0 |
| C | 10 | 9 | 4476 | 135.66 | 129 | 130 | 32.0 |
| C | 13 | 61 | 931 | 25.0 | 129 | 130 | 32.0 |
| D | 12 | 227 | 97456 | 2855.96 | 131 | 127 | 34.1 |
| D | 7 | 238 | 41983 | 1228.2 | 131 | 127 | 34.1 |
| D | 1 | 52 | 10856 | 314.82 | 131 | 127 | 34.1 |
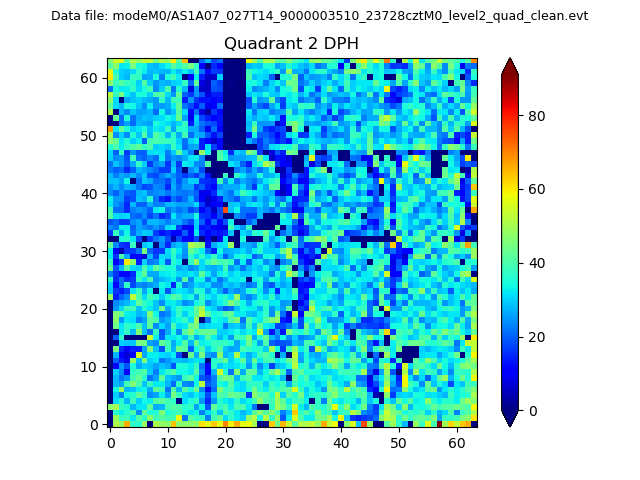
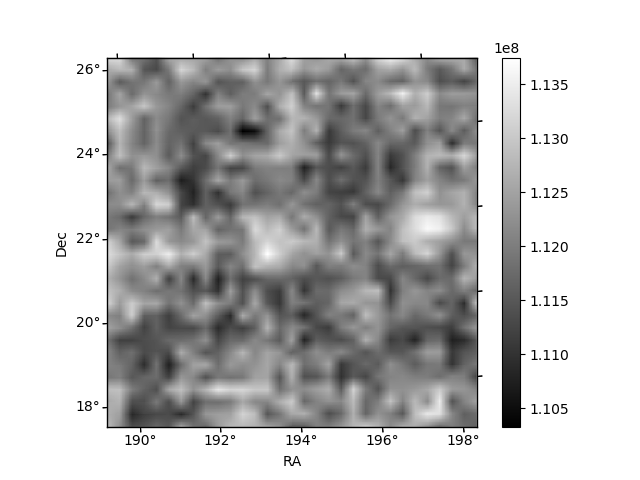
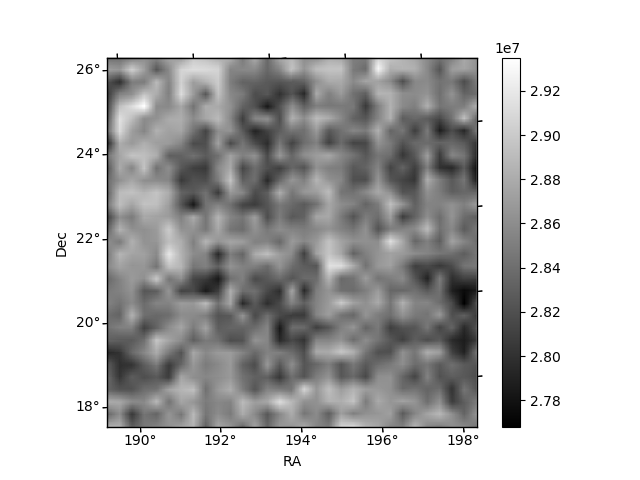
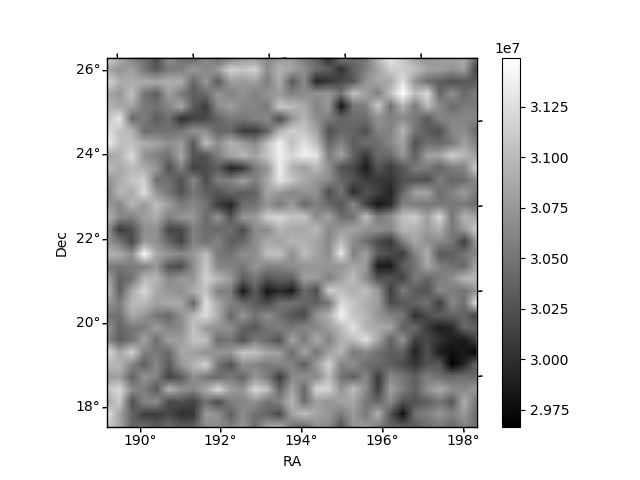
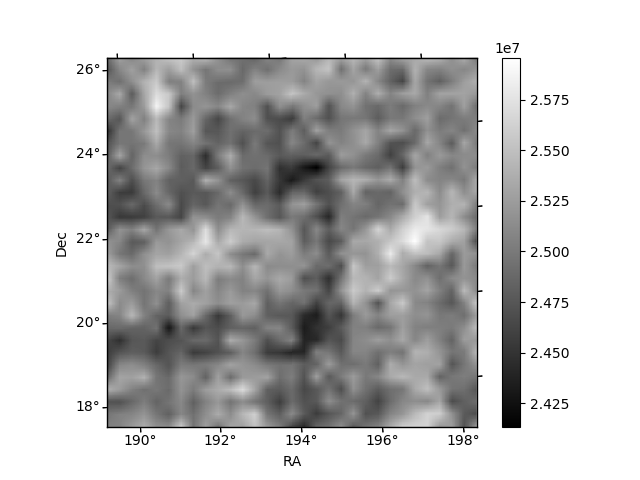
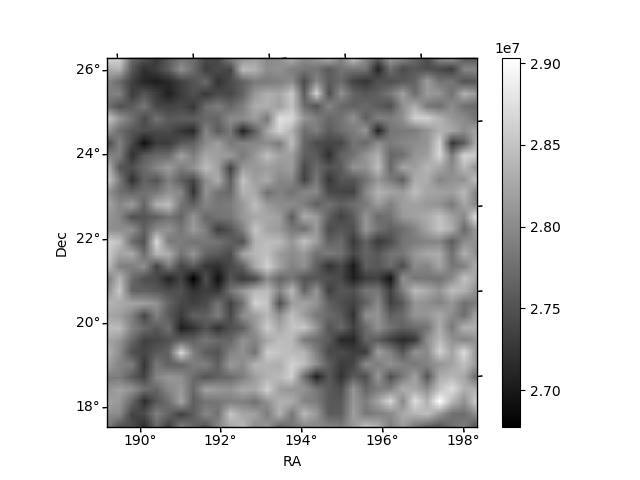
Histogram calculated using DETX and DETY for each event in the final _common_clean file
| Quadrant A | 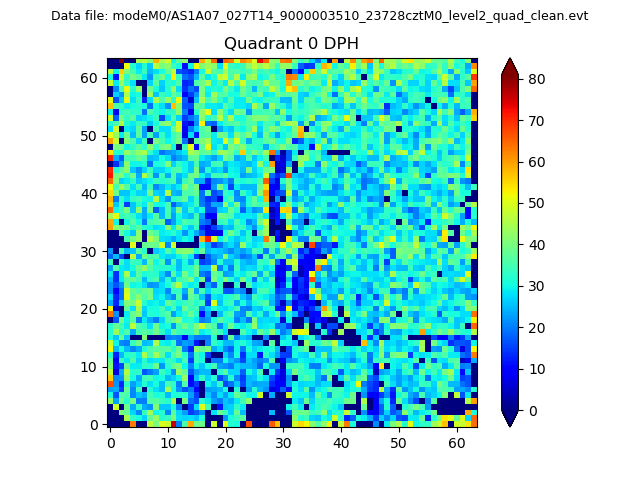 |
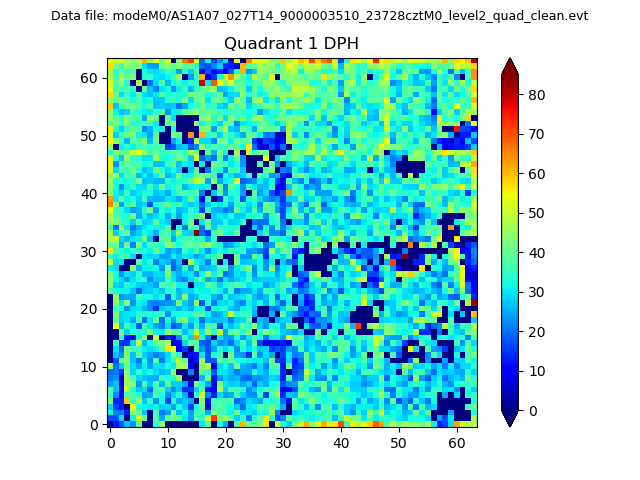 |
Quadrant B |
|---|---|---|---|
| Quadrant D | 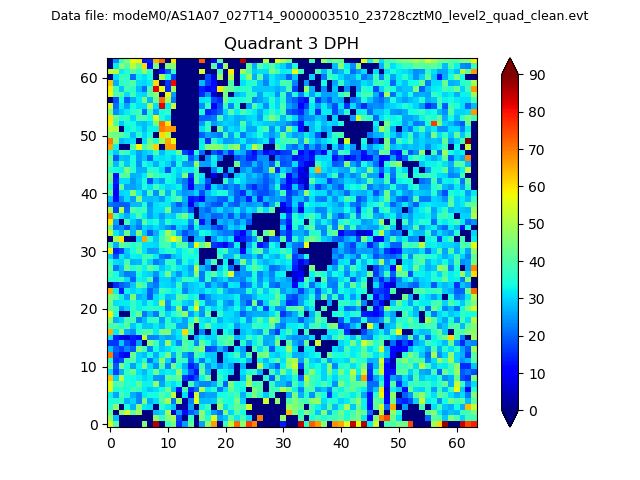 |
 |
Quadrant C |
| Plot type | Count rate plots | Images |
|---|---|---|
| Comparison with Poisson distribution Blue bars denote a histogram of data divided into 1 sec bins. Red curve is a Poisson curve with rate = median count rate of data. |
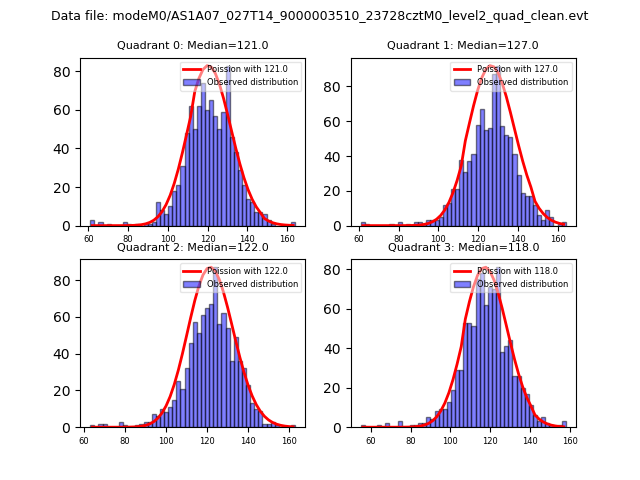 |
 |
| Quadrant-wise count rates Data is divided into 100 sec bins |
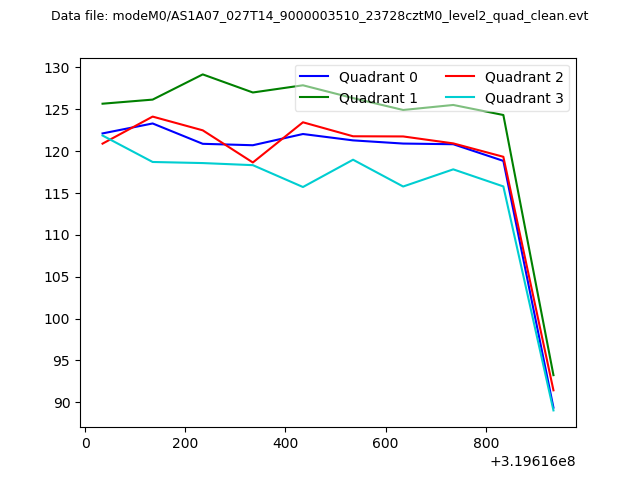 |
|
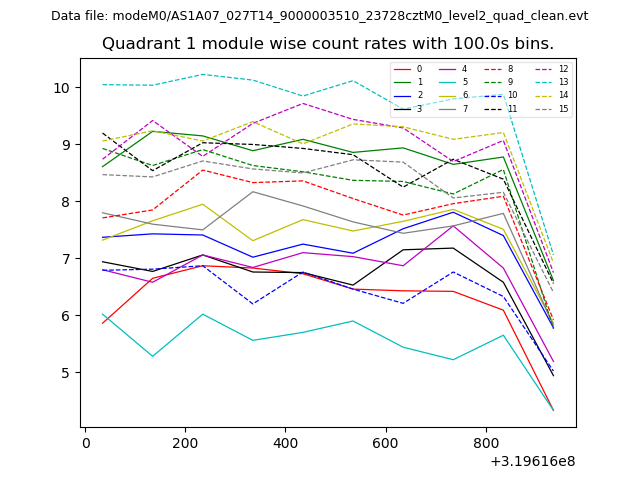
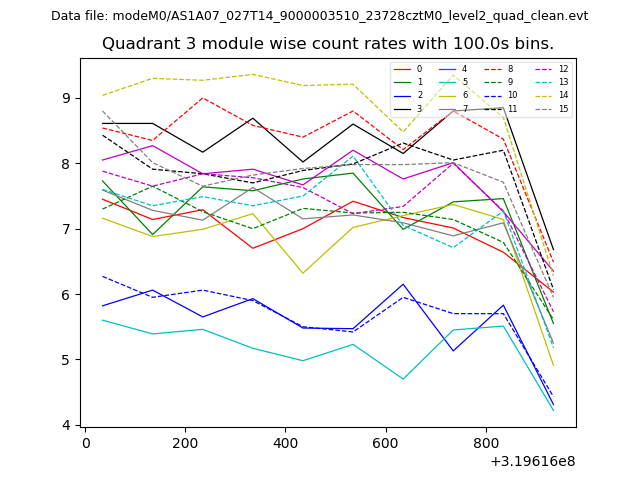
| Module-wise count rates for Quadrant A Data is divided into 100 sec bins |
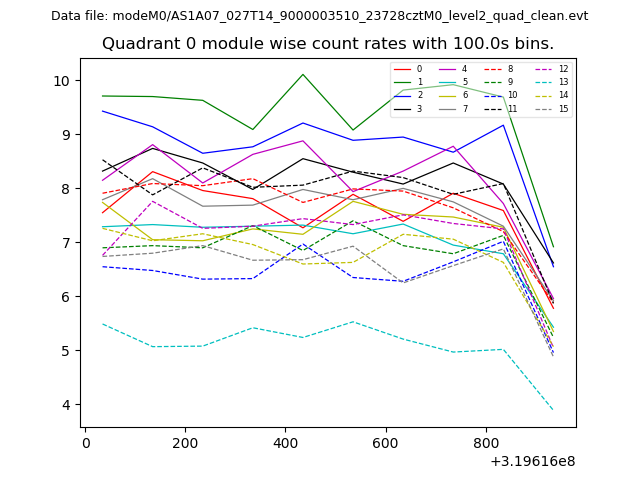 |
 |
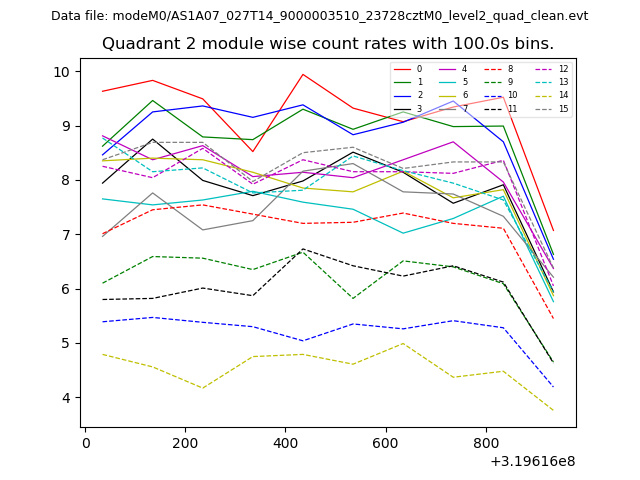
| Module-wise count rates for Quadrant B Data is divided into 100 sec bins |
 |
 |
| Module-wise count rates for Quadrant C Data is divided into 100 sec bins |
 |
 |
| Module-wise count rates for Quadrant D Data is divided into 100 sec bins |
 |
 |
| Parameter | Plot |
|---|---|
| CZT HV Monitor |  |
| D_VDD | 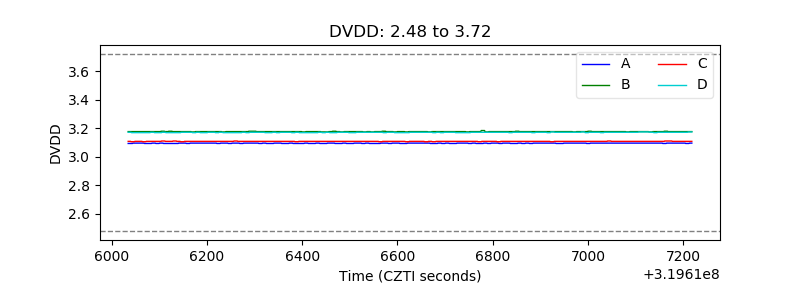 |
| Temperature 1 |  |
| Veto HV Monitor | 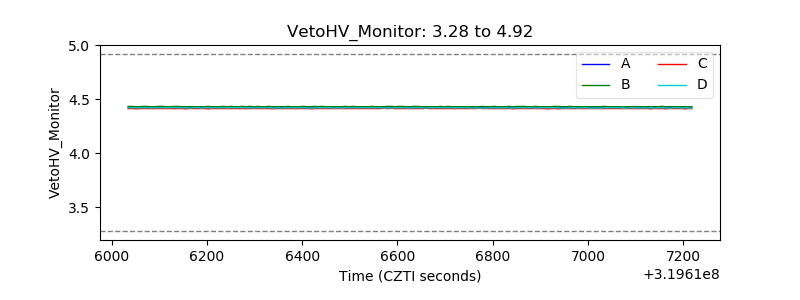 |
| Veto LLD |  |
| Alpha Counter | 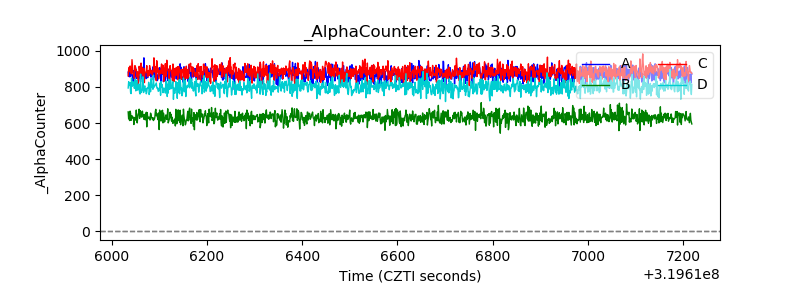 |
| _CPM_Rate | 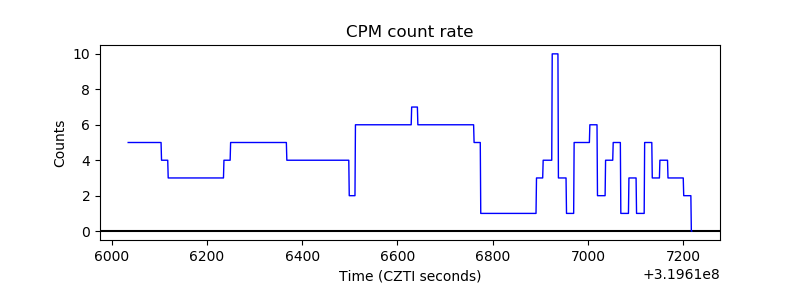 |
| CZT Counter | 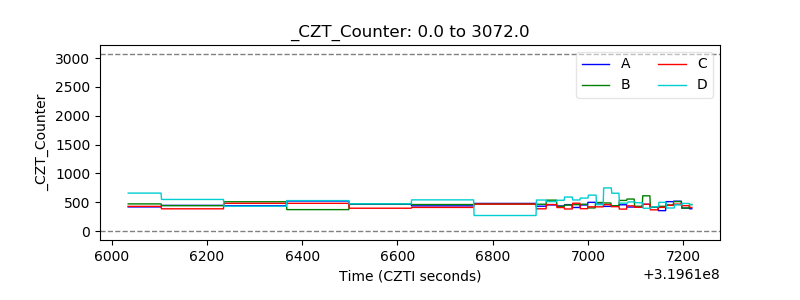 |
| +2.5 Volts monitor |  |
| +5 Volts monitor |  |
| _ROLL_ROT | 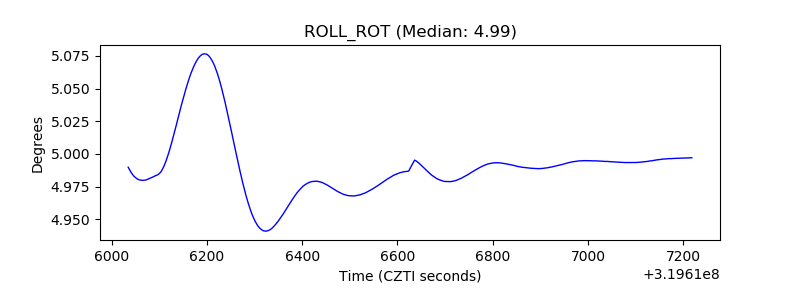 |
| _Roll_DEC | 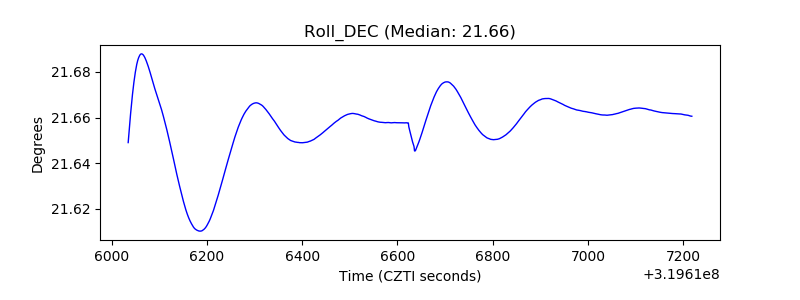 |
| _Roll_RA | 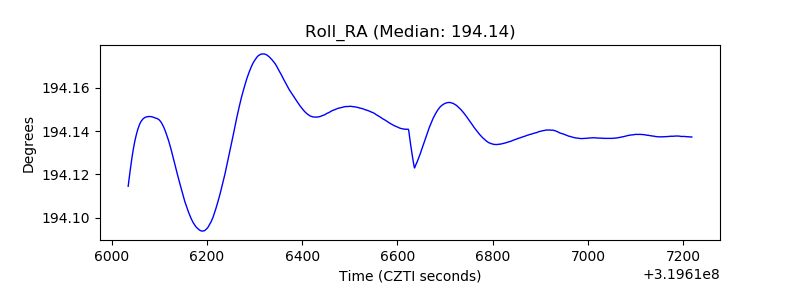 |
| Veto Counter | 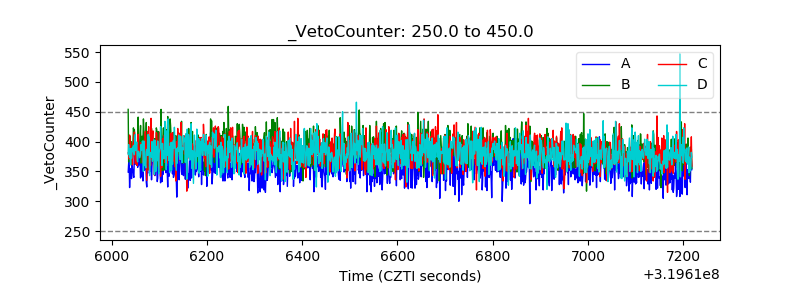 |