| Param | Original file | Final file |
|---|---|---|
| Filename | modeM0/AS1A07_027T14_9000003510_23729cztM0_level2.evt | modeM0/AS1A07_027T14_9000003510_23729cztM0_level2_quad_clean.evt |
| Size (bytes) | 524,632,320 | 89,184,960 |
| Size | 500.3 MB | 85.1 MB |
| Events in quadrant A | 3,383,122 | 552,493 |
| Events in quadrant B | 4,007,162 | 563,282 |
| Events in quadrant C | 3,457,528 | 547,814 |
| Events in quadrant D | 4,552,198 | 535,709 |
| Mode M0 | |||
|---|---|---|---|
| Quadrant | BADHDUFLAG | Total packets | Discarded packets |
| A | 0 | 14747 | 1 |
| B | 0 | 16435 | 1 |
| C | 0 | 14811 | 1 |
| D | 0 | 18214 | 1 |
| Mode SS | |||
|---|---|---|---|
| Quadrant | BADHDUFLAG | Total packets | Discarded packets |
| A | 0 | 146 | 0 |
| B | 0 | 146 | 0 |
| C | 0 | 146 | 0 |
| D | 0 | 146 | 0 |
| Mode M9 | |||
|---|---|---|---|
| Quadrant | BADHDUFLAG | Total packets | Discarded packets |
| A | 0 | 2 | 0 |
| B | 0 | 2 | 0 |
| C | 0 | 2 | 0 |
| D | 0 | 2 | 0 |
| Quadrant | Total seconds | Saturated seconds | Saturation percentage |
|---|---|---|---|
| A | 7196 | 176 | 2.445803% |
| B | 7196 | 252 | 3.501946% |
| C | 7195 | 187 | 2.599027% |
| D | 7195 | 274 | 3.808200% |
Noise dominated data is calculated using 1-second bins in cleaned event files. If a bin has >2000 counts, and if more than 50% of those come from <1% of pixels, then it is considered to be noise-dominated and hence unusable.
| Quadrant | # 1 sec bins | Bins with >0 counts | Bins with >2000 counts | High rate bins dominated by noise | Noise dominated (total time) | Noise dominated (detector-on time) | Marked lightcurve |
|---|---|---|---|---|---|---|---|
| A | 7376 | 7196 | 0 | 0 | 0.00% | 0.00% | 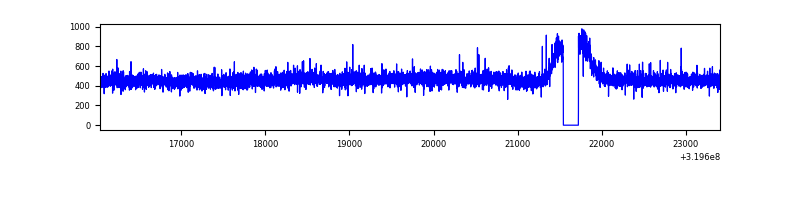 |
| B | 7376 | 7196 | 47 | 47 | 0.64% | 0.65% | 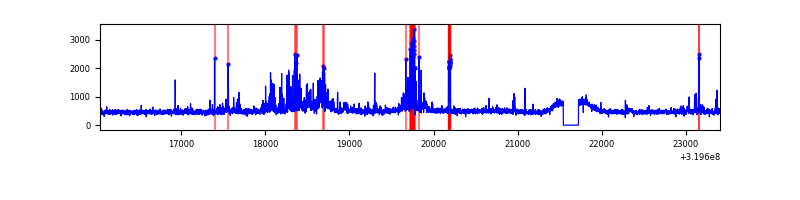 |
| C | 7375 | 7195 | 1 | 1 | 0.01% | 0.01% | 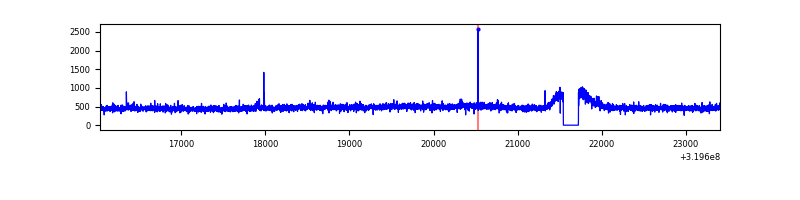 |
| D | 7375 | 7195 | 116 | 116 | 1.57% | 1.61% | 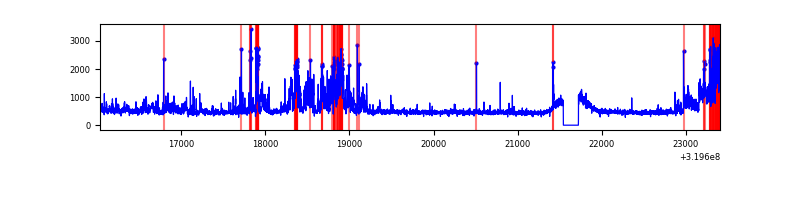 |
Top three noisy pixels from each quadrant. If the there are fewer than three noisy pixels in the level2.evt file, extra rows are filled as -1
| Pixel properties | Quadrant properties | ||||||
|---|---|---|---|---|---|---|---|
| Quadrant | DetID | PixID | Counts | Sigma | Mean | Median | Sigma |
| A | 13 | 254 | 12497 | 65.22 | 877 | 857 | 178.5 |
| A | 3 | 137 | 8060 | 40.36 | 877 | 857 | 178.5 |
| A | 0 | 226 | 7680 | 38.23 | 877 | 857 | 178.5 |
| B | 0 | 229 | 281773 | 1649.12 | 869 | 846 | 170.3 |
| B | 15 | 33 | 146772 | 856.63 | 869 | 846 | 170.3 |
| B | 0 | 189 | 123779 | 721.65 | 869 | 846 | 170.3 |
| C | 14 | 238 | 130500 | 648.74 | 841 | 845 | 199.9 |
| C | 7 | 247 | 29859 | 145.17 | 841 | 845 | 199.9 |
| C | 10 | 9 | 12116 | 56.4 | 841 | 845 | 199.9 |
| D | 12 | 227 | 624958 | 2960.26 | 854 | 826 | 210.8 |
| D | 8 | 195 | 326602 | 1545.15 | 854 | 826 | 210.8 |
| D | 7 | 238 | 125451 | 591.09 | 854 | 826 | 210.8 |
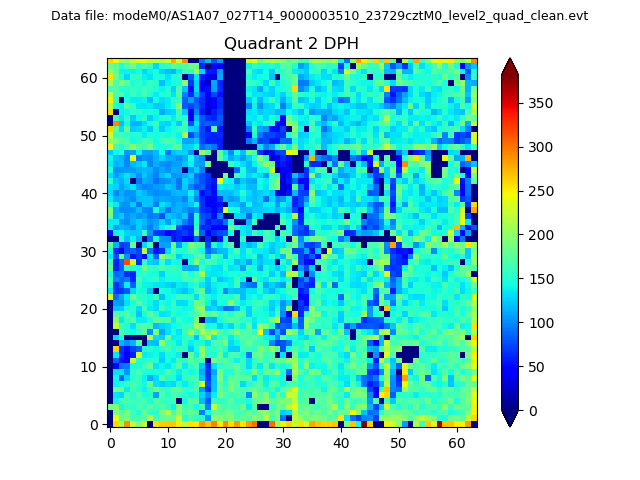
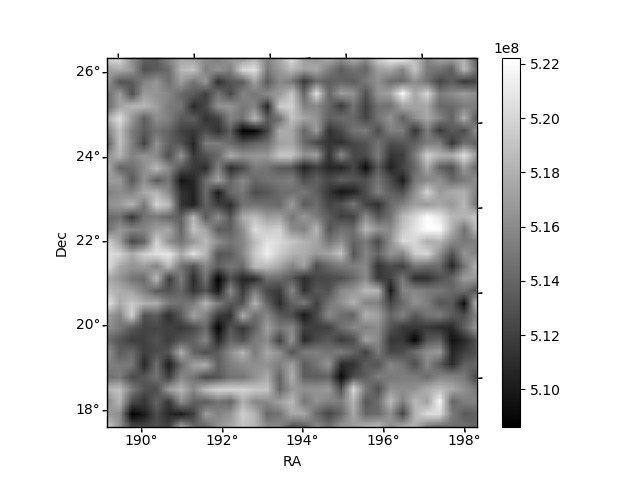
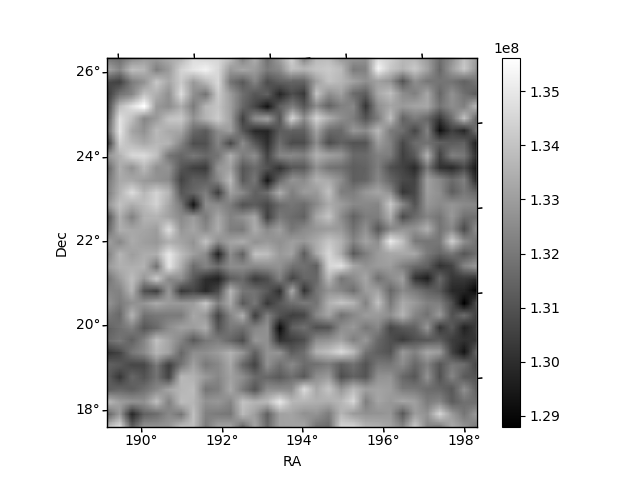
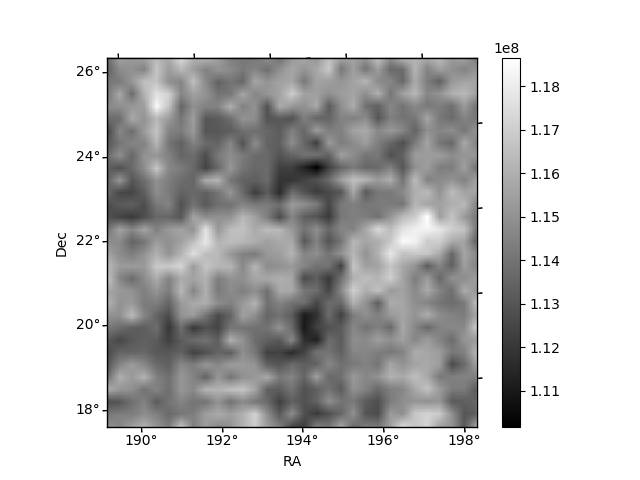
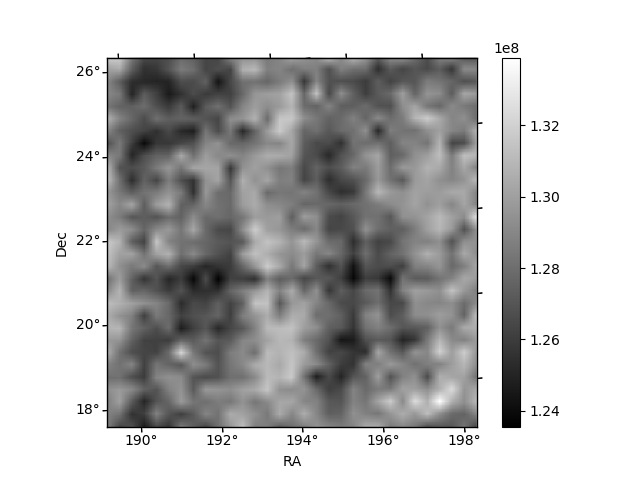
Histogram calculated using DETX and DETY for each event in the final _common_clean file
| Quadrant A | 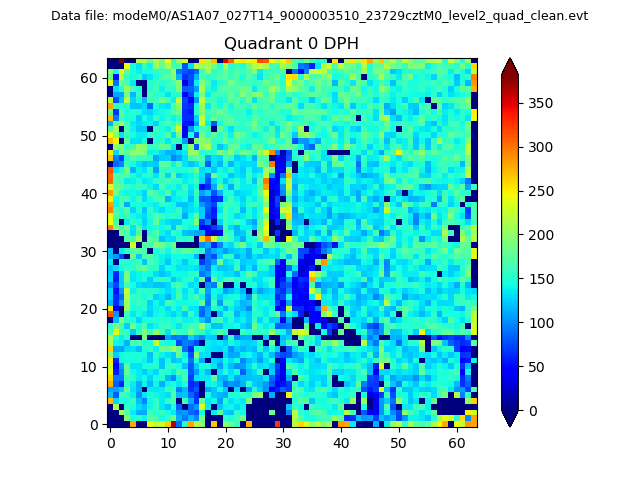 |
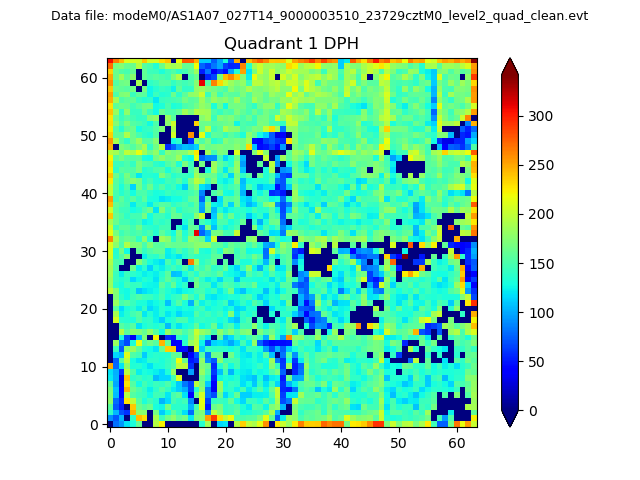 |
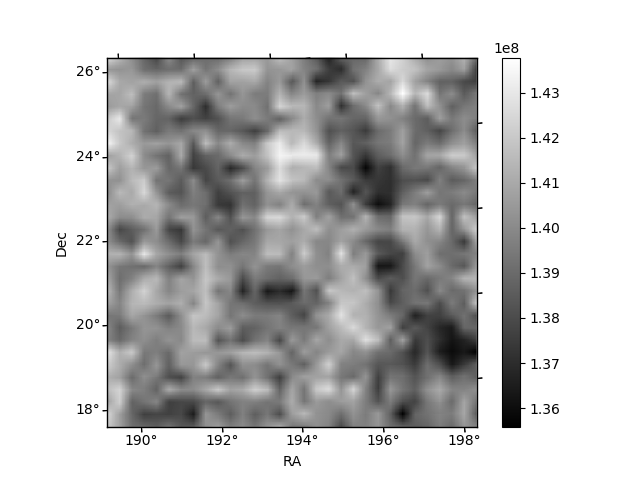
Quadrant B |
|---|---|---|---|
| Quadrant D | 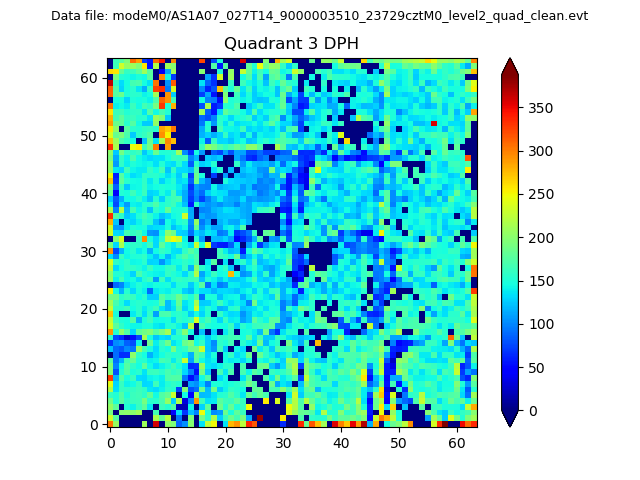 |
 |
Quadrant C |
| Plot type | Count rate plots | Images |
|---|---|---|
| Comparison with Poisson distribution Blue bars denote a histogram of data divided into 1 sec bins. Red curve is a Poisson curve with rate = median count rate of data. |
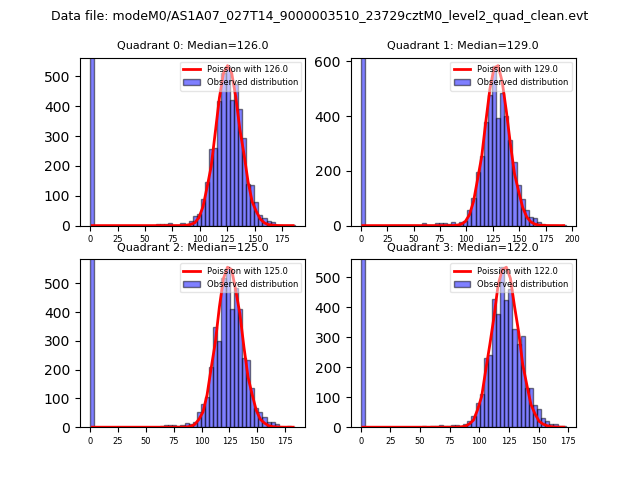 |
 |
| Quadrant-wise count rates Data is divided into 100 sec bins |
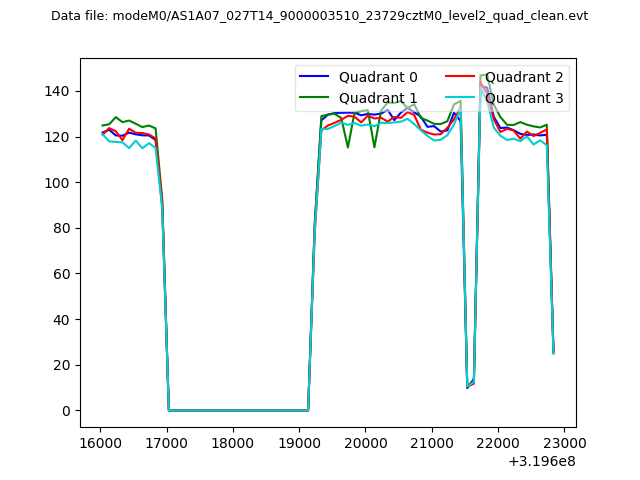 |
|
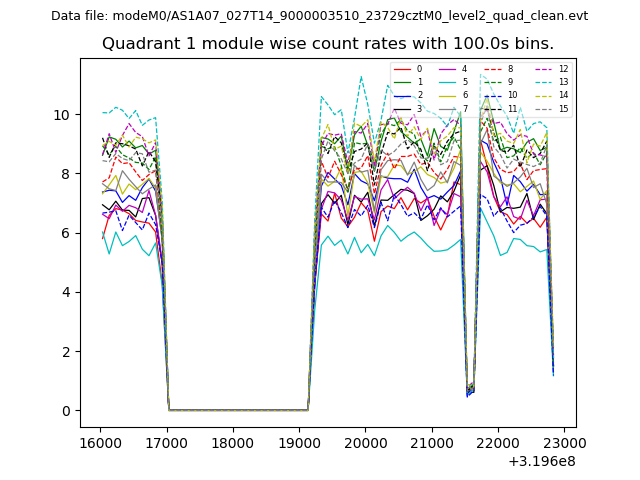
| Module-wise count rates for Quadrant A Data is divided into 100 sec bins |
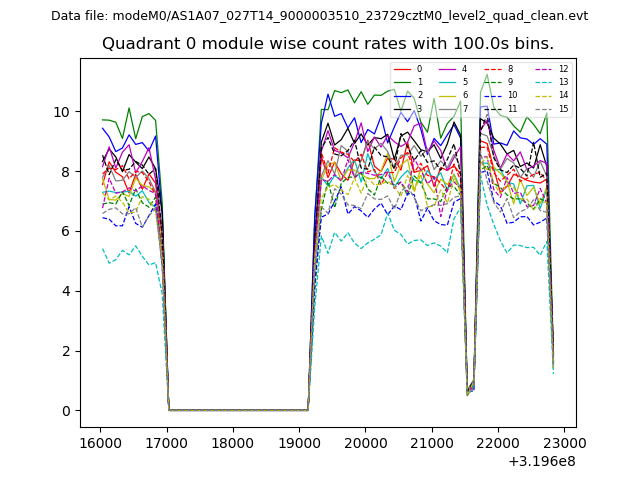 |
 |
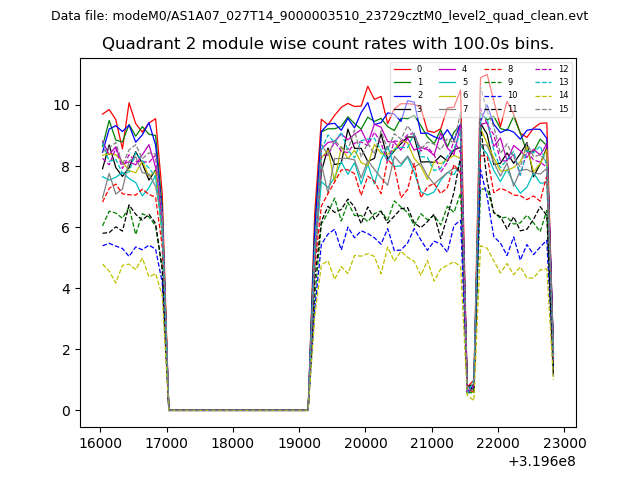
| Module-wise count rates for Quadrant B Data is divided into 100 sec bins |
 |
 |
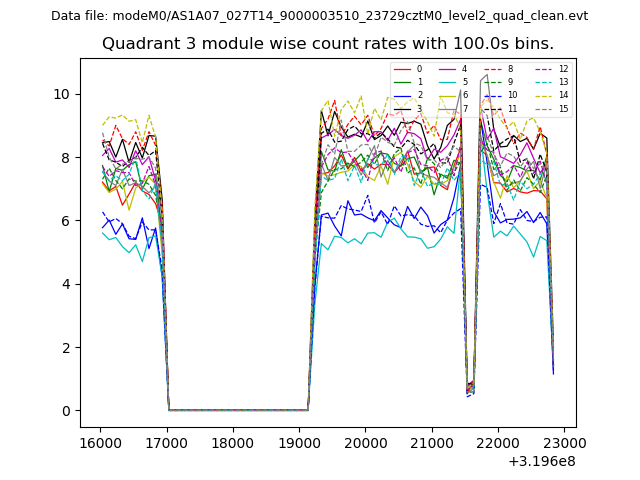
| Module-wise count rates for Quadrant C Data is divided into 100 sec bins |
 |
 |
| Module-wise count rates for Quadrant D Data is divided into 100 sec bins |
 |
 |
| Parameter | Plot |
|---|---|
| CZT HV Monitor | 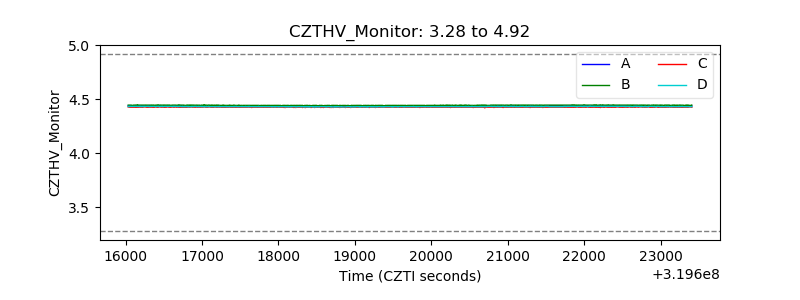 |
| D_VDD | 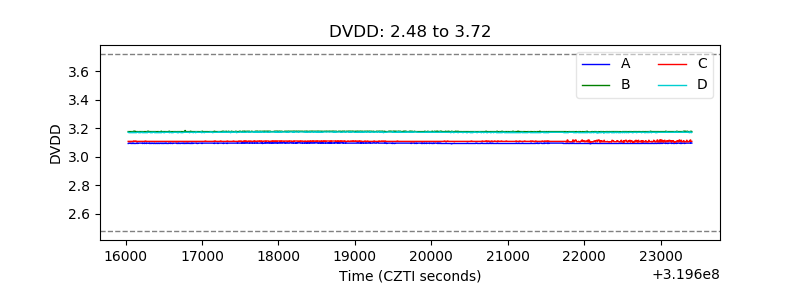 |
| Temperature 1 | 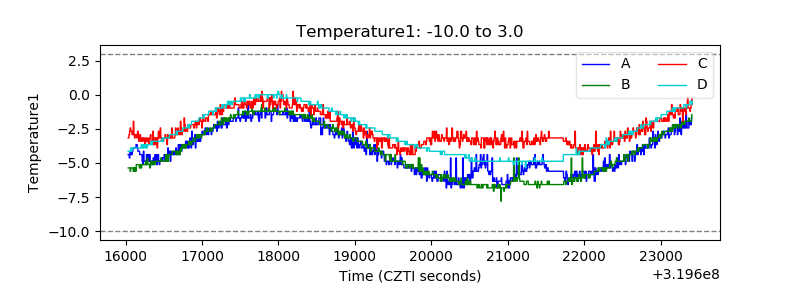 |
| Veto HV Monitor | 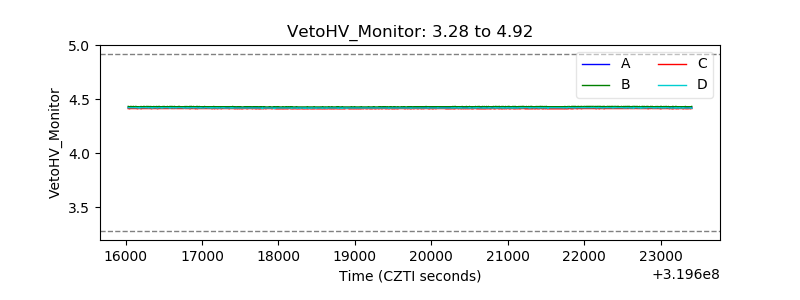 |
| Veto LLD | 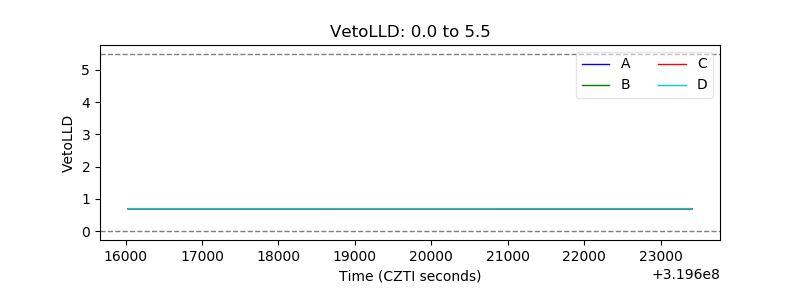 |
| Alpha Counter | 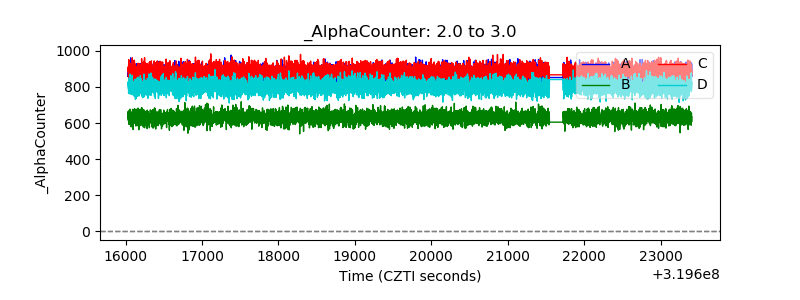 |
| _CPM_Rate | 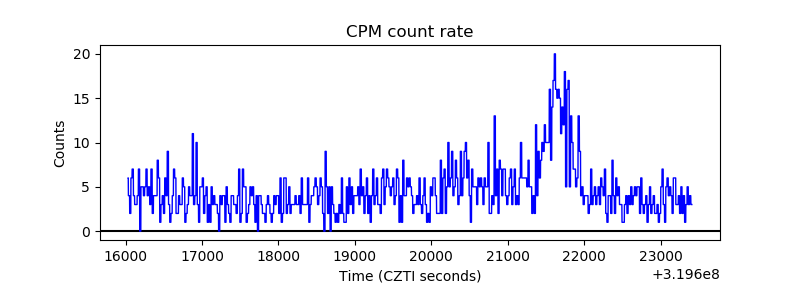 |
| CZT Counter | 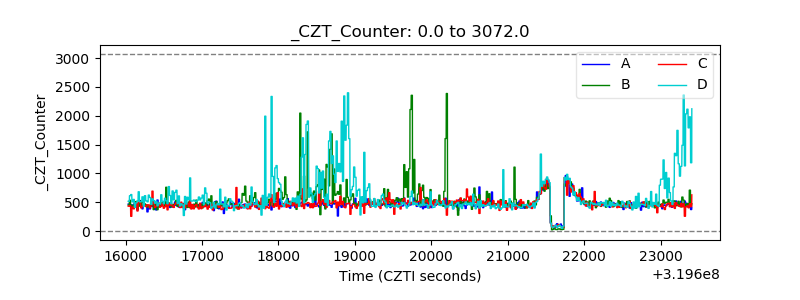 |
| +2.5 Volts monitor |  |
| +5 Volts monitor |  |
| _ROLL_ROT | 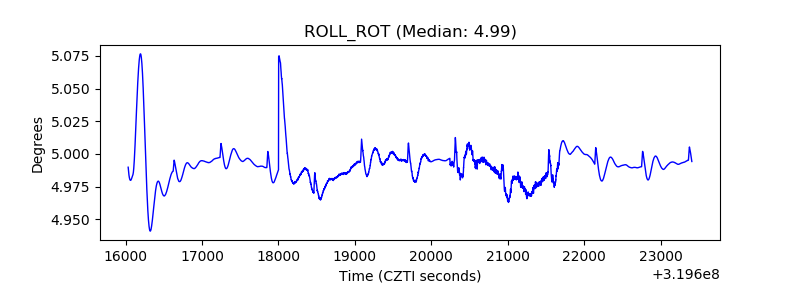 |
| _Roll_DEC | 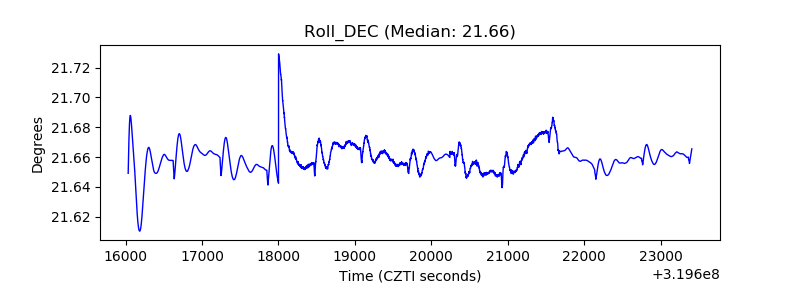 |
| _Roll_RA | 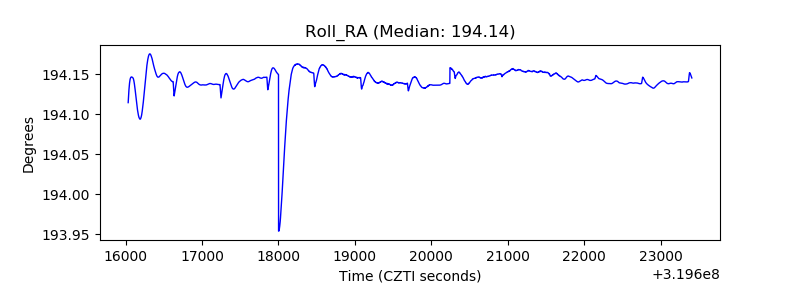 |
| Veto Counter | 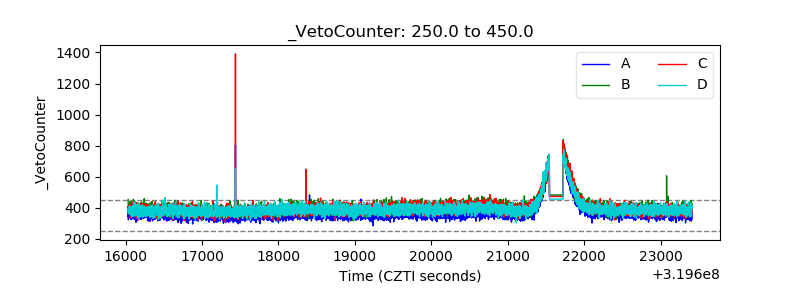 |