| Param | Original file | Final file |
|---|---|---|
| Filename | modeM0/AS1A07_027T14_9000003510_23732cztM0_level2.evt | modeM0/AS1A07_027T14_9000003510_23732cztM0_level2_quad_clean.evt |
| Size (bytes) | 867,908,160 | 90,296,640 |
| Size | 827.7 MB | 86.1 MB |
| Events in quadrant A | 4,120,440 | 544,299 |
| Events in quadrant B | 5,144,188 | 548,774 |
| Events in quadrant C | 4,222,965 | 534,263 |
| Events in quadrant D | 12,197,785 | 490,642 |
| Mode M0 | |||
|---|---|---|---|
| Quadrant | BADHDUFLAG | Total packets | Discarded packets |
| A | 0 | 18026 | 1 |
| B | 0 | 20881 | 1 |
| C | 0 | 18087 | 1 |
| D | 0 | 42443 | 1 |
| Mode SS | |||
|---|---|---|---|
| Quadrant | BADHDUFLAG | Total packets | Discarded packets |
| A | 0 | 180 | 0 |
| B | 0 | 180 | 0 |
| C | 0 | 180 | 0 |
| D | 0 | 180 | 0 |
| Mode M9 | |||
|---|---|---|---|
| Quadrant | BADHDUFLAG | Total packets | Discarded packets |
| A | 0 | 4 | 0 |
| B | 0 | 4 | 0 |
| C | 0 | 4 | 0 |
| D | 0 | 4 | 0 |
| Quadrant | Total seconds | Saturated seconds | Saturation percentage |
|---|---|---|---|
| A | 8871 | 94 | 1.059633% |
| B | 8872 | 246 | 2.772768% |
| C | 8872 | 127 | 1.431470% |
| D | 8872 | 2043 | 23.027502% |
Noise dominated data is calculated using 1-second bins in cleaned event files. If a bin has >2000 counts, and if more than 50% of those come from <1% of pixels, then it is considered to be noise-dominated and hence unusable.
| Quadrant | # 1 sec bins | Bins with >0 counts | Bins with >2000 counts | High rate bins dominated by noise | Noise dominated (total time) | Noise dominated (detector-on time) | Marked lightcurve |
|---|---|---|---|---|---|---|---|
| A | 9301 | 8871 | 0 | 0 | 0.00% | 0.00% | 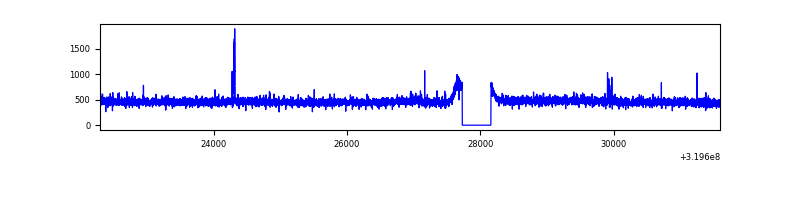 |
| B | 9302 | 8872 | 112 | 112 | 1.20% | 1.26% | 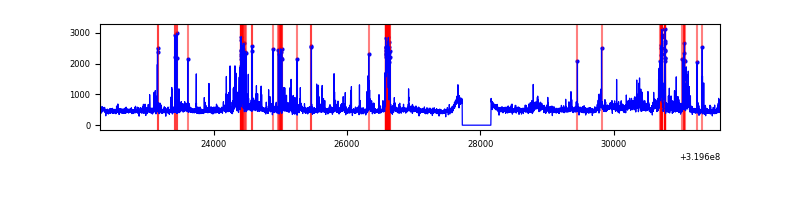 |
| C | 9302 | 8872 | 2 | 2 | 0.02% | 0.02% | 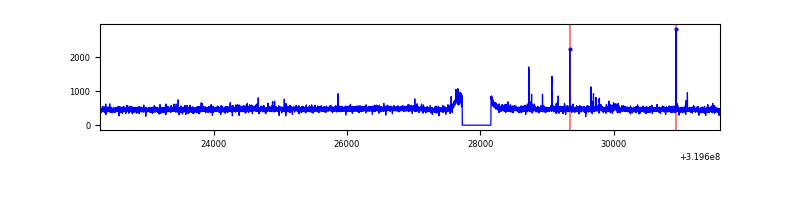 |
| D | 9302 | 8872 | 1853 | 1853 | 19.92% | 20.89% | 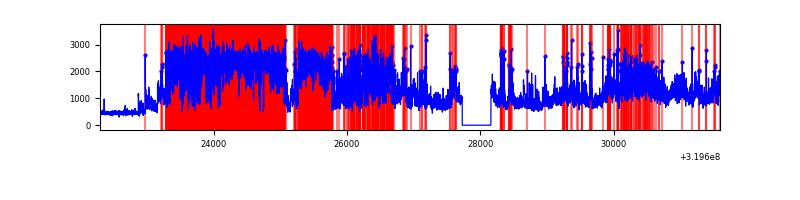 |
Top three noisy pixels from each quadrant. If the there are fewer than three noisy pixels in the level2.evt file, extra rows are filled as -1
| Pixel properties | Quadrant properties | ||||||
|---|---|---|---|---|---|---|---|
| Quadrant | DetID | PixID | Counts | Sigma | Mean | Median | Sigma |
| A | 13 | 254 | 14693 | 63.44 | 1063 | 1039 | 215.2 |
| A | 5 | 168 | 12227 | 51.98 | 1063 | 1039 | 215.2 |
| A | 3 | 137 | 9670 | 40.1 | 1063 | 1039 | 215.2 |
| B | 3 | 64 | 387886 | 1907.12 | 1049 | 1021 | 202.9 |
| B | 0 | 189 | 286661 | 1408.12 | 1049 | 1021 | 202.9 |
| B | 0 | 229 | 276231 | 1356.7 | 1049 | 1021 | 202.9 |
| C | 14 | 238 | 159537 | 657.58 | 1021 | 1026 | 241.1 |
| C | 7 | 247 | 35783 | 144.19 | 1021 | 1026 | 241.1 |
| C | 4 | 175 | 17295 | 67.49 | 1021 | 1026 | 241.1 |
| D | 8 | 195 | 6056440 | 25410.28 | 973 | 944 | 238.3 |
| D | 1 | 52 | 1576133 | 6609.86 | 973 | 944 | 238.3 |
| D | 12 | 233 | 544886 | 2282.51 | 973 | 944 | 238.3 |
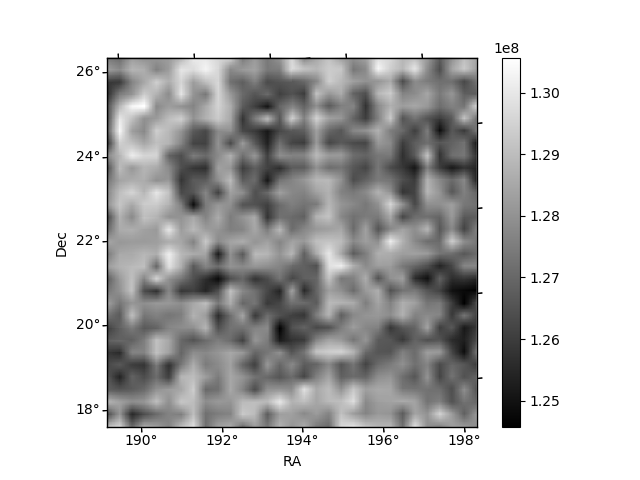
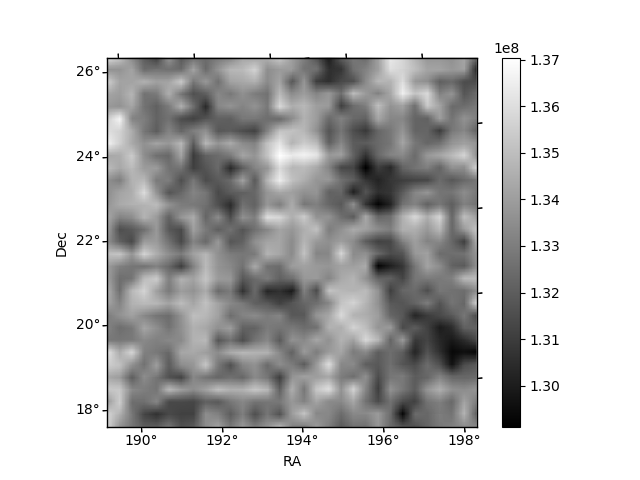
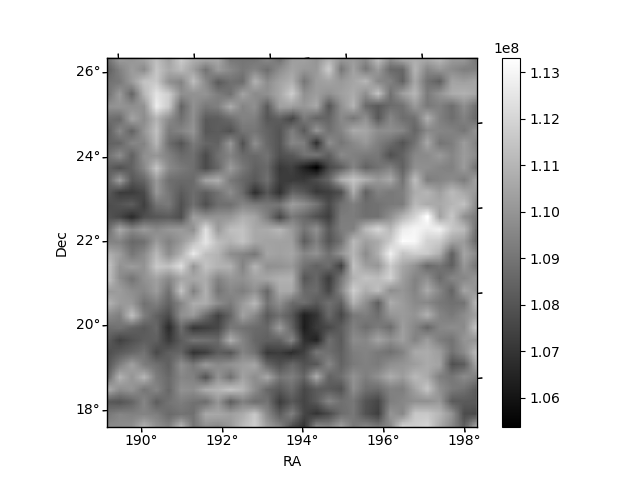
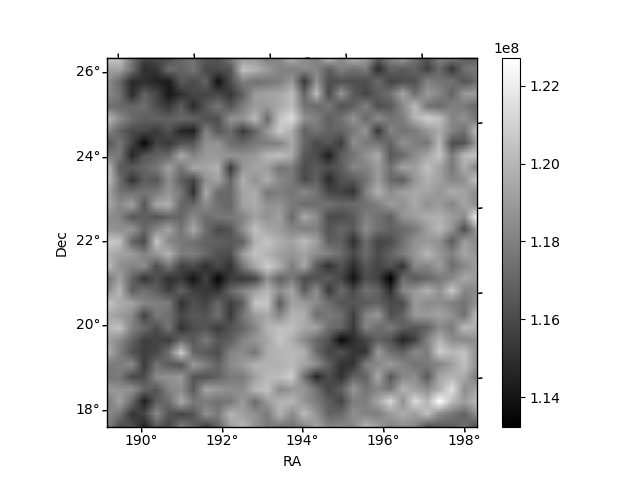
Histogram calculated using DETX and DETY for each event in the final _common_clean file
| Quadrant A | 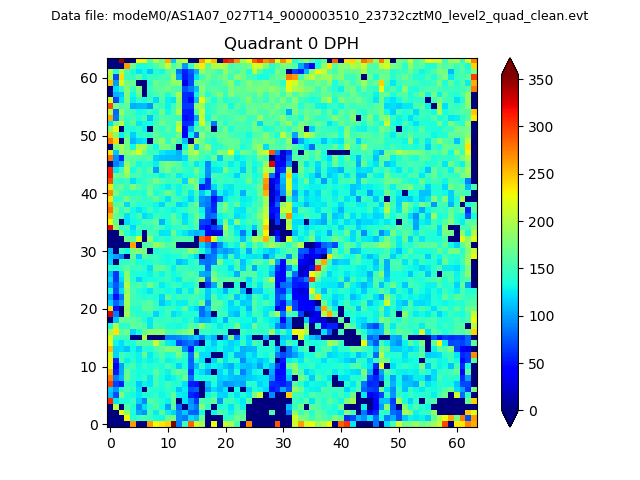 |
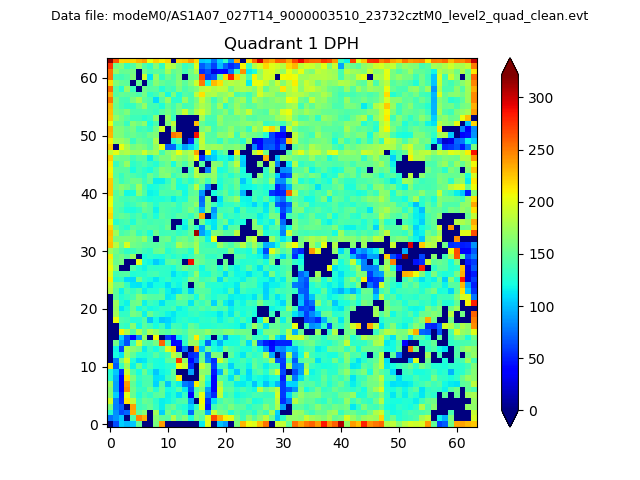 |
Quadrant B |
|---|---|---|---|
| Quadrant D |  |
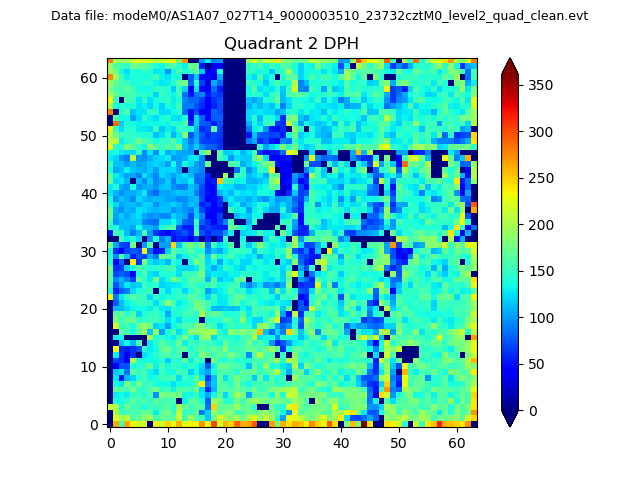 |
Quadrant C |
| Plot type | Count rate plots | Images |
|---|---|---|
| Comparison with Poisson distribution Blue bars denote a histogram of data divided into 1 sec bins. Red curve is a Poisson curve with rate = median count rate of data. |
 |
 |
| Quadrant-wise count rates Data is divided into 100 sec bins |
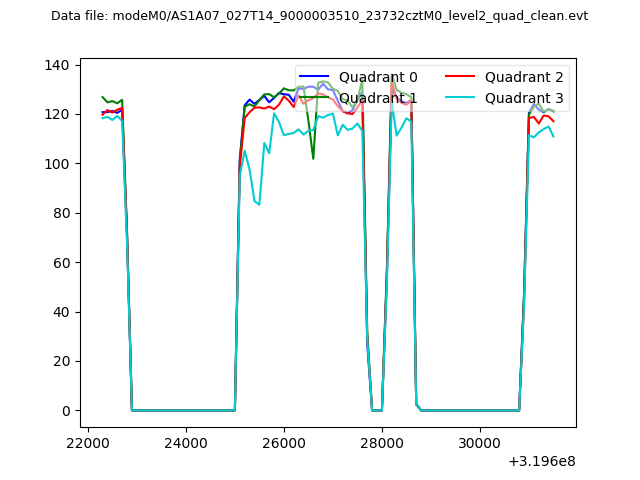 |
|
| Module-wise count rates for Quadrant A Data is divided into 100 sec bins |
 |
 |
| Module-wise count rates for Quadrant B Data is divided into 100 sec bins |
 |
 |
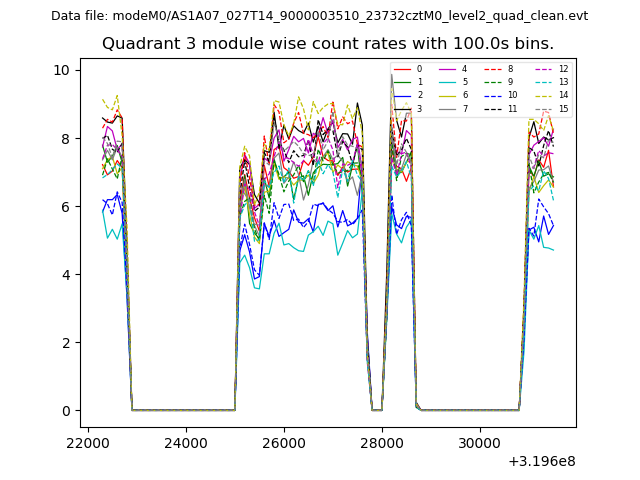
| Module-wise count rates for Quadrant C Data is divided into 100 sec bins |
 |
 |
| Module-wise count rates for Quadrant D Data is divided into 100 sec bins |
 |
 |
| Parameter | Plot |
|---|---|
| CZT HV Monitor |  |
| D_VDD | 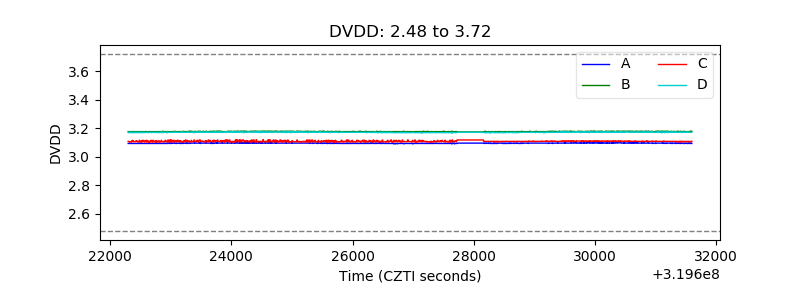 |
| Temperature 1 | 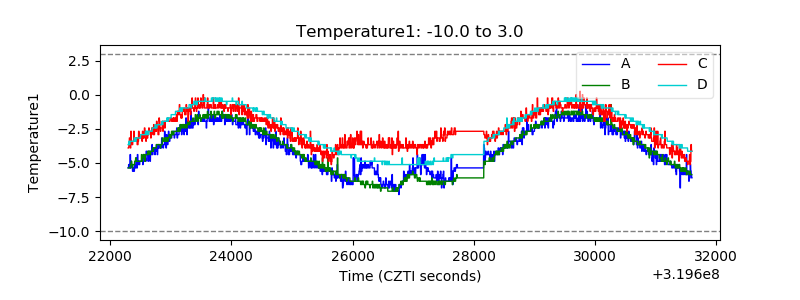 |
| Veto HV Monitor | 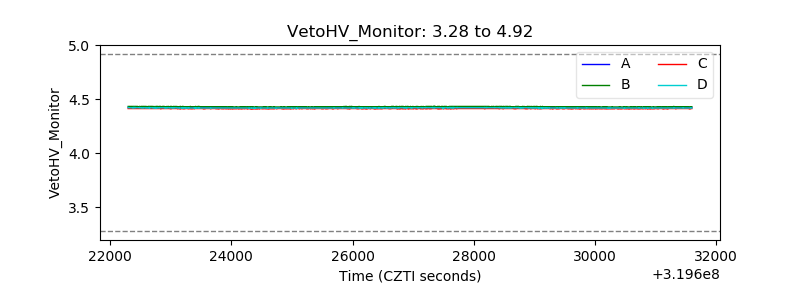 |
| Veto LLD | 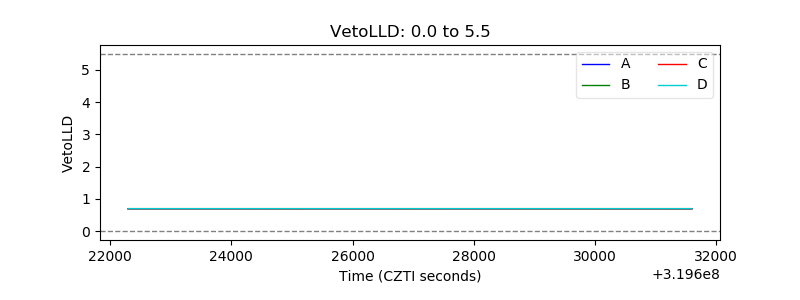 |
| Alpha Counter | 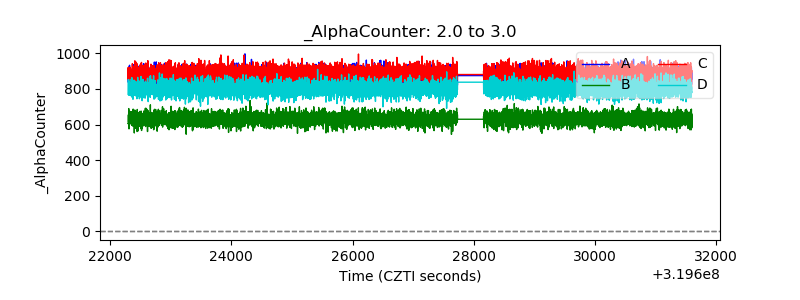 |
| _CPM_Rate | 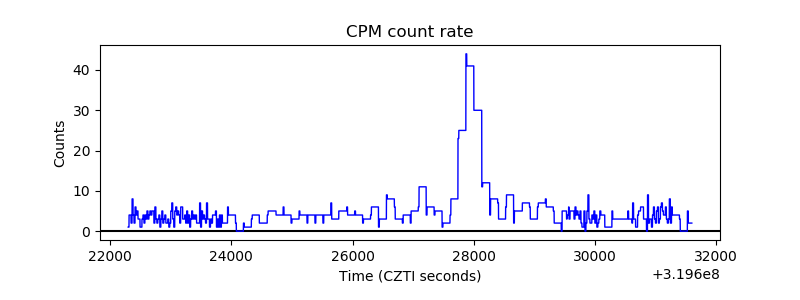 |
| CZT Counter | 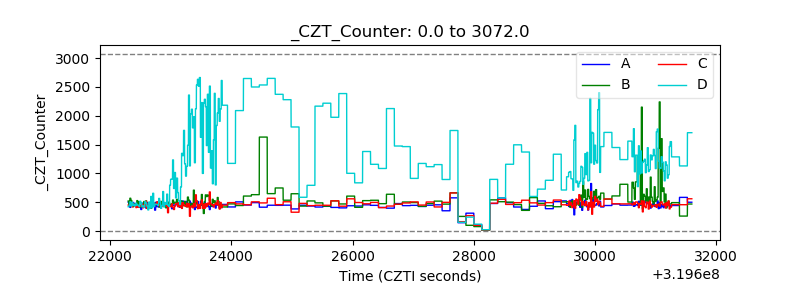 |
| +2.5 Volts monitor |  |
| +5 Volts monitor |  |
| _ROLL_ROT | 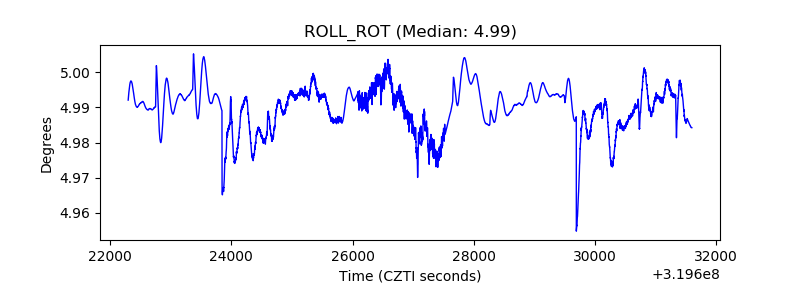 |
| _Roll_DEC | 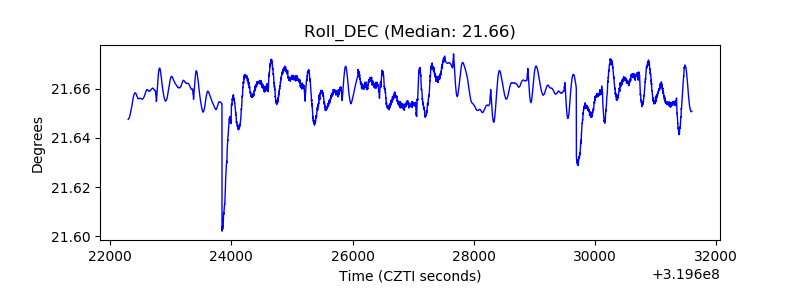 |
| _Roll_RA | 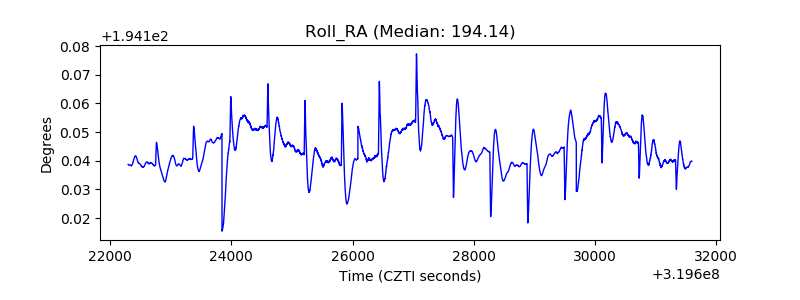 |
| Veto Counter |  |