| Param | Original file | Final file |
|---|---|---|
| Filename | modeM0/AS1A08_009T01_9000003516cztM0_level2.fits | modeM0/AS1A08_009T01_9000003516cztM0_level2_quad_clean.evt |
| Size (bytes) | 729,938,880 | 748,316,160 |
| Size | 696.1 MB | 713.6 MB |
| Events in quadrant A | 4,486,078 | 4,574,129 |
| Events in quadrant B | 4,304,442 | 4,595,215 |
| Events in quadrant C | 4,419,000 | 4,424,308 |
| Events in quadrant D | 3,788,628 | 3,962,446 |
| Mode M9 | |||
|---|---|---|---|
| Quadrant | BADHDUFLAG | Total packets | Discarded packets |
| A | 0 | 123 | 0 |
| B | 0 | 123 | 0 |
| C | 0 | 123 | 0 |
| D | 0 | 123 | 0 |
| Mode SS | |||
|---|---|---|---|
| Quadrant | BADHDUFLAG | Total packets | Discarded packets |
| A | 0 | 1522 | 0 |
| B | 0 | 1522 | 0 |
| C | 0 | 1522 | 0 |
| D | 0 | 1522 | 0 |
| Mode M0 | |||
|---|---|---|---|
| Quadrant | BADHDUFLAG | Total packets | Discarded packets |
| A | 0 | 153790 | 0 |
| B | 0 | 165765 | 0 |
| C | 0 | 157533 | 0 |
| D | 0 | 195130 | 0 |
| Quadrant | Total seconds | Saturated seconds | Saturation percentage |
|---|---|---|---|
| A | 74485 | 701 | 0.941129% |
| B | 74485 | 1520 | 2.040679% |
| C | 74485 | 1178 | 1.581526% |
| D | 74485 | 2020 | 2.711955% |
Noise dominated data is calculated using 1-second bins in cleaned event files. If a bin has >2000 counts, and if more than 50% of those come from <1% of pixels, then it is considered to be noise-dominated and hence unusable.
| Quadrant | # 1 sec bins | Bins with >0 counts | Bins with >2000 counts | High rate bins dominated by noise | Noise dominated (total time) | Noise dominated (detector-on time) | Marked lightcurve |
|---|---|---|---|---|---|---|---|
| A | 86820 | 74475 | 0 | 0 | 0.00% | 0.00% | 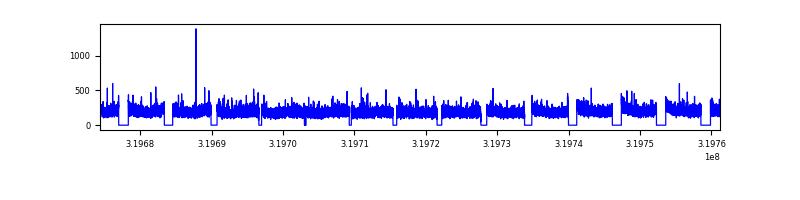 |
| B | 86820 | 74475 | 0 | 0 | 0.00% | 0.00% |  |
| C | 86820 | 74478 | 0 | 0 | 0.00% | 0.00% | 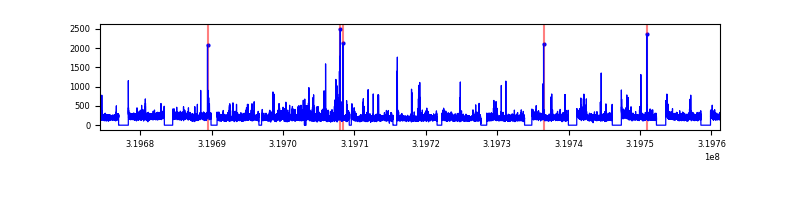 |
| D | 86820 | 74449 | 0 | 0 | 0.00% | 0.00% |  |
Top three noisy pixels from each quadrant. If the there are fewer than three noisy pixels in the level2.evt file, extra rows are filled as -1
| Pixel properties | Quadrant properties | ||||||
|---|---|---|---|---|---|---|---|
| Quadrant | DetID | PixID | Counts | Sigma | Mean | Median | Sigma |
| A | 0 | 29 | 4442 | 11.52 | 1166 | 1095 | 290.6 |
| A | 7 | 110 | 3679 | 8.89 | 1166 | 1095 | 290.6 |
| A | 0 | 30 | 3368 | 7.82 | 1166 | 1095 | 290.6 |
| B | 2 | 9 | 3402 | 10.32 | 1139 | 1090 | 224.1 |
| B | 2 | 8 | 2858 | 7.89 | 1139 | 1090 | 224.1 |
| B | 14 | 254 | 2803 | 7.64 | 1139 | 1090 | 224.1 |
| C | 1 | 80 | 3404 | 7.8 | 1166 | 1095 | 296.1 |
| C | 1 | 81 | 3377 | 7.71 | 1166 | 1095 | 296.1 |
| C | 12 | 241 | 3163 | 6.98 | 1166 | 1095 | 296.1 |
| D | 3 | 14 | 2824 | 6.39 | 1079 | 984 | 287.8 |
| D | 10 | 189 | 2653 | 5.8 | 1079 | 984 | 287.8 |
| D | 6 | 231 | 2640 | 5.75 | 1079 | 984 | 287.8 |
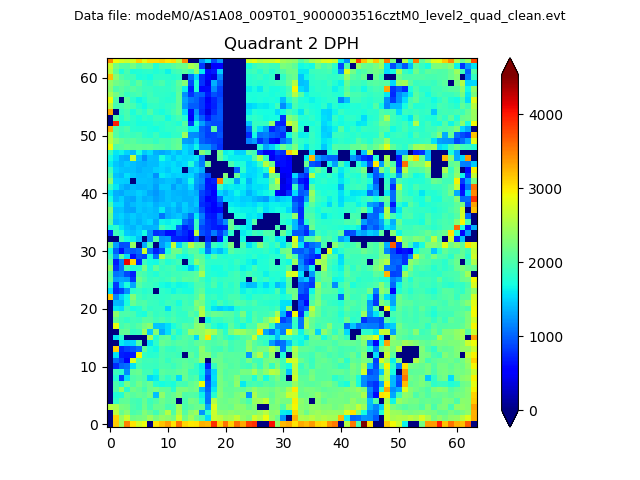
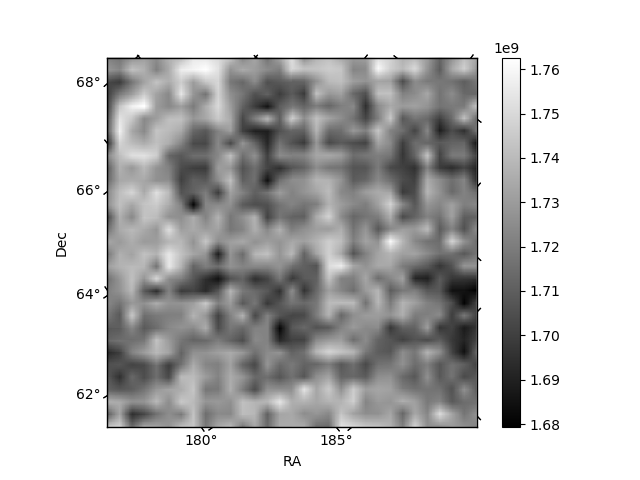
Histogram calculated using DETX and DETY for each event in the final _common_clean file
| Quadrant A |  |
 |
Quadrant B |
|---|---|---|---|
| Quadrant D |  |
 |
Quadrant C |
| Plot type | Count rate plots | Images |
|---|---|---|
| Comparison with Poisson distribution Blue bars denote a histogram of data divided into 1 sec bins. Red curve is a Poisson curve with rate = median count rate of data. |
 |
 |
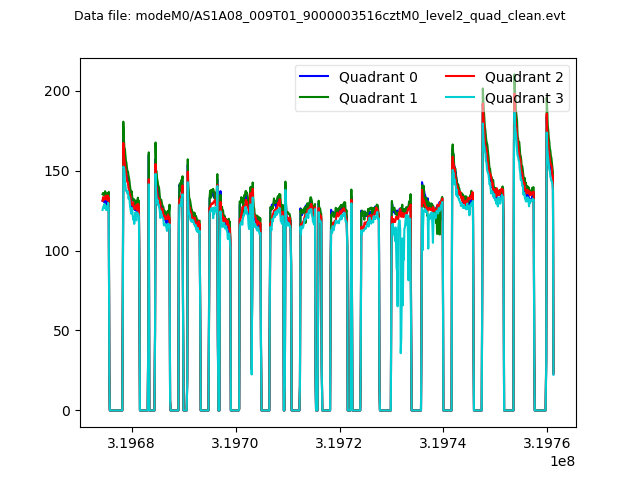
| Quadrant-wise count rates Data is divided into 100 sec bins |
 |
|
| Module-wise count rates for Quadrant A Data is divided into 100 sec bins |
 |
 |
| Module-wise count rates for Quadrant B Data is divided into 100 sec bins |
 |
 |
| Module-wise count rates for Quadrant C Data is divided into 100 sec bins |
 |
 |
| Module-wise count rates for Quadrant D Data is divided into 100 sec bins |
 |
 |
| Parameter | Plot |
|---|---|
| CZT HV Monitor |  |
| D_VDD | 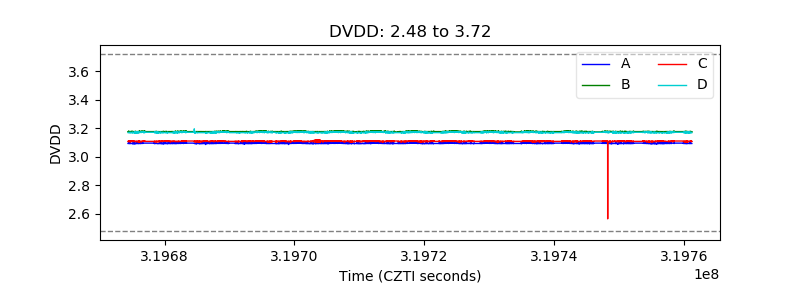 |
| Temperature 1 |  |
| Veto HV Monitor | 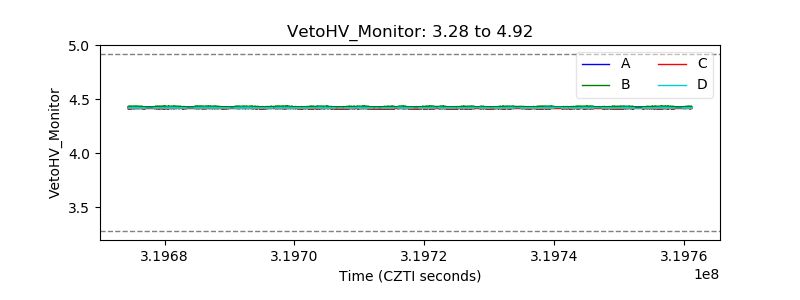 |
| Veto LLD | 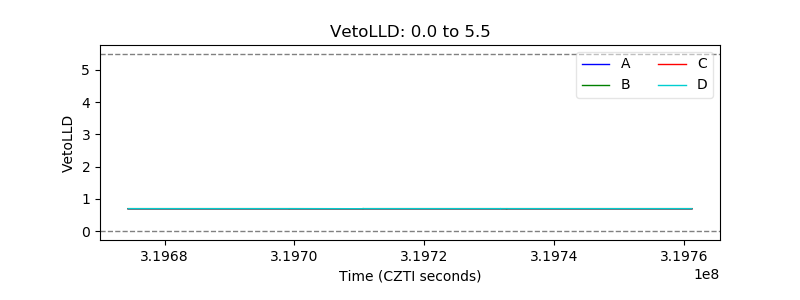 |
| Alpha Counter | 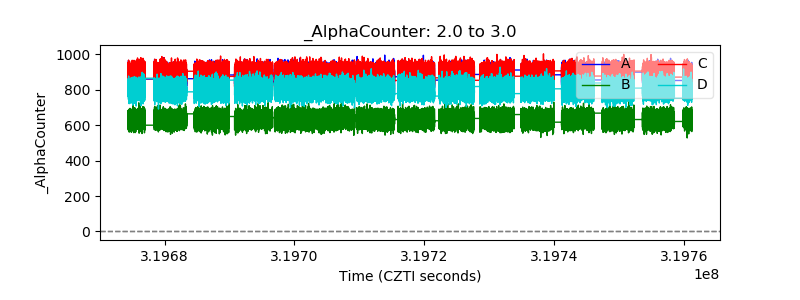 |
| _CPM_Rate |  |
| CZT Counter |  |
| +2.5 Volts monitor |  |
| +5 Volts monitor |  |
| _ROLL_ROT | 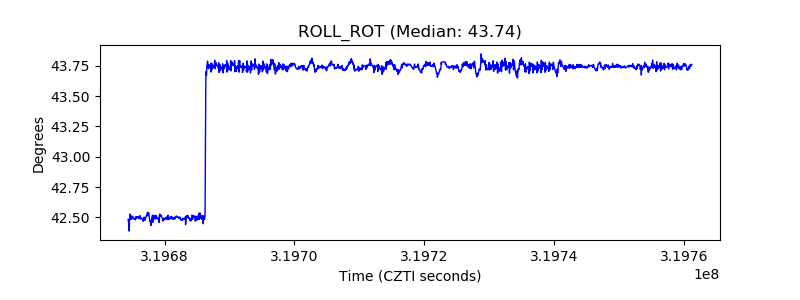 |
| _Roll_DEC |  |
| _Roll_RA |  |
| Veto Counter |  |