| Param | Original file | Final file |
|---|---|---|
| Filename | modeM0/AS1A08_009T01_9000003516_23739cztM0_level2.evt | modeM0/AS1A08_009T01_9000003516_23739cztM0_level2_quad_clean.evt |
| Size (bytes) | 288,872,640 | 58,069,440 |
| Size | 275.5 MB | 55.4 MB |
| Events in quadrant A | 1,901,353 | 371,085 |
| Events in quadrant B | 2,097,401 | 386,913 |
| Events in quadrant C | 1,960,567 | 370,771 |
| Events in quadrant D | 2,521,452 | 352,495 |
| Mode M9 | |||
|---|---|---|---|
| Quadrant | BADHDUFLAG | Total packets | Discarded packets |
| A | 0 | 13 | 0 |
| B | 0 | 13 | 0 |
| C | 0 | 13 | 0 |
| D | 0 | 13 | 0 |
| Mode SS | |||
|---|---|---|---|
| Quadrant | BADHDUFLAG | Total packets | Discarded packets |
| A | 0 | 82 | 0 |
| B | 0 | 82 | 0 |
| C | 0 | 82 | 0 |
| D | 0 | 82 | 0 |
| Mode M0 | |||
|---|---|---|---|
| Quadrant | BADHDUFLAG | Total packets | Discarded packets |
| A | 0 | 8161 | 1 |
| B | 0 | 8686 | 1 |
| C | 0 | 8227 | 1 |
| D | 0 | 10119 | 1 |
| Quadrant | Total seconds | Saturated seconds | Saturation percentage |
|---|---|---|---|
| A | 3917 | 16 | 0.408476% |
| B | 3917 | 62 | 1.582844% |
| C | 3917 | 55 | 1.404136% |
| D | 3917 | 80 | 2.042379% |
Noise dominated data is calculated using 1-second bins in cleaned event files. If a bin has >2000 counts, and if more than 50% of those come from <1% of pixels, then it is considered to be noise-dominated and hence unusable.
| Quadrant | # 1 sec bins | Bins with >0 counts | Bins with >2000 counts | High rate bins dominated by noise | Noise dominated (total time) | Noise dominated (detector-on time) | Marked lightcurve |
|---|---|---|---|---|---|---|---|
| A | 5277 | 3918 | 0 | 0 | 0.00% | 0.00% | 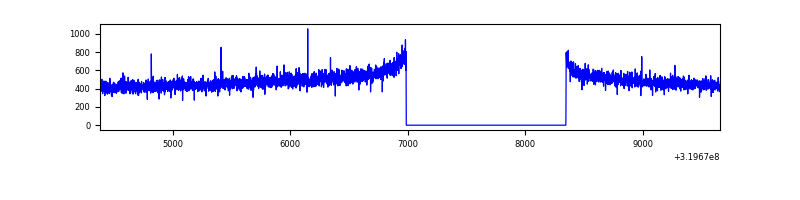 |
| B | 5277 | 3918 | 13 | 13 | 0.25% | 0.33% | 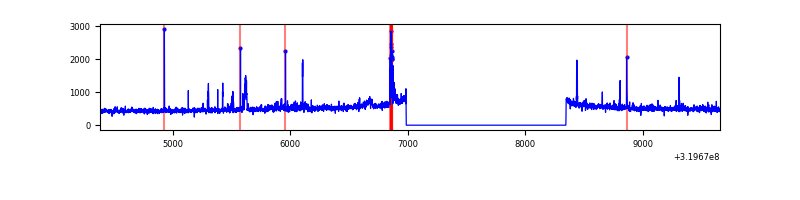 |
| C | 5277 | 3917 | 0 | 0 | 0.00% | 0.00% |  |
| D | 5277 | 3918 | 28 | 28 | 0.53% | 0.71% | 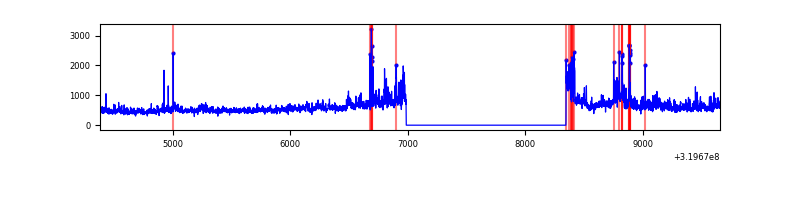 |
Top three noisy pixels from each quadrant. If the there are fewer than three noisy pixels in the level2.evt file, extra rows are filled as -1
| Pixel properties | Quadrant properties | ||||||
|---|---|---|---|---|---|---|---|
| Quadrant | DetID | PixID | Counts | Sigma | Mean | Median | Sigma |
| A | 13 | 254 | 6519 | 60.54 | 493 | 484 | 99.7 |
| A | 3 | 137 | 4136 | 36.64 | 493 | 484 | 99.7 |
| A | 0 | 226 | 4110 | 36.37 | 493 | 484 | 99.7 |
| B | 3 | 64 | 100550 | 1084.66 | 494 | 481 | 92.3 |
| B | 0 | 189 | 31202 | 332.99 | 494 | 481 | 92.3 |
| B | 0 | 229 | 15513 | 162.93 | 494 | 481 | 92.3 |
| C | 14 | 238 | 77108 | 695.44 | 475 | 479 | 110.2 |
| C | 10 | 9 | 11211 | 97.4 | 475 | 479 | 110.2 |
| C | 10 | 91 | 7142 | 60.47 | 475 | 479 | 110.2 |
| D | 8 | 195 | 623117 | 5447.58 | 472 | 459 | 114.3 |
| D | 1 | 52 | 104251 | 908.07 | 472 | 459 | 114.3 |
| D | 2 | 234 | 16129 | 137.1 | 472 | 459 | 114.3 |
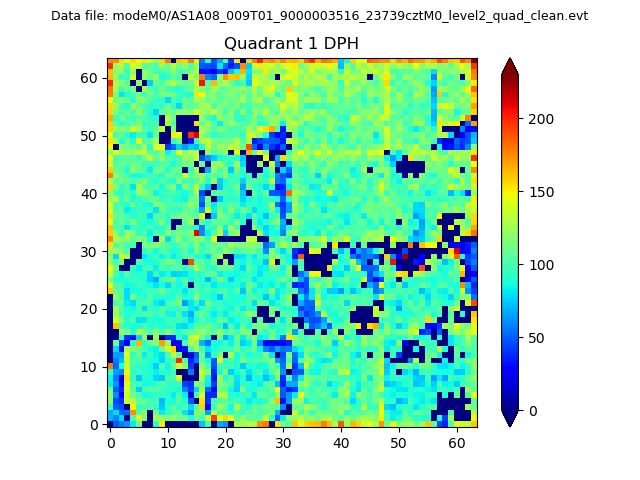
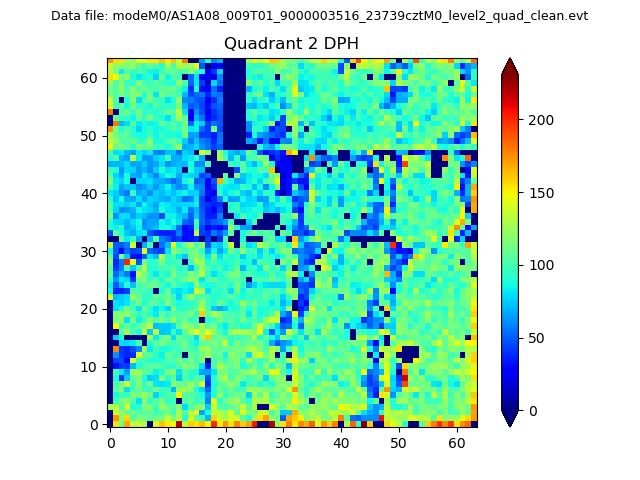
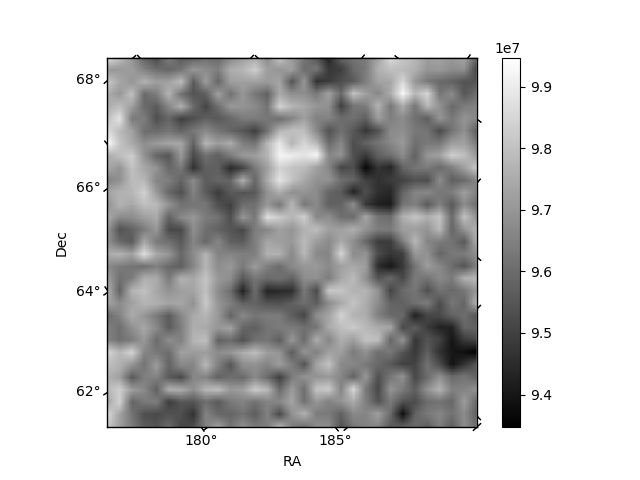
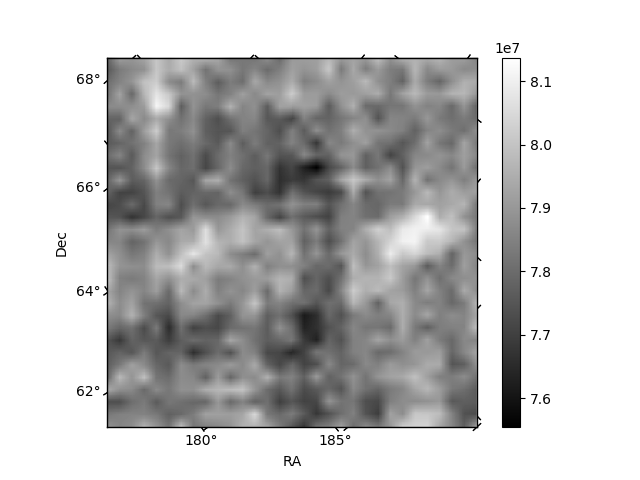
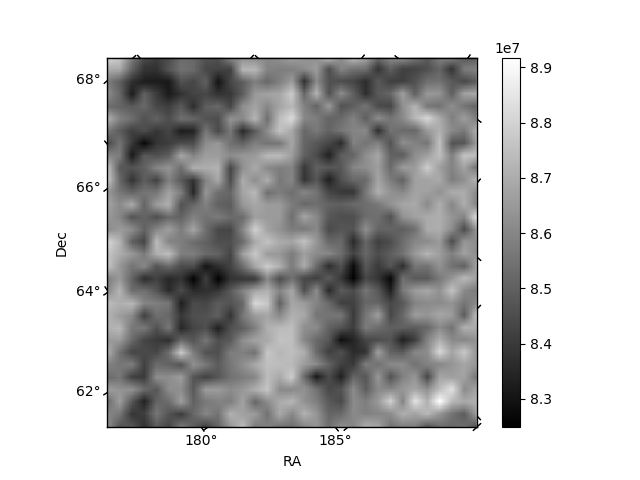
Histogram calculated using DETX and DETY for each event in the final _common_clean file
| Quadrant A |  |
 |
Quadrant B |
|---|---|---|---|
| Quadrant D |  |
 |
Quadrant C |
| Plot type | Count rate plots | Images |
|---|---|---|
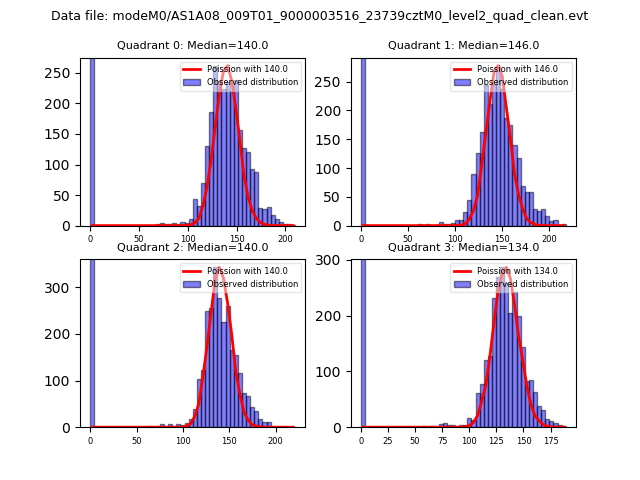
| Comparison with Poisson distribution Blue bars denote a histogram of data divided into 1 sec bins. Red curve is a Poisson curve with rate = median count rate of data. |
 |
 |
| Quadrant-wise count rates Data is divided into 100 sec bins |
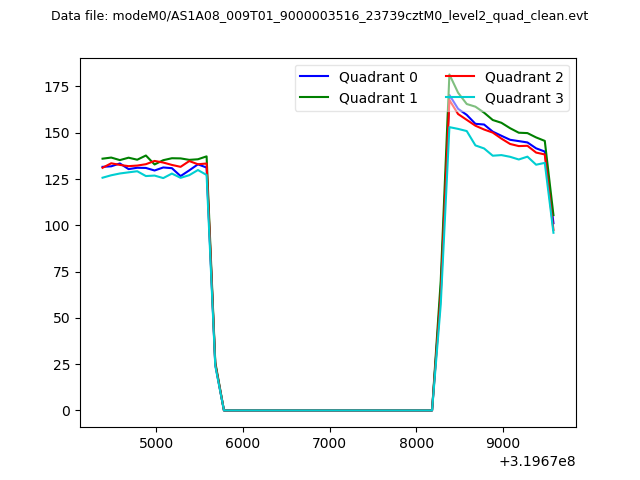 |
|
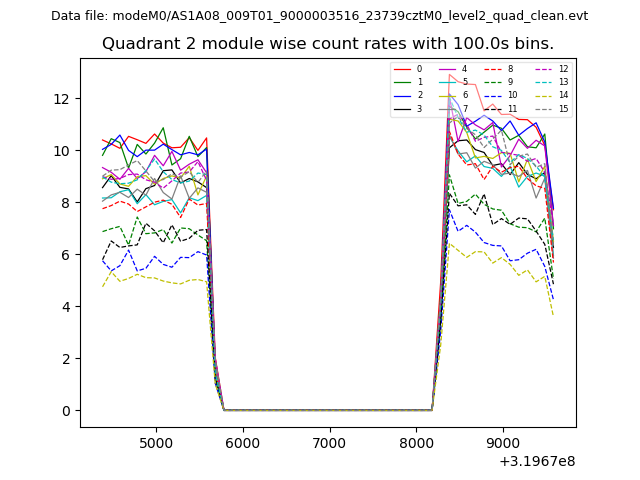
| Module-wise count rates for Quadrant A Data is divided into 100 sec bins |
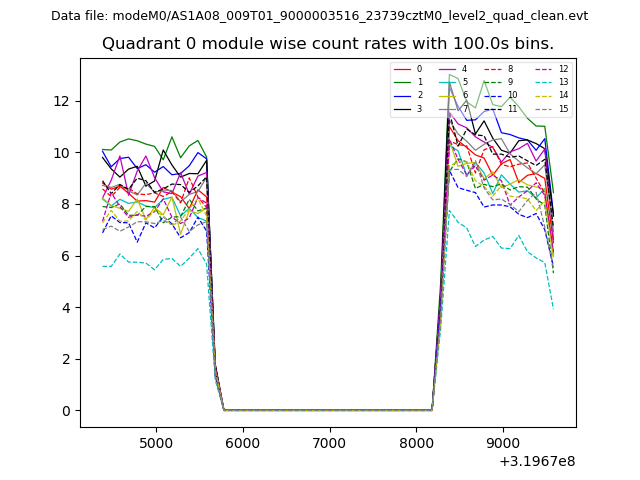 |
 |
| Module-wise count rates for Quadrant B Data is divided into 100 sec bins |
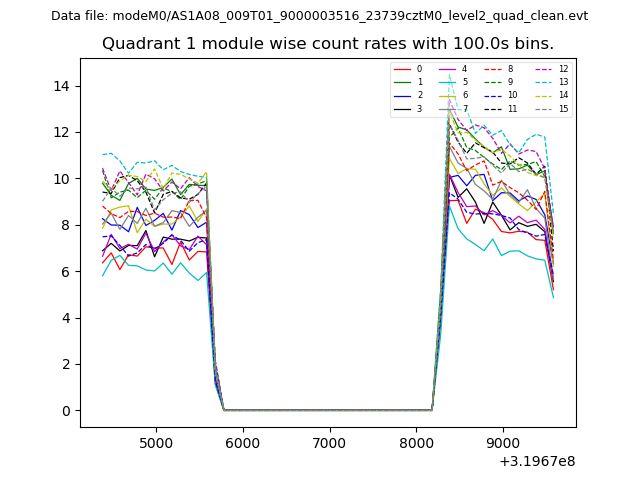 |
 |
| Module-wise count rates for Quadrant C Data is divided into 100 sec bins |
 |
 |
| Module-wise count rates for Quadrant D Data is divided into 100 sec bins |
 |
 |
| Parameter | Plot |
|---|---|
| CZT HV Monitor | 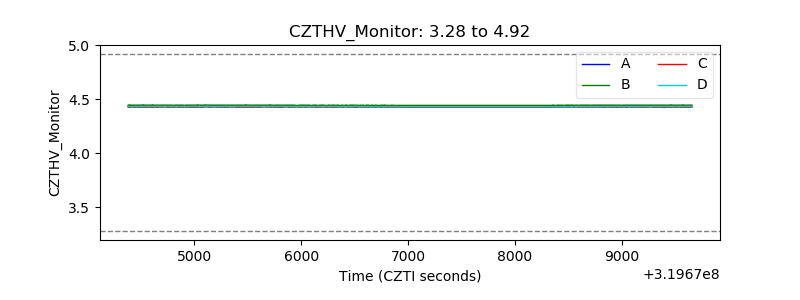 |
| D_VDD | 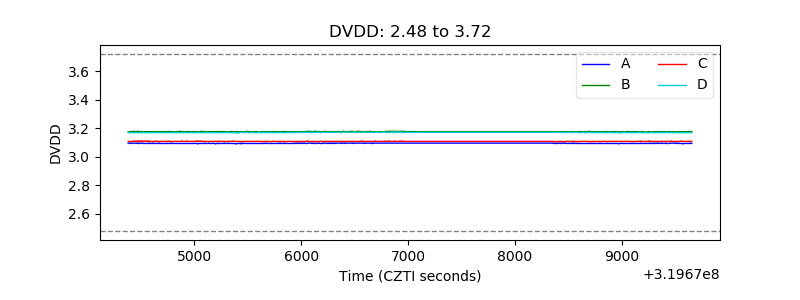 |
| Temperature 1 | 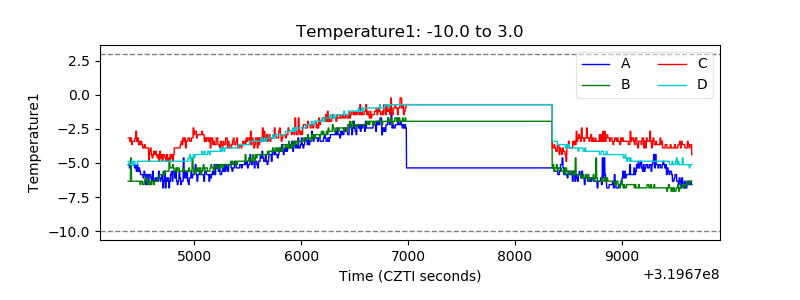 |
| Veto HV Monitor | 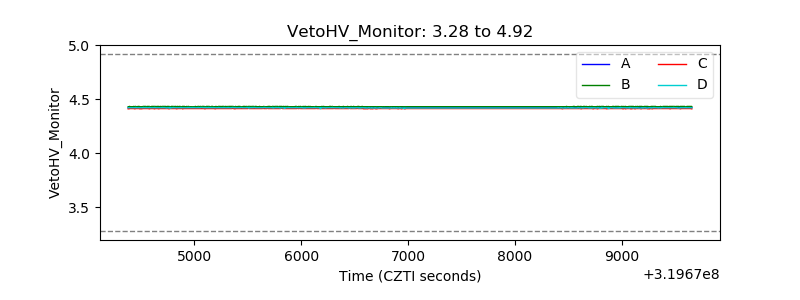 |
| Veto LLD | 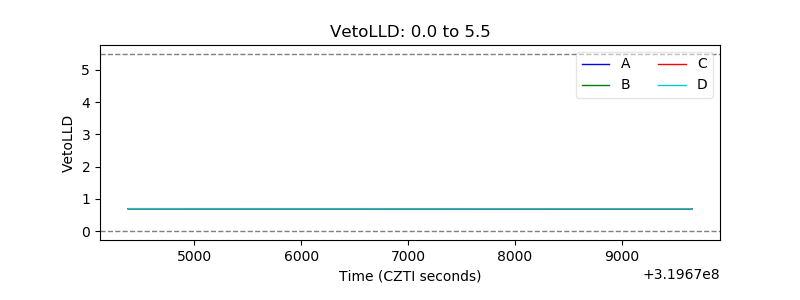 |
| Alpha Counter | 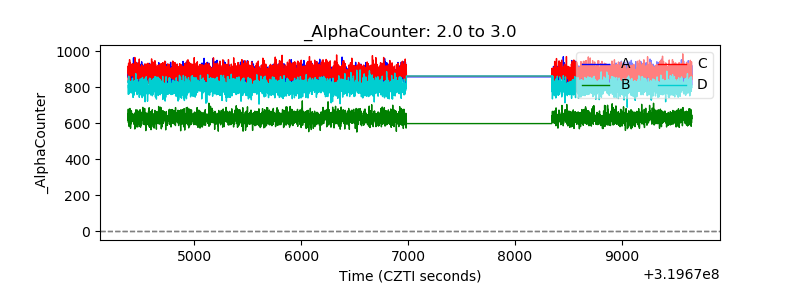 |
| _CPM_Rate | 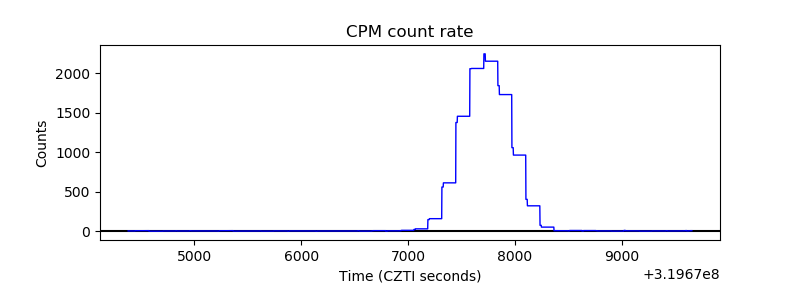 |
| CZT Counter | 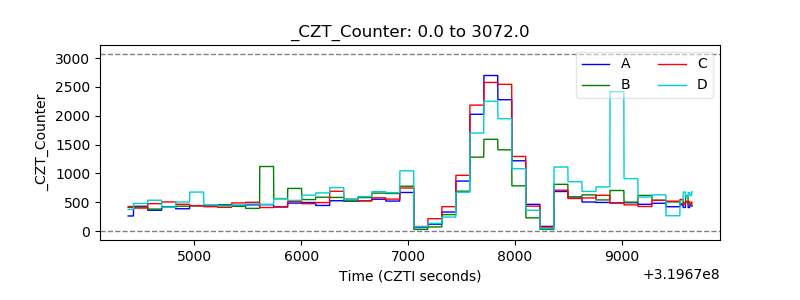 |
| +2.5 Volts monitor |  |
| +5 Volts monitor |  |
| _ROLL_ROT |  |
| _Roll_DEC | 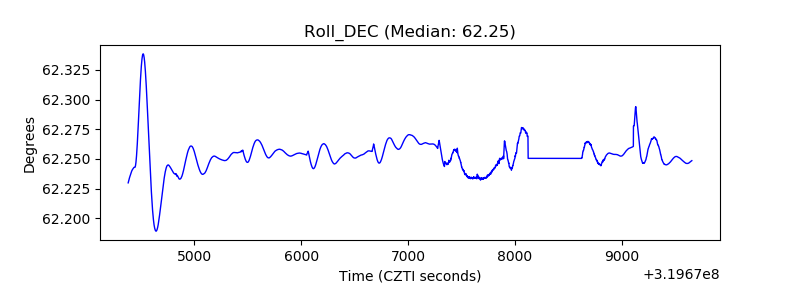 |
| _Roll_RA | 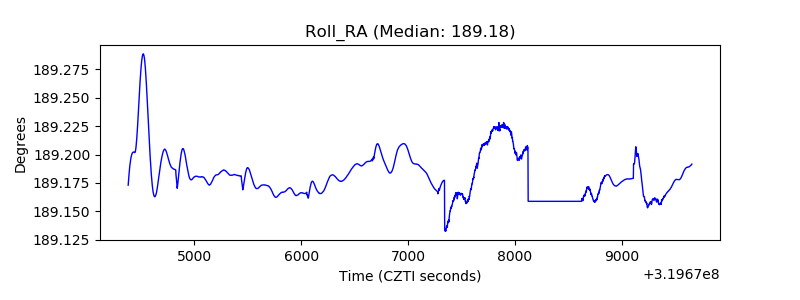 |
| Veto Counter | 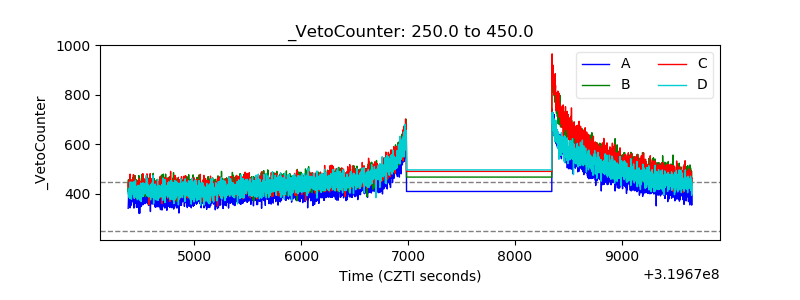 |