| Param | Original file | Final file |
|---|---|---|
| Filename | modeM0/AS1A08_009T01_9000003516_23741cztM0_level2.evt | modeM0/AS1A08_009T01_9000003516_23741cztM0_level2_quad_clean.evt |
| Size (bytes) | 501,200,640 | 108,414,720 |
| Size | 478.0 MB | 103.4 MB |
| Events in quadrant A | 3,256,698 | 704,259 |
| Events in quadrant B | 3,586,642 | 724,133 |
| Events in quadrant C | 3,608,386 | 691,136 |
| Events in quadrant D | 4,244,321 | 668,627 |
| Mode M9 | |||
|---|---|---|---|
| Quadrant | BADHDUFLAG | Total packets | Discarded packets |
| A | 0 | 20 | 0 |
| B | 0 | 20 | 0 |
| C | 0 | 20 | 0 |
| D | 0 | 20 | 0 |
| Mode SS | |||
|---|---|---|---|
| Quadrant | BADHDUFLAG | Total packets | Discarded packets |
| A | 0 | 148 | 0 |
| B | 0 | 148 | 0 |
| C | 0 | 148 | 0 |
| D | 0 | 148 | 0 |
| Mode M0 | |||
|---|---|---|---|
| Quadrant | BADHDUFLAG | Total packets | Discarded packets |
| A | 0 | 14619 | 2 |
| B | 0 | 15305 | 3 |
| C | 0 | 15212 | 2 |
| D | 0 | 17517 | 2 |
| Quadrant | Total seconds | Saturated seconds | Saturation percentage |
|---|---|---|---|
| A | 7105 | 22 | 0.309641% |
| B | 7105 | 74 | 1.041520% |
| C | 7105 | 114 | 1.604504% |
| D | 7105 | 57 | 0.802252% |
Noise dominated data is calculated using 1-second bins in cleaned event files. If a bin has >2000 counts, and if more than 50% of those come from <1% of pixels, then it is considered to be noise-dominated and hence unusable.
| Quadrant | # 1 sec bins | Bins with >0 counts | Bins with >2000 counts | High rate bins dominated by noise | Noise dominated (total time) | Noise dominated (detector-on time) | Marked lightcurve |
|---|---|---|---|---|---|---|---|
| A | 9130 | 7107 | 0 | 0 | 0.00% | 0.00% | 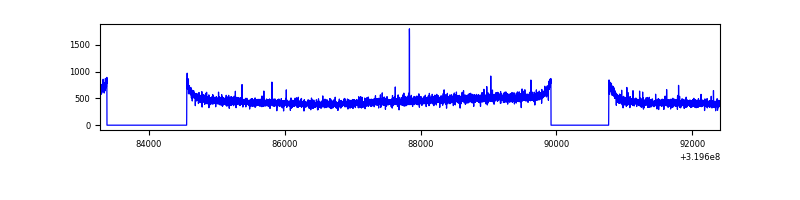 |
| B | 9130 | 7107 | 5 | 5 | 0.05% | 0.07% | 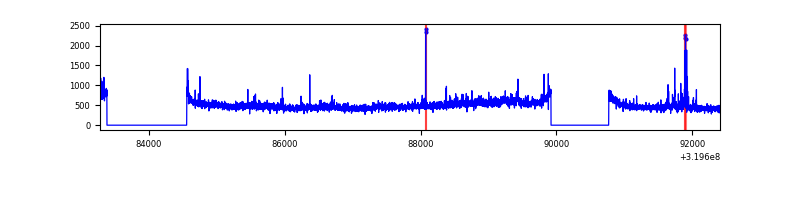 |
| C | 9130 | 7107 | 1 | 1 | 0.01% | 0.01% | 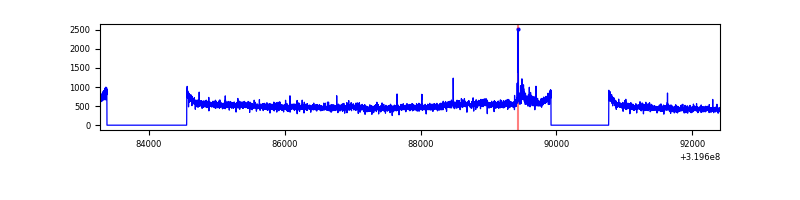 |
| D | 9130 | 7107 | 12 | 12 | 0.13% | 0.17% | 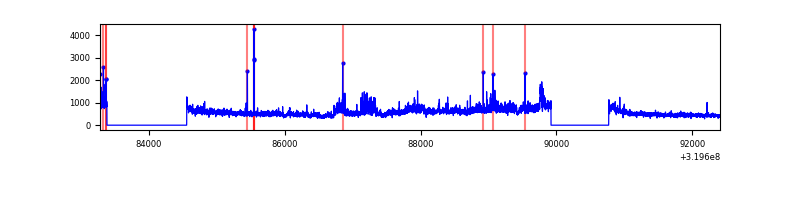 |
Top three noisy pixels from each quadrant. If the there are fewer than three noisy pixels in the level2.evt file, extra rows are filled as -1
| Pixel properties | Quadrant properties | ||||||
|---|---|---|---|---|---|---|---|
| Quadrant | DetID | PixID | Counts | Sigma | Mean | Median | Sigma |
| A | 13 | 254 | 11879 | 65.09 | 844 | 827 | 169.8 |
| A | 3 | 137 | 7398 | 38.7 | 844 | 827 | 169.8 |
| A | 0 | 226 | 7106 | 36.98 | 844 | 827 | 169.8 |
| B | 0 | 189 | 108291 | 671.59 | 851 | 831 | 160.0 |
| B | 0 | 229 | 62263 | 383.93 | 851 | 831 | 160.0 |
| B | 3 | 64 | 54578 | 335.9 | 851 | 831 | 160.0 |
| C | 10 | 9 | 233785 | 1220.71 | 814 | 816 | 190.8 |
| C | 14 | 238 | 131857 | 686.63 | 814 | 816 | 190.8 |
| C | 7 | 247 | 48931 | 252.11 | 814 | 816 | 190.8 |
| D | 8 | 195 | 1056206 | 5330.8 | 814 | 787 | 198.0 |
| D | 1 | 52 | 34157 | 168.55 | 814 | 787 | 198.0 |
| D | 2 | 234 | 28552 | 140.24 | 814 | 787 | 198.0 |
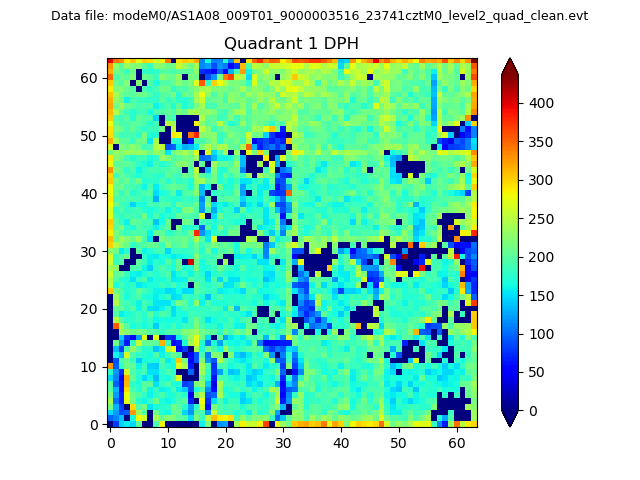
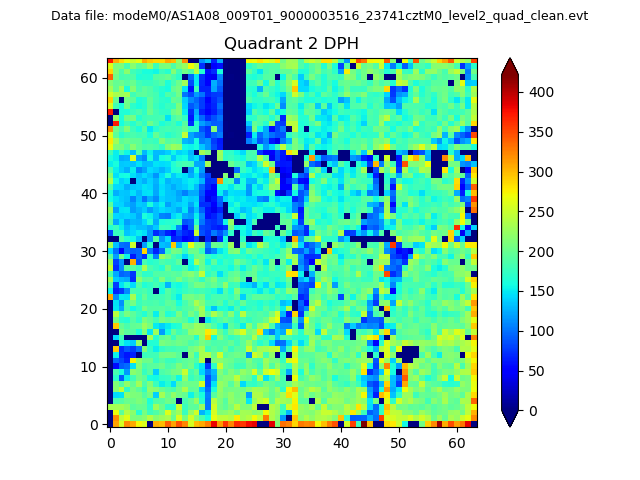
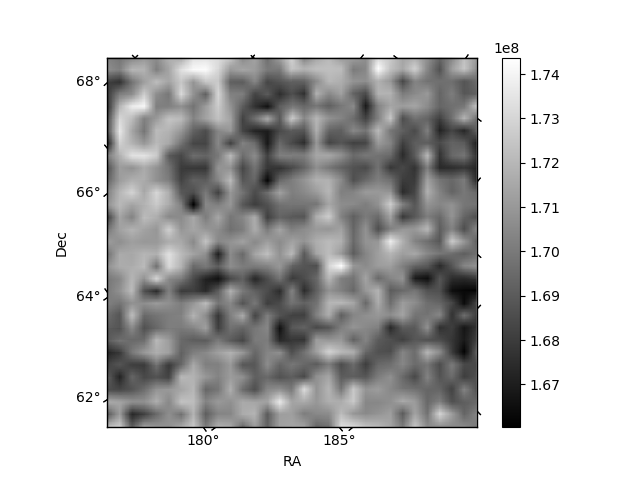
Histogram calculated using DETX and DETY for each event in the final _common_clean file
| Quadrant A |  |
 |
Quadrant B |
|---|---|---|---|
| Quadrant D | 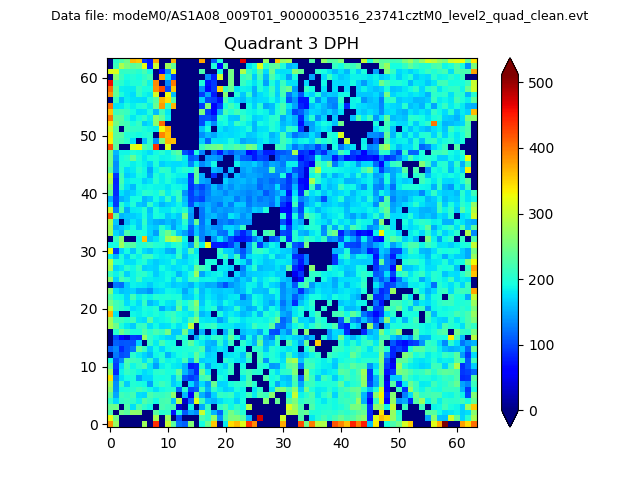 |
 |
Quadrant C |
| Plot type | Count rate plots | Images |
|---|---|---|
| Comparison with Poisson distribution Blue bars denote a histogram of data divided into 1 sec bins. Red curve is a Poisson curve with rate = median count rate of data. |
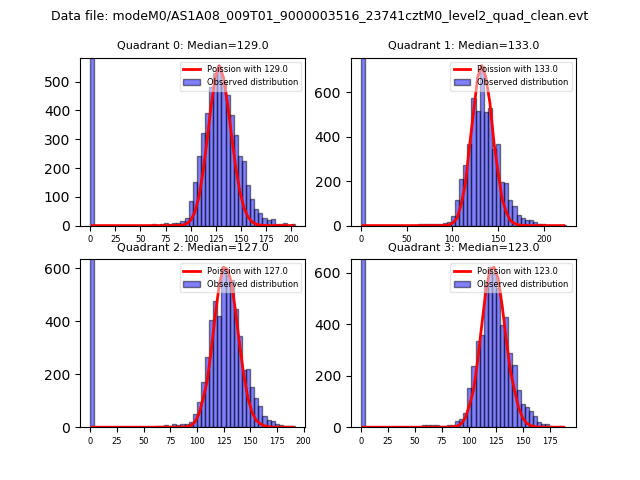 |
 |
| Quadrant-wise count rates Data is divided into 100 sec bins |
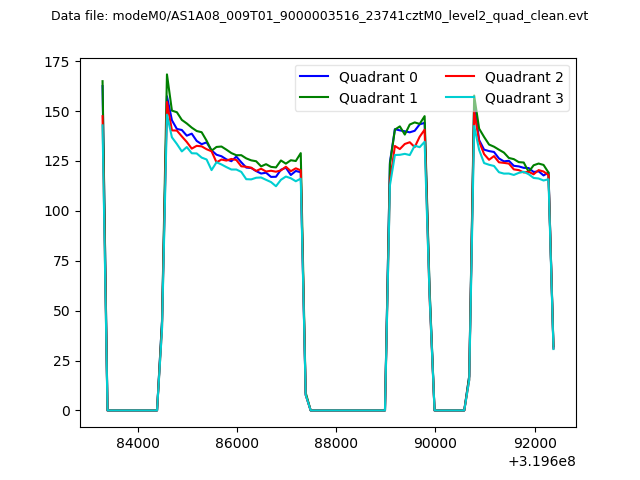 |
|
| Module-wise count rates for Quadrant A Data is divided into 100 sec bins |
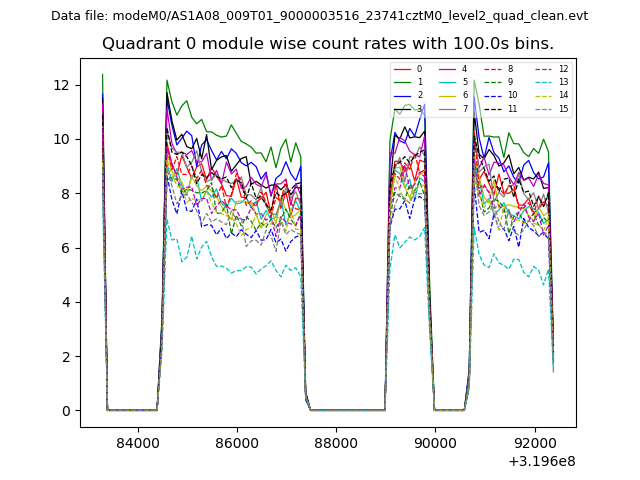 |
 |
| Module-wise count rates for Quadrant B Data is divided into 100 sec bins |
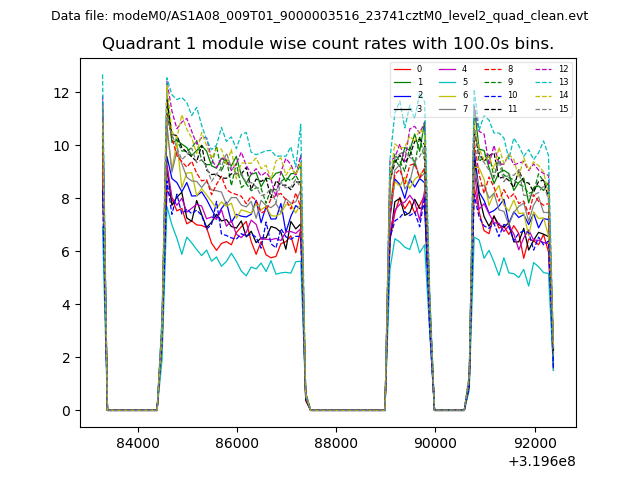 |
 |
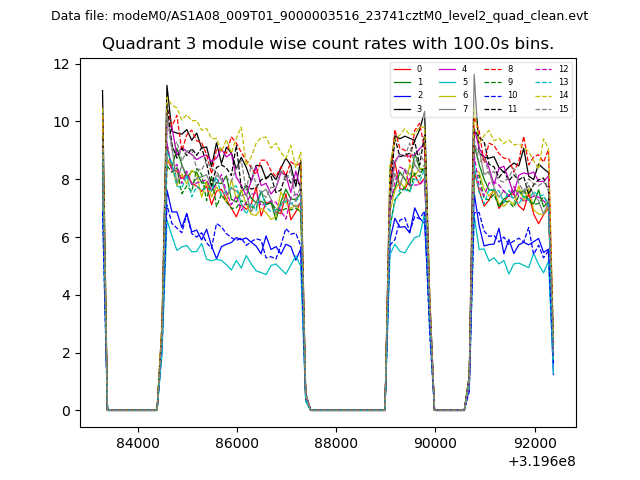
| Module-wise count rates for Quadrant C Data is divided into 100 sec bins |
 |
 |
| Module-wise count rates for Quadrant D Data is divided into 100 sec bins |
 |
 |
| Parameter | Plot |
|---|---|
| CZT HV Monitor |  |
| D_VDD | 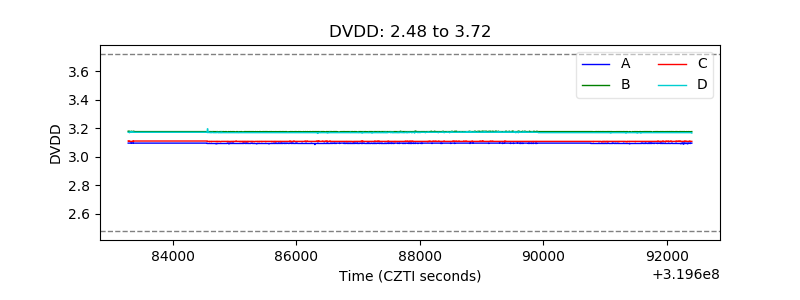 |
| Temperature 1 | 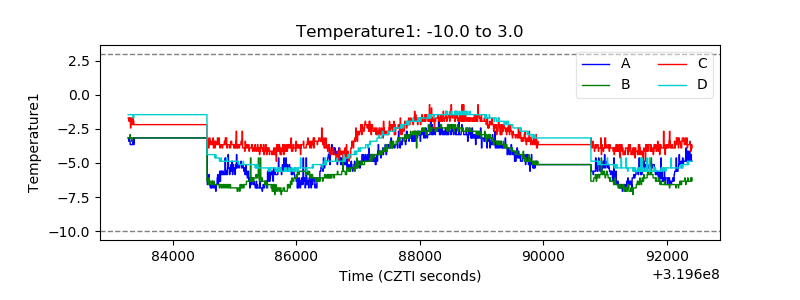 |
| Veto HV Monitor | 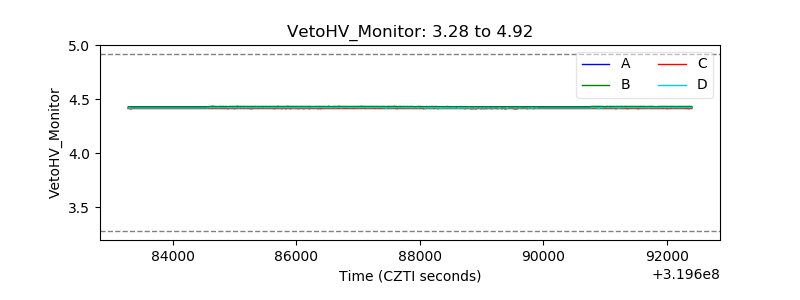 |
| Veto LLD | 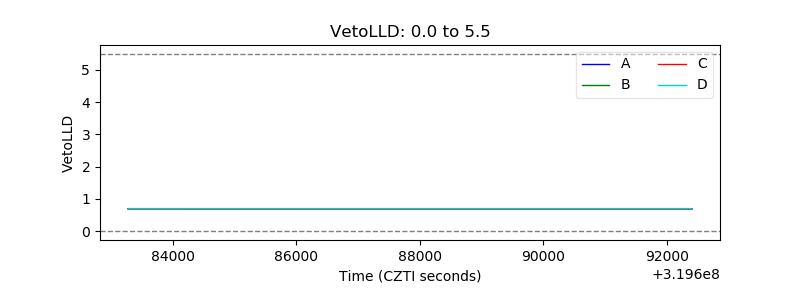 |
| Alpha Counter | 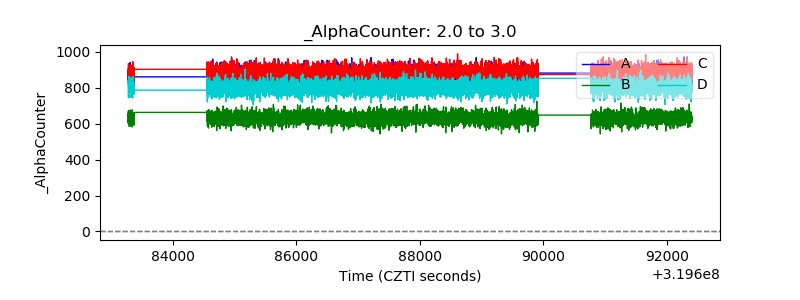 |
| _CPM_Rate | 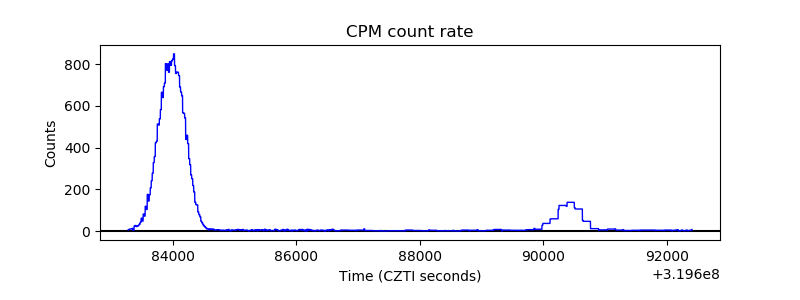 |
| CZT Counter | 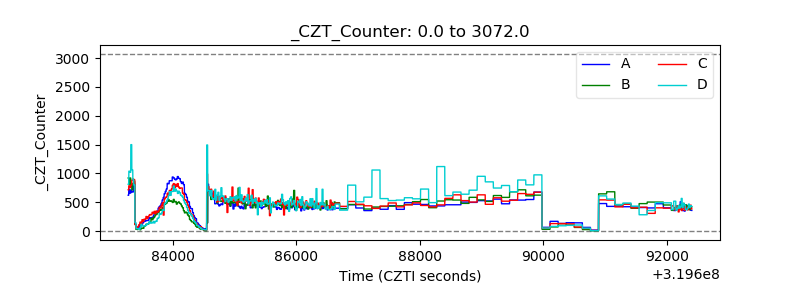 |
| +2.5 Volts monitor |  |
| +5 Volts monitor |  |
| _ROLL_ROT | 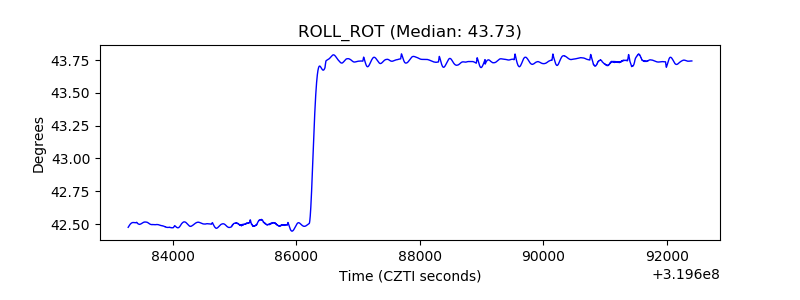 |
| _Roll_DEC | 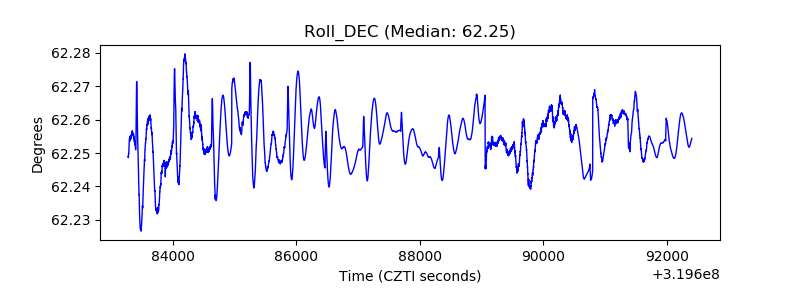 |
| _Roll_RA | 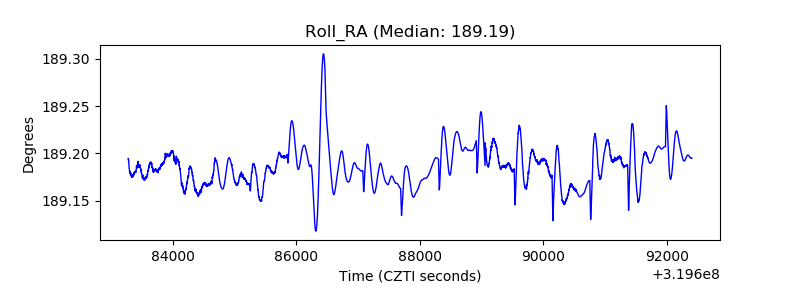 |
| Veto Counter | 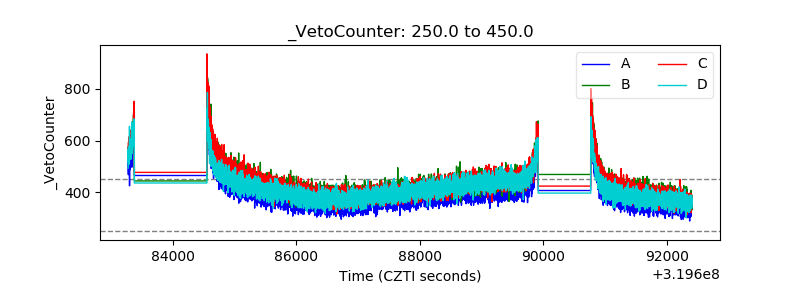 |