| Param | Original file | Final file |
|---|---|---|
| Filename | modeM0/AS1A08_009T01_9000003516_23742cztM0_level2.evt | modeM0/AS1A08_009T01_9000003516_23742cztM0_level2_quad_clean.evt |
| Size (bytes) | 487,152,000 | 100,681,920 |
| Size | 464.6 MB | 96.0 MB |
| Events in quadrant A | 3,104,835 | 647,577 |
| Events in quadrant B | 3,493,070 | 661,934 |
| Events in quadrant C | 3,280,022 | 640,658 |
| Events in quadrant D | 4,406,813 | 618,122 |
| Mode M9 | |||
|---|---|---|---|
| Quadrant | BADHDUFLAG | Total packets | Discarded packets |
| A | 0 | 4 | 0 |
| B | 0 | 4 | 0 |
| C | 0 | 4 | 0 |
| D | 0 | 4 | 0 |
| Mode SS | |||
|---|---|---|---|
| Quadrant | BADHDUFLAG | Total packets | Discarded packets |
| A | 0 | 140 | 0 |
| B | 0 | 140 | 0 |
| C | 0 | 140 | 0 |
| D | 0 | 140 | 0 |
| Mode M0 | |||
|---|---|---|---|
| Quadrant | BADHDUFLAG | Total packets | Discarded packets |
| A | 0 | 14050 | 1 |
| B | 0 | 15024 | 1 |
| C | 0 | 14316 | 1 |
| D | 0 | 18030 | 1 |
| Quadrant | Total seconds | Saturated seconds | Saturation percentage |
|---|---|---|---|
| A | 6902 | 65 | 0.941756% |
| B | 6902 | 115 | 1.666184% |
| C | 6902 | 94 | 1.361924% |
| D | 6902 | 63 | 0.912779% |
Noise dominated data is calculated using 1-second bins in cleaned event files. If a bin has >2000 counts, and if more than 50% of those come from <1% of pixels, then it is considered to be noise-dominated and hence unusable.
| Quadrant | # 1 sec bins | Bins with >0 counts | Bins with >2000 counts | High rate bins dominated by noise | Noise dominated (total time) | Noise dominated (detector-on time) | Marked lightcurve |
|---|---|---|---|---|---|---|---|
| A | 7292 | 6902 | 0 | 0 | 0.00% | 0.00% | 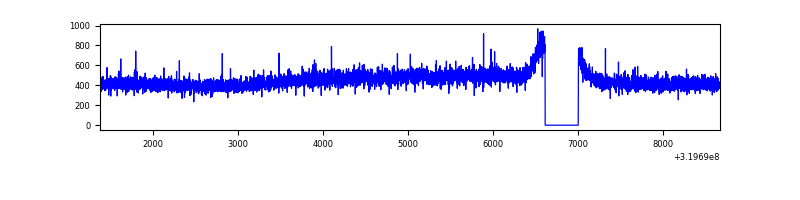 |
| B | 7292 | 6902 | 7 | 7 | 0.10% | 0.10% | 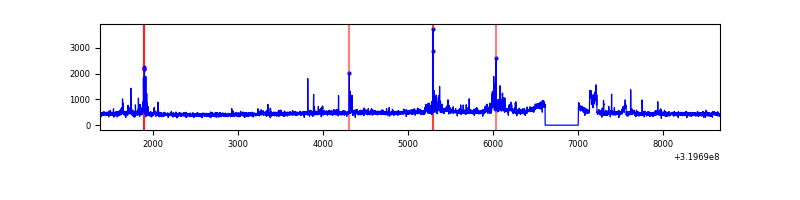 |
| C | 7292 | 6903 | 0 | 0 | 0.00% | 0.00% | 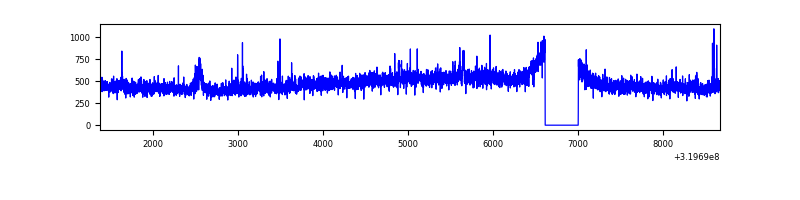 |
| D | 7291 | 6902 | 19 | 19 | 0.26% | 0.28% | 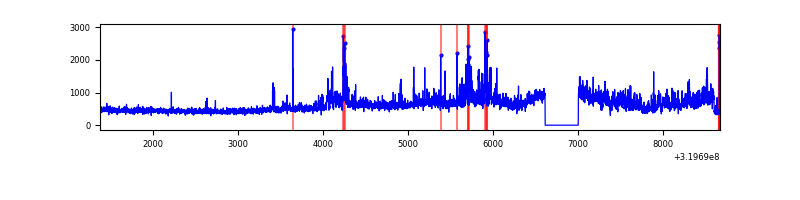 |
Top three noisy pixels from each quadrant. If the there are fewer than three noisy pixels in the level2.evt file, extra rows are filled as -1
| Pixel properties | Quadrant properties | ||||||
|---|---|---|---|---|---|---|---|
| Quadrant | DetID | PixID | Counts | Sigma | Mean | Median | Sigma |
| A | 13 | 254 | 11455 | 65.56 | 805 | 787 | 162.7 |
| A | 3 | 137 | 7267 | 39.82 | 805 | 787 | 162.7 |
| A | 0 | 226 | 7016 | 38.28 | 805 | 787 | 162.7 |
| B | 0 | 229 | 230051 | 1489.74 | 806 | 784 | 153.9 |
| B | 3 | 64 | 39785 | 253.42 | 806 | 784 | 153.9 |
| B | 0 | 189 | 34812 | 221.11 | 806 | 784 | 153.9 |
| C | 14 | 238 | 123192 | 671.88 | 773 | 776 | 182.2 |
| C | 10 | 9 | 72494 | 393.63 | 773 | 776 | 182.2 |
| C | 7 | 247 | 53403 | 288.84 | 773 | 776 | 182.2 |
| D | 8 | 195 | 1273008 | 6711.69 | 777 | 752 | 189.6 |
| D | 1 | 52 | 131395 | 689.2 | 777 | 752 | 189.6 |
| D | 2 | 234 | 27937 | 143.41 | 777 | 752 | 189.6 |
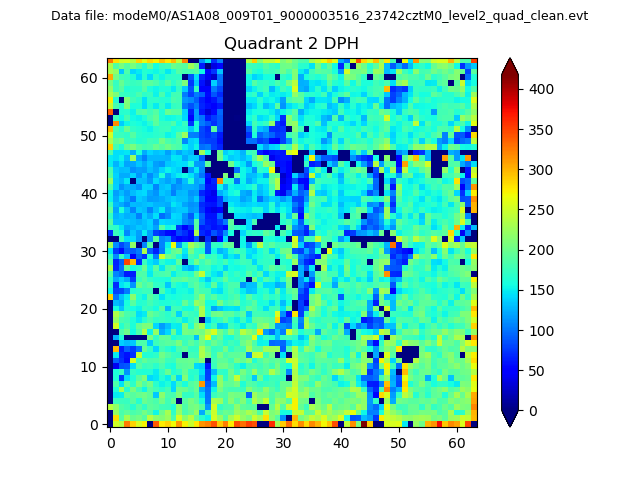
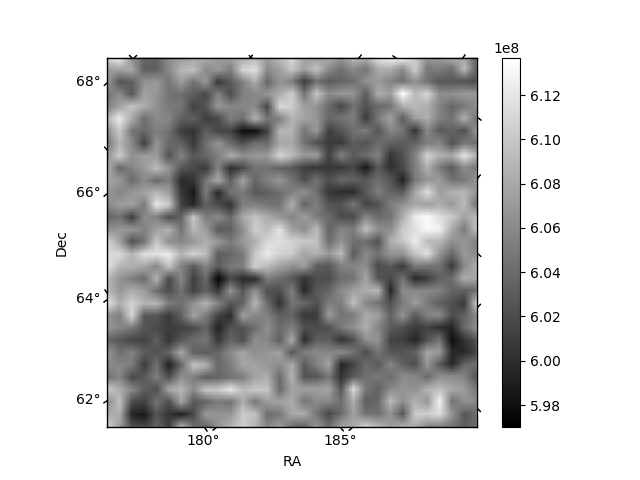
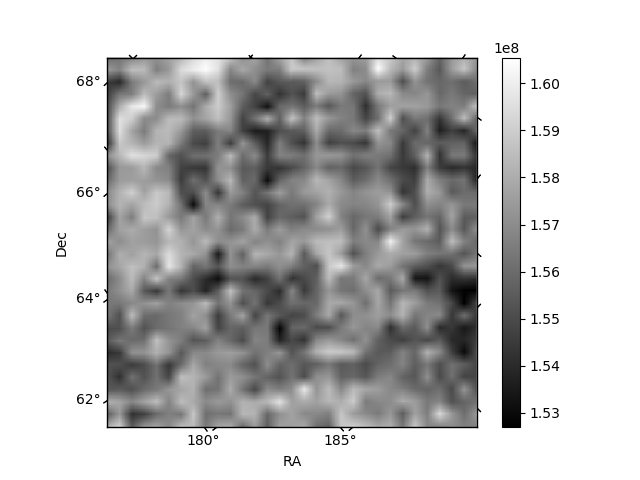
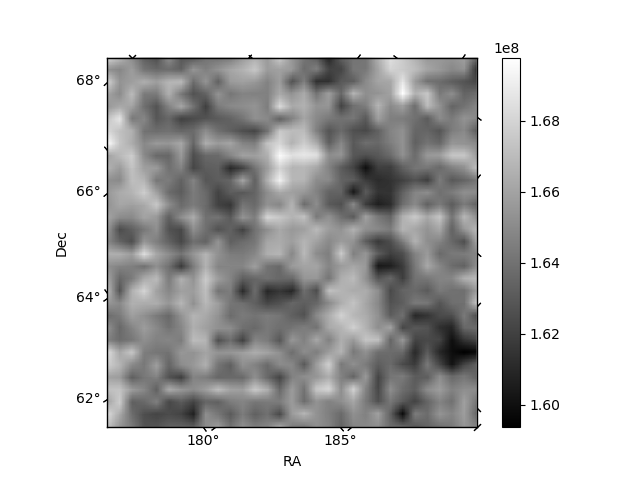
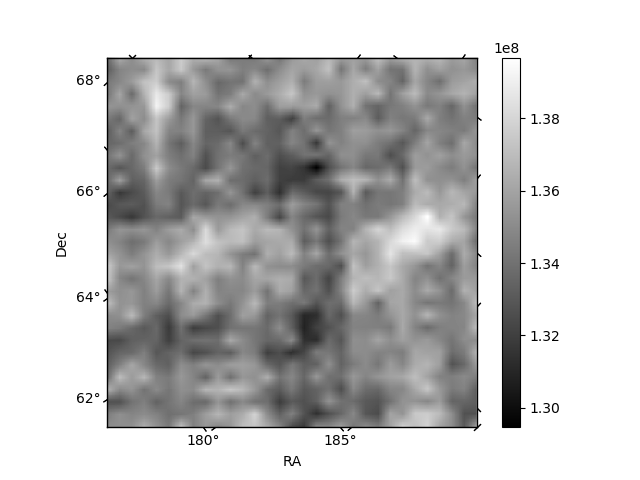
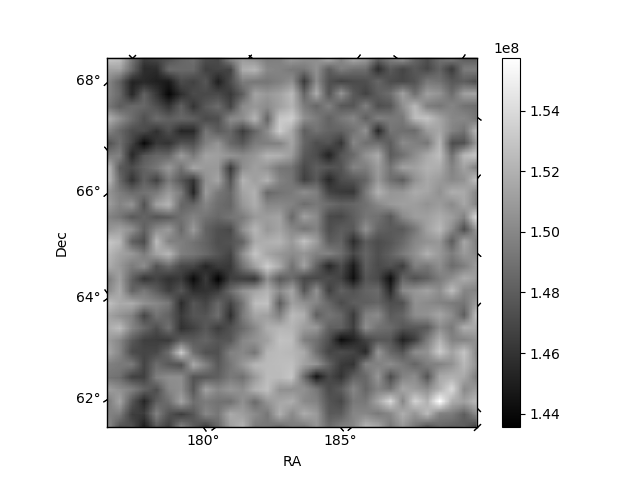
Histogram calculated using DETX and DETY for each event in the final _common_clean file
| Quadrant A |  |
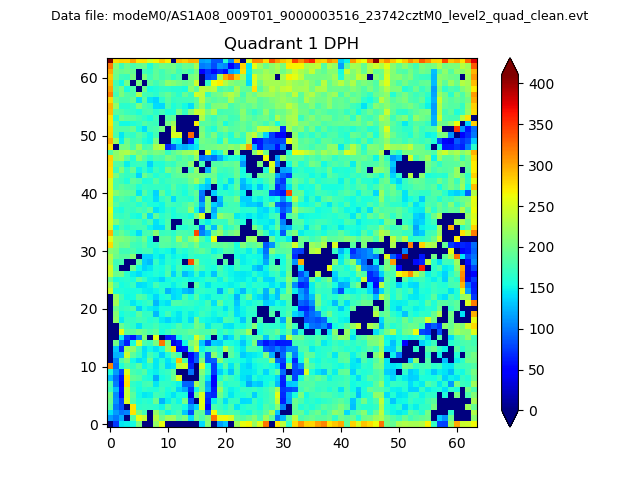 |
Quadrant B |
|---|---|---|---|
| Quadrant D | 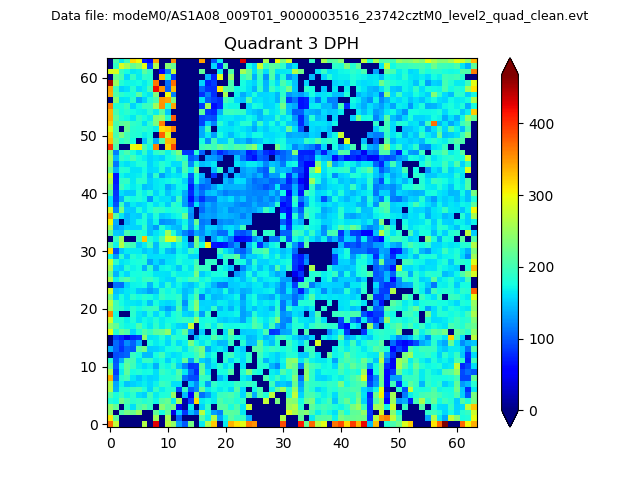 |
 |
Quadrant C |
| Plot type | Count rate plots | Images |
|---|---|---|
| Comparison with Poisson distribution Blue bars denote a histogram of data divided into 1 sec bins. Red curve is a Poisson curve with rate = median count rate of data. |
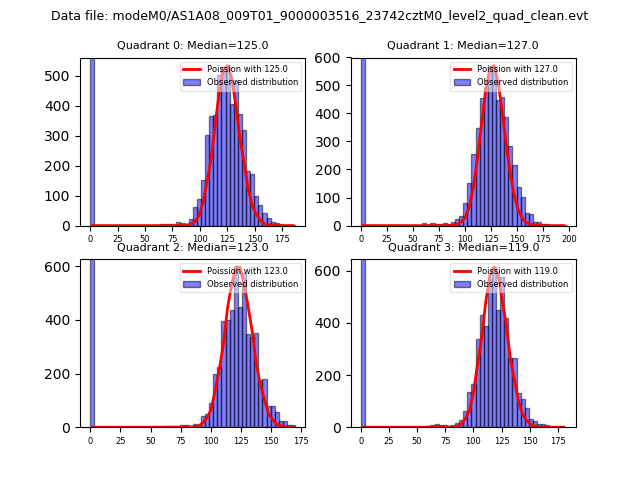 |
 |
| Quadrant-wise count rates Data is divided into 100 sec bins |
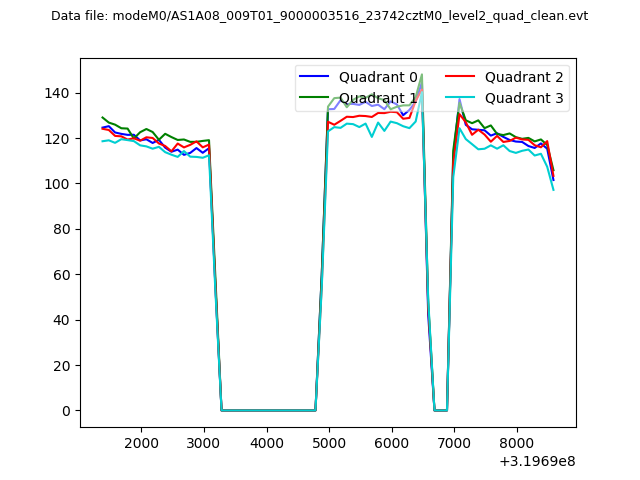 |
|
| Module-wise count rates for Quadrant A Data is divided into 100 sec bins |
 |
 |
| Module-wise count rates for Quadrant B Data is divided into 100 sec bins |
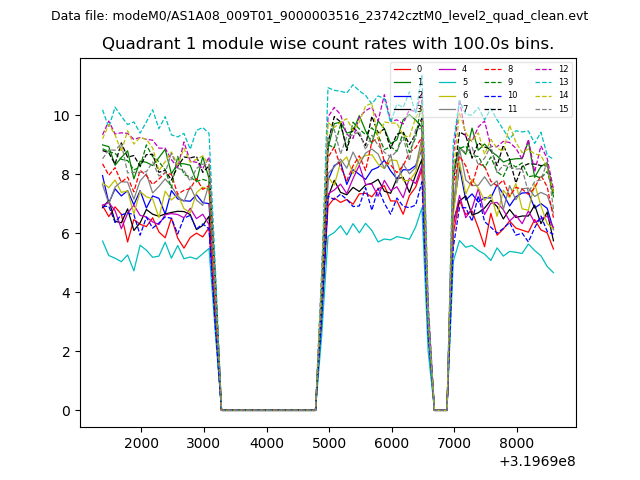 |
 |
| Module-wise count rates for Quadrant C Data is divided into 100 sec bins |
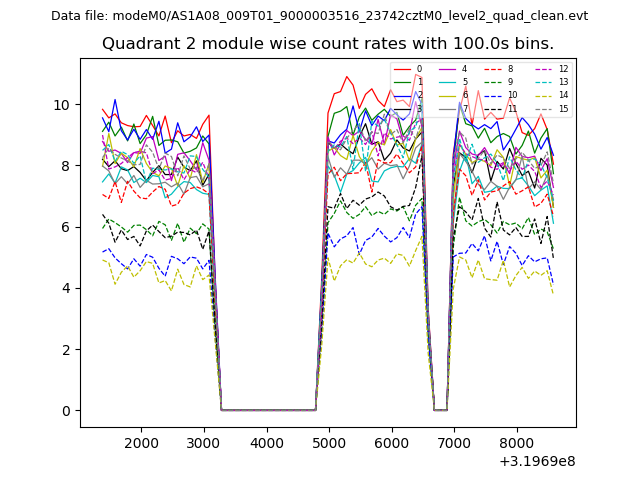 |
 |
| Module-wise count rates for Quadrant D Data is divided into 100 sec bins |
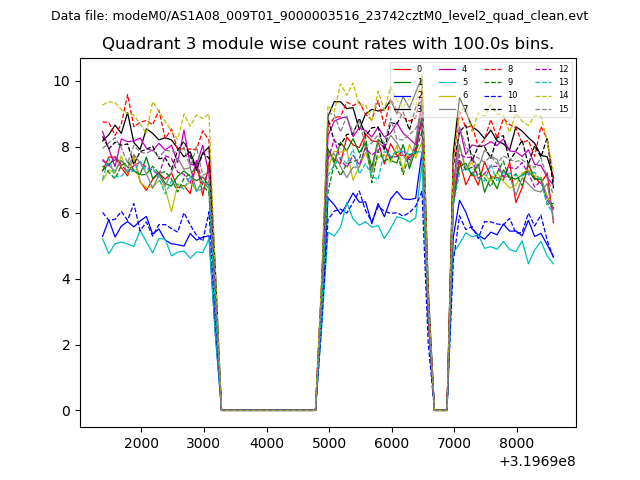 |
 |
| Parameter | Plot |
|---|---|
| CZT HV Monitor | 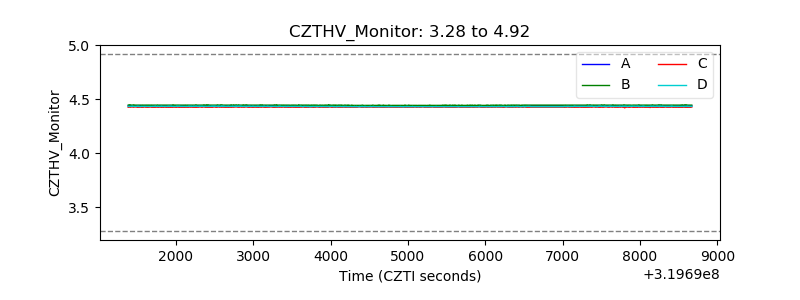 |
| D_VDD | 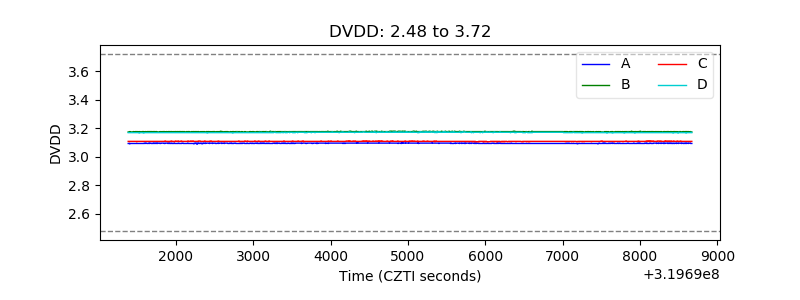 |
| Temperature 1 | 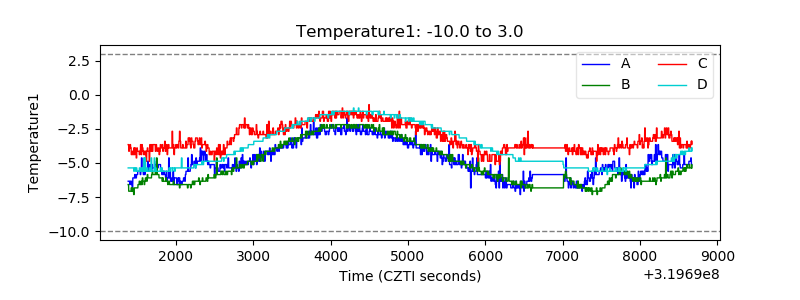 |
| Veto HV Monitor | 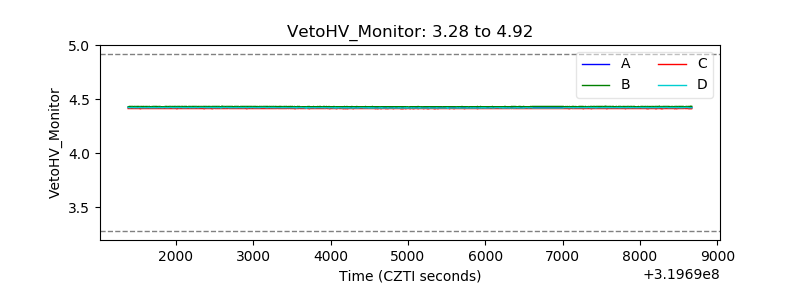 |
| Veto LLD | 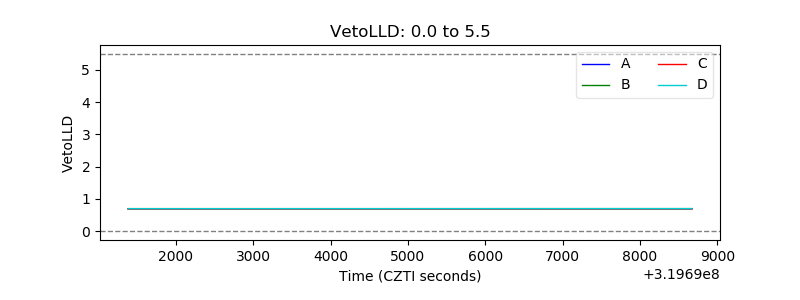 |
| Alpha Counter | 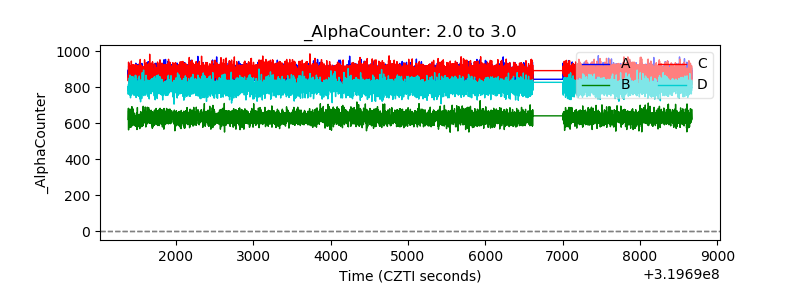 |
| _CPM_Rate | 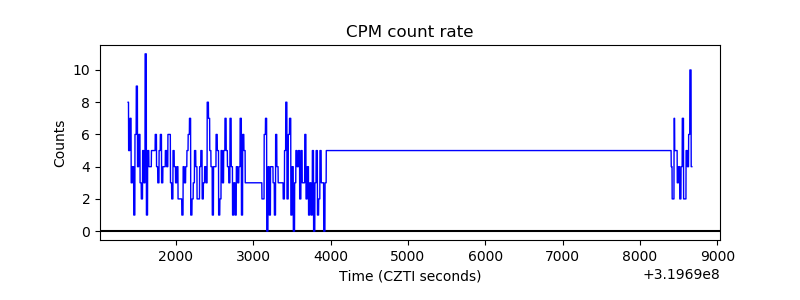 |
| CZT Counter | 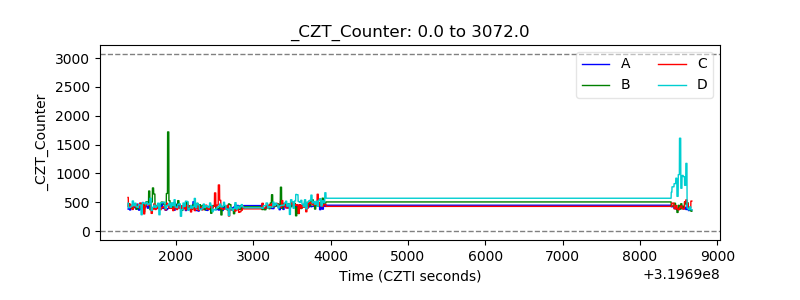 |
| +2.5 Volts monitor |  |
| +5 Volts monitor |  |
| _ROLL_ROT | 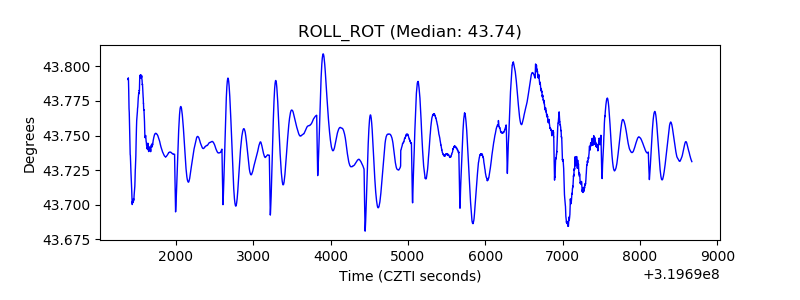 |
| _Roll_DEC | 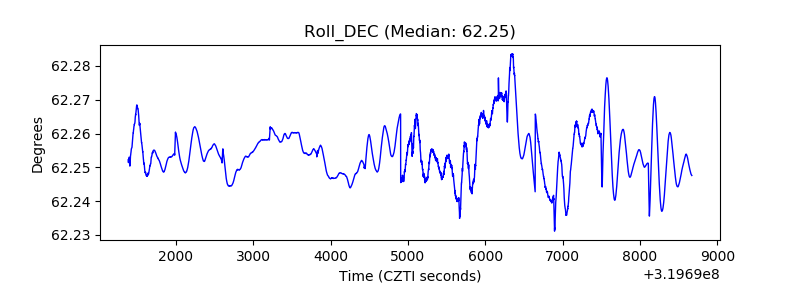 |
| _Roll_RA | 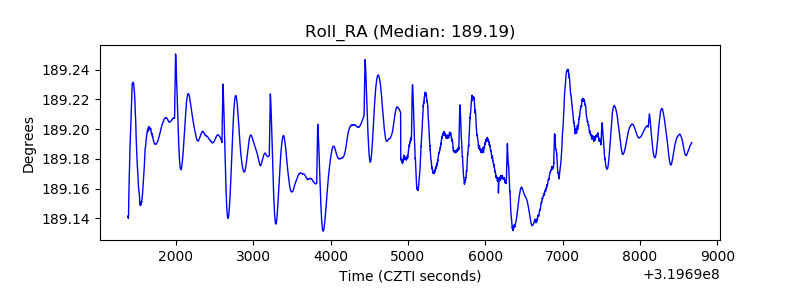 |
| Veto Counter | 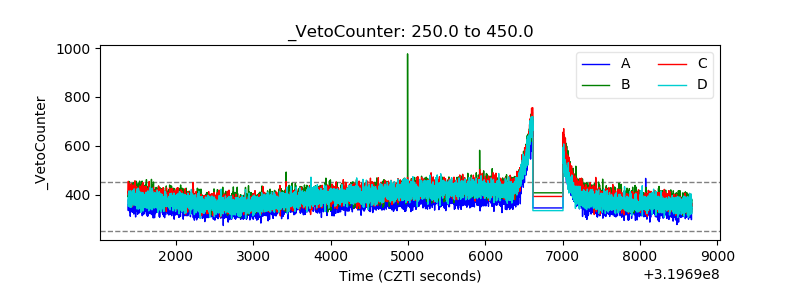 |