| Param | Original file | Final file |
|---|---|---|
| Filename | modeM0/AS1A08_009T01_9000003516_23743cztM0_level2.evt | modeM0/AS1A08_009T01_9000003516_23743cztM0_level2_quad_clean.evt |
| Size (bytes) | 559,013,760 | 104,981,760 |
| Size | 533.1 MB | 100.1 MB |
| Events in quadrant A | 3,231,349 | 677,961 |
| Events in quadrant B | 3,494,957 | 692,957 |
| Events in quadrant C | 3,500,502 | 668,716 |
| Events in quadrant D | 6,216,426 | 639,789 |
| Mode M9 | |||
|---|---|---|---|
| Quadrant | BADHDUFLAG | Total packets | Discarded packets |
| A | 0 | 2 | 0 |
| B | 0 | 2 | 0 |
| C | 0 | 2 | 0 |
| D | 0 | 2 | 0 |
| Mode SS | |||
|---|---|---|---|
| Quadrant | BADHDUFLAG | Total packets | Discarded packets |
| A | 0 | 148 | 0 |
| B | 0 | 148 | 0 |
| C | 0 | 148 | 0 |
| D | 0 | 148 | 0 |
| Mode M0 | |||
|---|---|---|---|
| Quadrant | BADHDUFLAG | Total packets | Discarded packets |
| A | 0 | 14609 | 1 |
| B | 0 | 15013 | 1 |
| C | 0 | 15051 | 1 |
| D | 0 | 23694 | 1 |
| Quadrant | Total seconds | Saturated seconds | Saturation percentage |
|---|---|---|---|
| A | 7176 | 92 | 1.282051% |
| B | 7177 | 164 | 2.285077% |
| C | 7176 | 116 | 1.616499% |
| D | 7176 | 167 | 2.327202% |
Noise dominated data is calculated using 1-second bins in cleaned event files. If a bin has >2000 counts, and if more than 50% of those come from <1% of pixels, then it is considered to be noise-dominated and hence unusable.
| Quadrant | # 1 sec bins | Bins with >0 counts | Bins with >2000 counts | High rate bins dominated by noise | Noise dominated (total time) | Noise dominated (detector-on time) | Marked lightcurve |
|---|---|---|---|---|---|---|---|
| A | 7321 | 7178 | 0 | 0 | 0.00% | 0.00% | 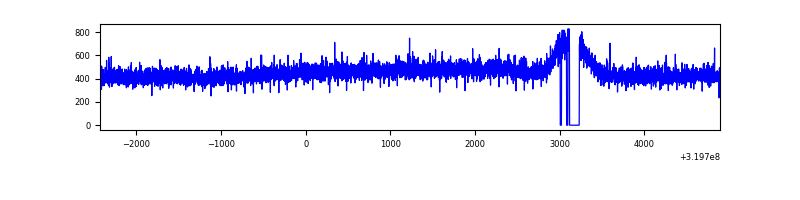 |
| B | 7322 | 7180 | 24 | 24 | 0.33% | 0.33% | 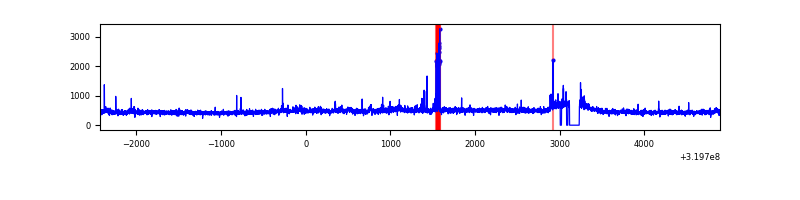 |
| C | 7321 | 7179 | 0 | 0 | 0.00% | 0.00% | 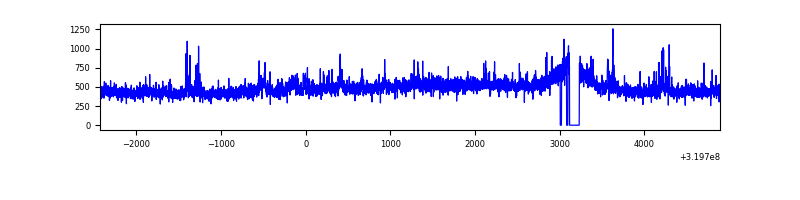 |
| D | 7321 | 7178 | 50 | 50 | 0.68% | 0.70% | 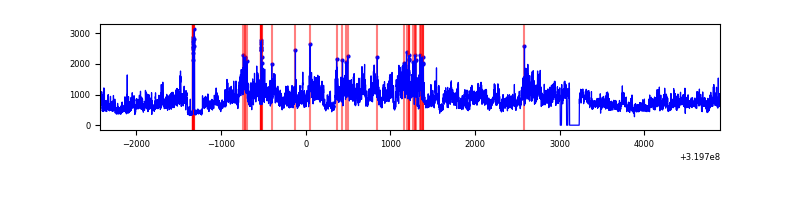 |
Top three noisy pixels from each quadrant. If the there are fewer than three noisy pixels in the level2.evt file, extra rows are filled as -1
| Pixel properties | Quadrant properties | ||||||
|---|---|---|---|---|---|---|---|
| Quadrant | DetID | PixID | Counts | Sigma | Mean | Median | Sigma |
| A | 13 | 254 | 12414 | 68.35 | 837 | 818 | 169.7 |
| A | 3 | 137 | 7733 | 40.76 | 837 | 818 | 169.7 |
| A | 0 | 226 | 7174 | 37.46 | 837 | 818 | 169.7 |
| B | 0 | 229 | 87300 | 539.14 | 837 | 813 | 160.4 |
| B | 6 | 36 | 56130 | 344.84 | 837 | 813 | 160.4 |
| B | 12 | 111 | 19921 | 119.12 | 837 | 813 | 160.4 |
| C | 7 | 247 | 159296 | 837.93 | 805 | 809 | 189.1 |
| C | 14 | 238 | 127379 | 669.18 | 805 | 809 | 189.1 |
| C | 10 | 9 | 67376 | 351.94 | 805 | 809 | 189.1 |
| D | 8 | 195 | 2978615 | 15030.21 | 806 | 779 | 198.1 |
| D | 1 | 52 | 108191 | 542.15 | 806 | 779 | 198.1 |
| D | 2 | 120 | 39332 | 194.59 | 806 | 779 | 198.1 |
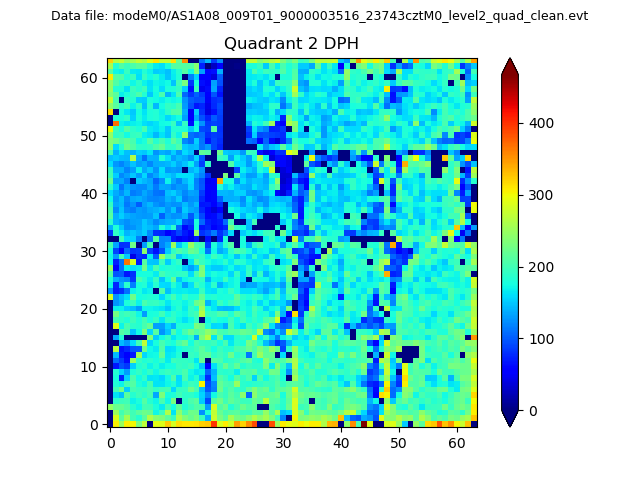
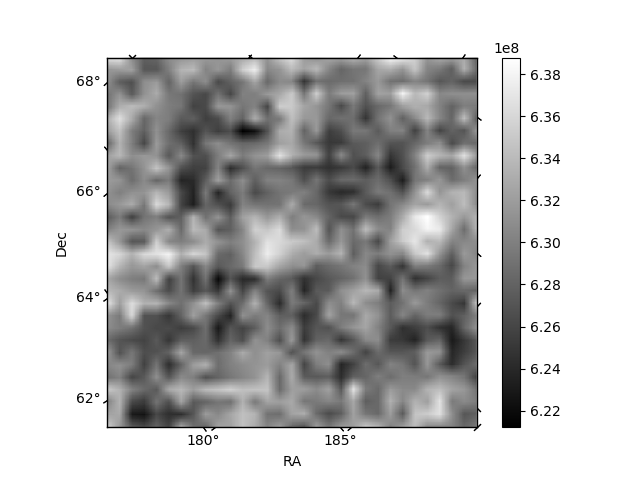
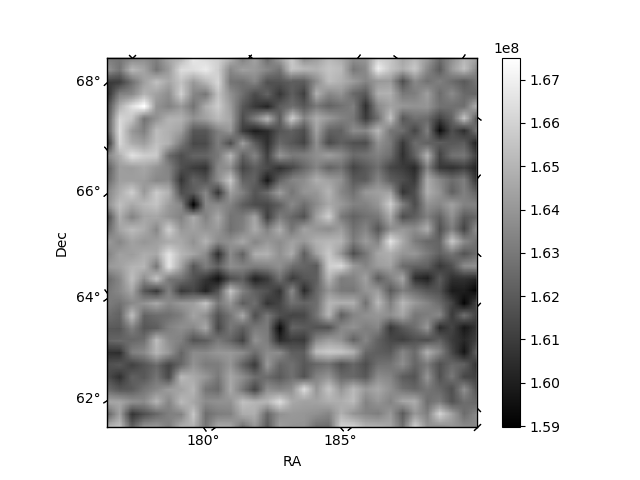
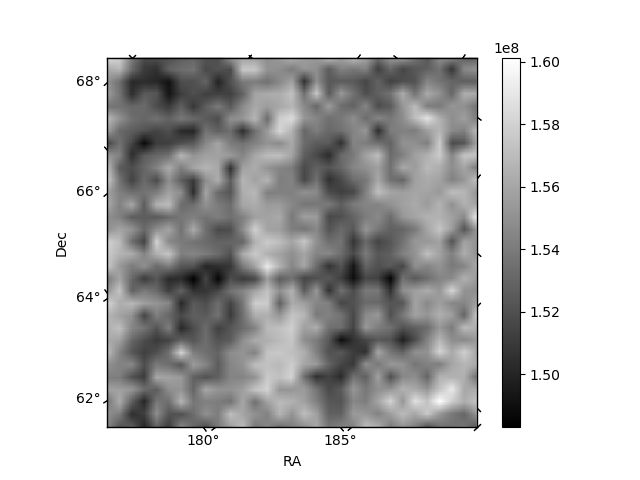
Histogram calculated using DETX and DETY for each event in the final _common_clean file
| Quadrant A | 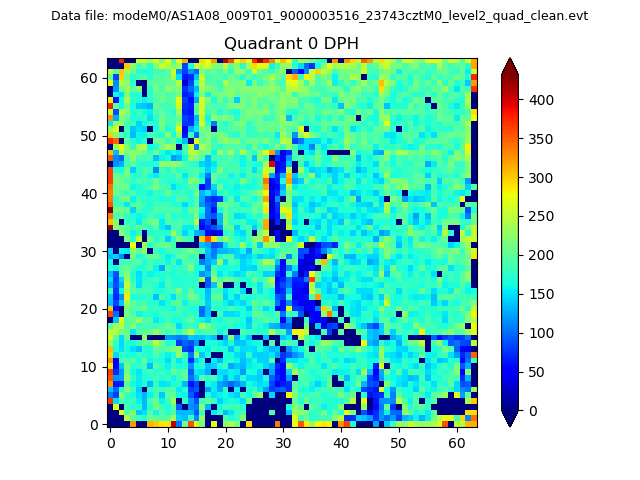 |
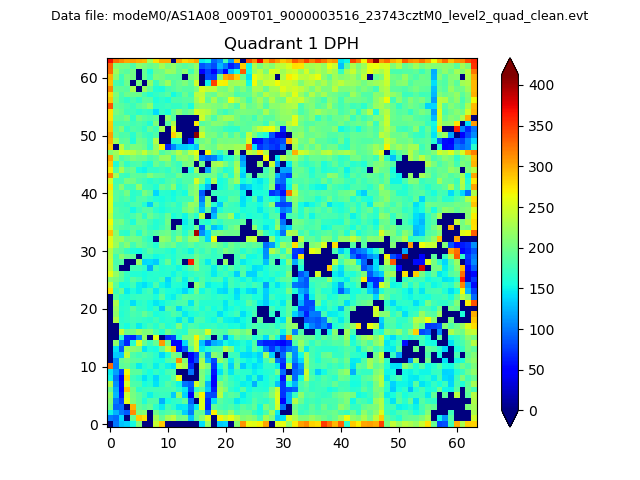 |
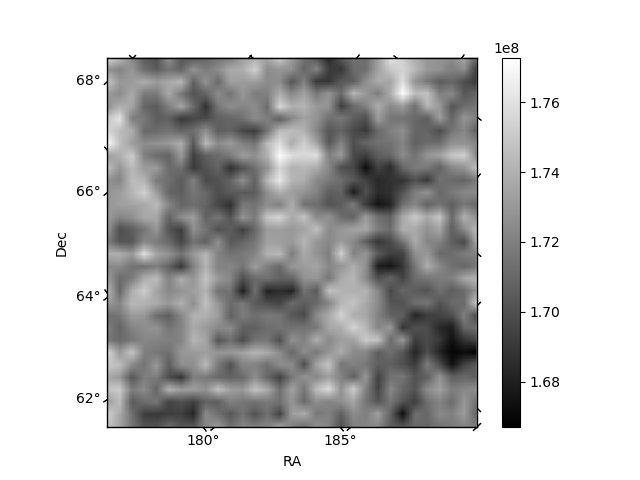
Quadrant B |
|---|---|---|---|
| Quadrant D | 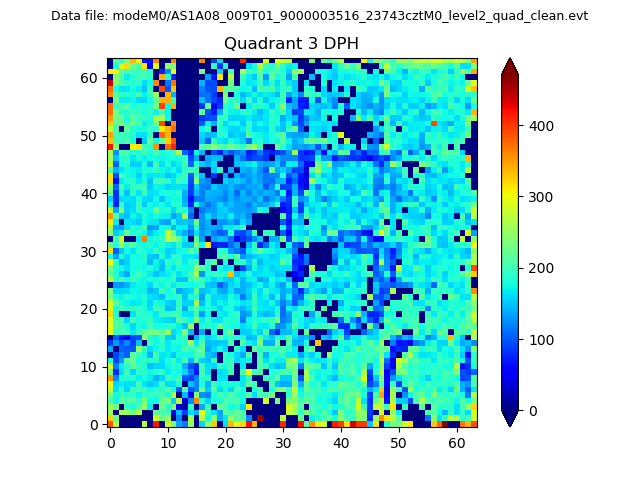 |
 |
Quadrant C |
| Plot type | Count rate plots | Images |
|---|---|---|
| Comparison with Poisson distribution Blue bars denote a histogram of data divided into 1 sec bins. Red curve is a Poisson curve with rate = median count rate of data. |
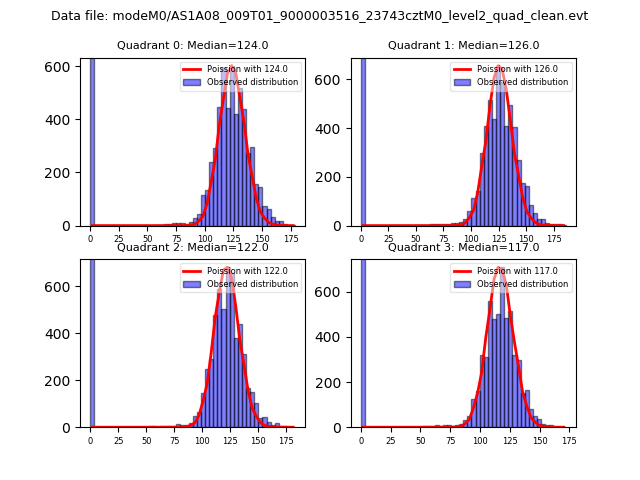 |
 |
| Quadrant-wise count rates Data is divided into 100 sec bins |
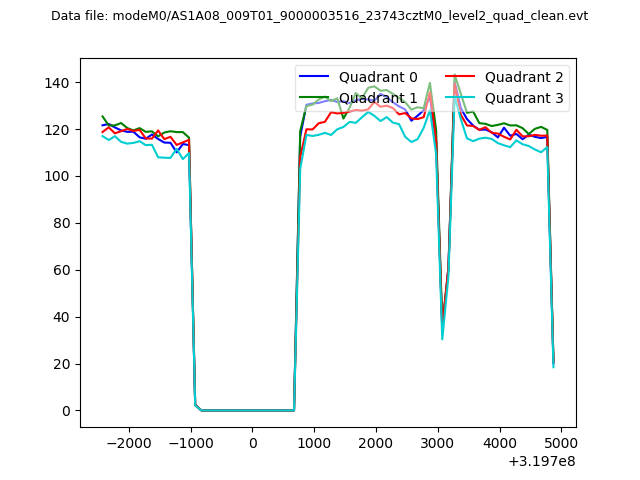 |
|
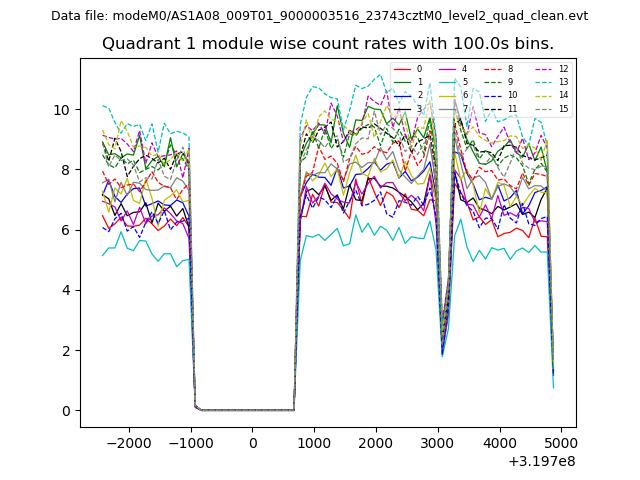
| Module-wise count rates for Quadrant A Data is divided into 100 sec bins |
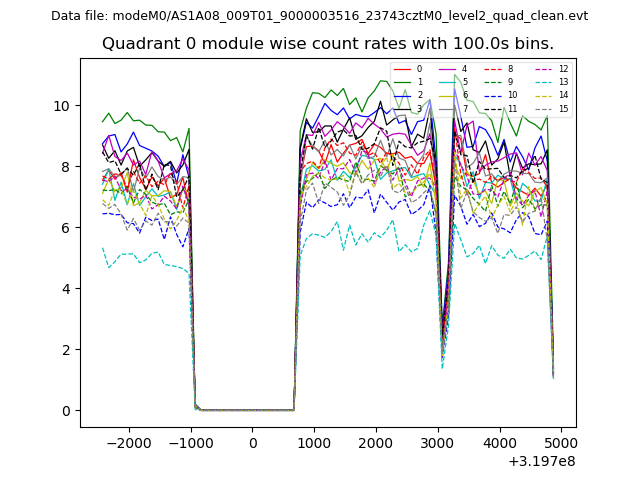 |
 |
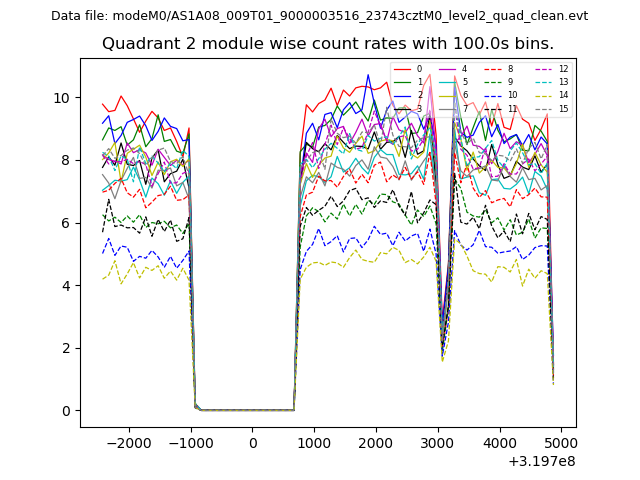
| Module-wise count rates for Quadrant B Data is divided into 100 sec bins |
 |
 |
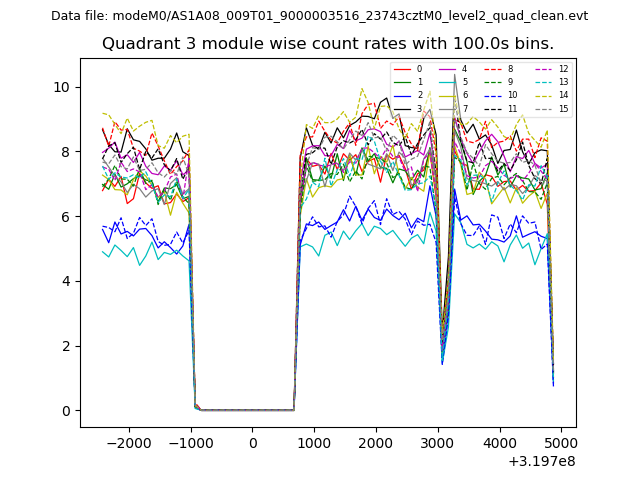
| Module-wise count rates for Quadrant C Data is divided into 100 sec bins |
 |
 |
| Module-wise count rates for Quadrant D Data is divided into 100 sec bins |
 |
 |
| Parameter | Plot |
|---|---|
| CZT HV Monitor | 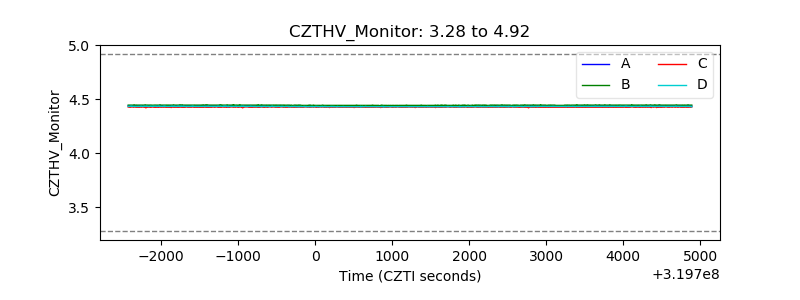 |
| D_VDD | 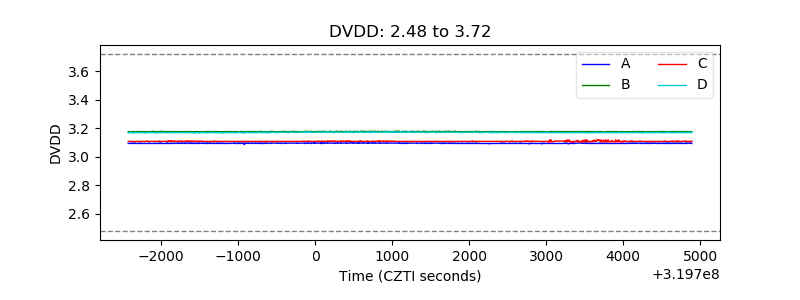 |
| Temperature 1 |  |
| Veto HV Monitor | 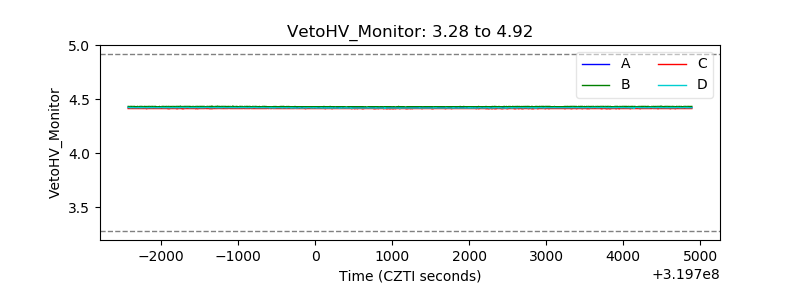 |
| Veto LLD | 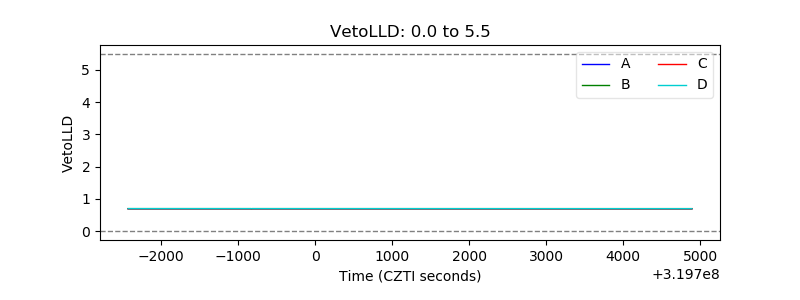 |
| Alpha Counter | 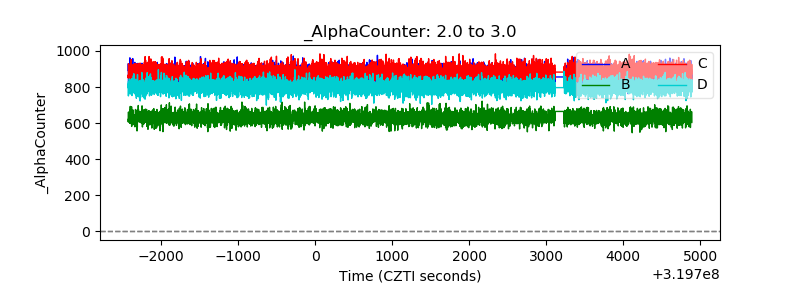 |
| _CPM_Rate | 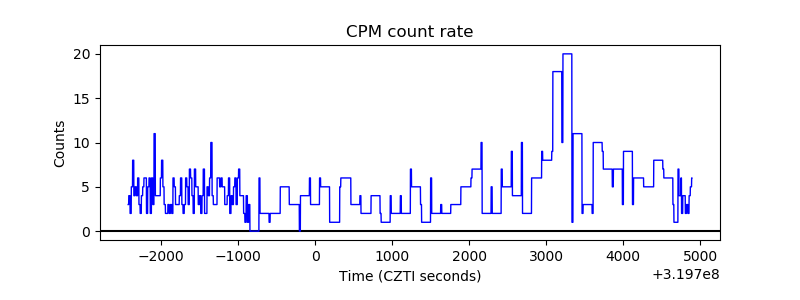 |
| CZT Counter | 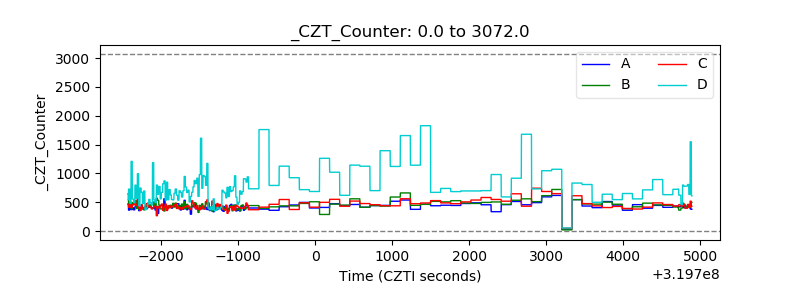 |
| +2.5 Volts monitor | 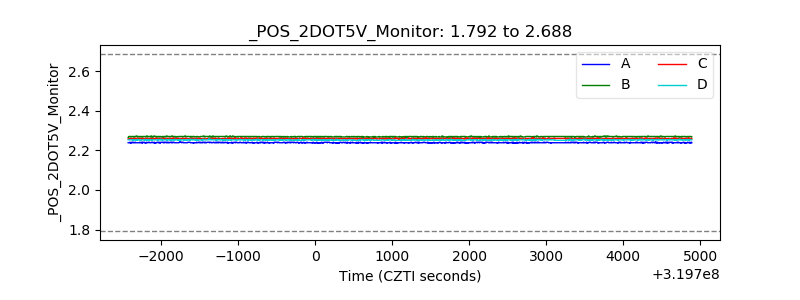 |
| +5 Volts monitor |  |
| _ROLL_ROT | 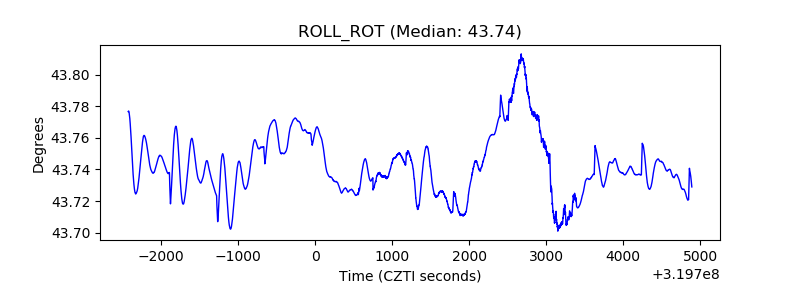 |
| _Roll_DEC |  |
| _Roll_RA | 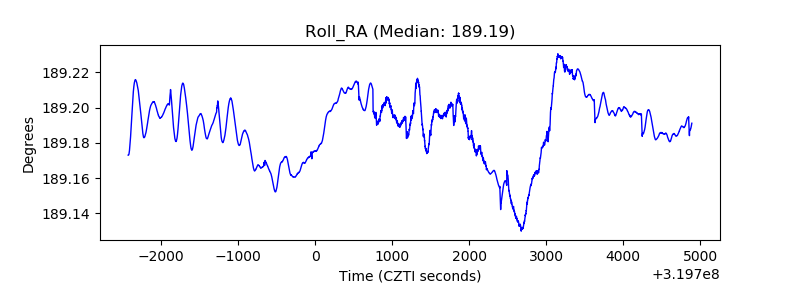 |
| Veto Counter | 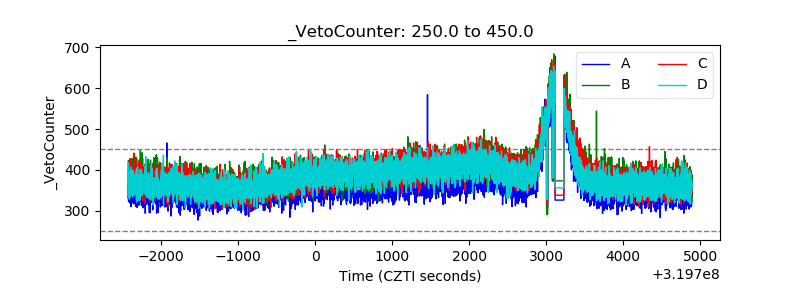 |