| Param | Original file | Final file |
|---|---|---|
| Filename | modeM0/AS1A08_009T01_9000003516_23744cztM0_level2.evt | modeM0/AS1A08_009T01_9000003516_23744cztM0_level2_quad_clean.evt |
| Size (bytes) | 508,037,760 | 103,844,160 |
| Size | 484.5 MB | 99.0 MB |
| Events in quadrant A | 3,353,842 | 662,985 |
| Events in quadrant B | 3,534,353 | 679,867 |
| Events in quadrant C | 3,618,797 | 650,599 |
| Events in quadrant D | 4,373,670 | 633,732 |
| Mode M9 | |||
|---|---|---|---|
| Quadrant | BADHDUFLAG | Total packets | Discarded packets |
| A | 0 | 3 | 0 |
| B | 0 | 3 | 0 |
| C | 0 | 3 | 0 |
| D | 0 | 3 | 0 |
| Mode SS | |||
|---|---|---|---|
| Quadrant | BADHDUFLAG | Total packets | Discarded packets |
| A | 0 | 150 | 0 |
| B | 0 | 150 | 0 |
| C | 0 | 150 | 0 |
| D | 0 | 150 | 0 |
| Mode M0 | |||
|---|---|---|---|
| Quadrant | BADHDUFLAG | Total packets | Discarded packets |
| A | 0 | 15076 | 2 |
| B | 0 | 15236 | 1 |
| C | 0 | 15632 | 1 |
| D | 0 | 17791 | 1 |
| Quadrant | Total seconds | Saturated seconds | Saturation percentage |
|---|---|---|---|
| A | 7443 | 100 | 1.343544% |
| B | 7443 | 113 | 1.518205% |
| C | 7443 | 118 | 1.585382% |
| D | 7443 | 57 | 0.765820% |
Noise dominated data is calculated using 1-second bins in cleaned event files. If a bin has >2000 counts, and if more than 50% of those come from <1% of pixels, then it is considered to be noise-dominated and hence unusable.
| Quadrant | # 1 sec bins | Bins with >0 counts | Bins with >2000 counts | High rate bins dominated by noise | Noise dominated (total time) | Noise dominated (detector-on time) | Marked lightcurve |
|---|---|---|---|---|---|---|---|
| A | 7743 | 7443 | 0 | 0 | 0.00% | 0.00% | 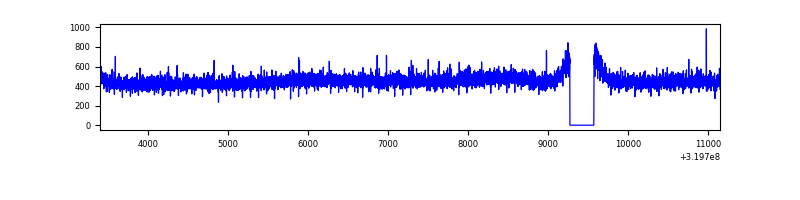 |
| B | 7743 | 7443 | 0 | 0 | 0.00% | 0.00% | 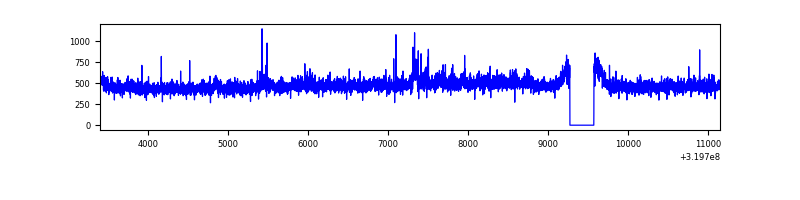 |
| C | 7743 | 7444 | 5 | 5 | 0.06% | 0.07% | 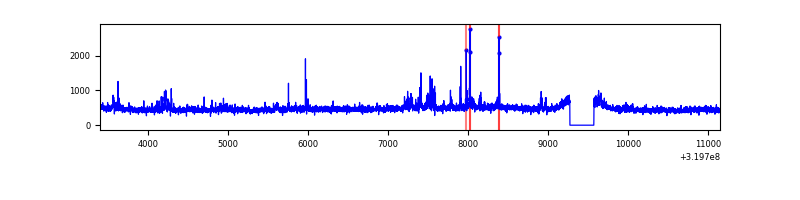 |
| D | 7743 | 7443 | 2 | 2 | 0.03% | 0.03% | 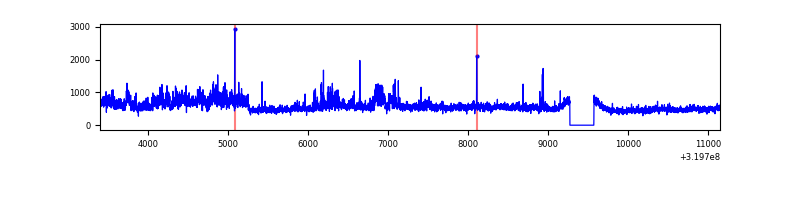 |
Top three noisy pixels from each quadrant. If the there are fewer than three noisy pixels in the level2.evt file, extra rows are filled as -1
| Pixel properties | Quadrant properties | ||||||
|---|---|---|---|---|---|---|---|
| Quadrant | DetID | PixID | Counts | Sigma | Mean | Median | Sigma |
| A | 13 | 254 | 12751 | 67.87 | 869 | 850 | 175.3 |
| A | 3 | 137 | 8056 | 41.1 | 869 | 850 | 175.3 |
| A | 0 | 226 | 7526 | 38.07 | 869 | 850 | 175.3 |
| B | 0 | 229 | 81939 | 489.24 | 868 | 844 | 165.8 |
| B | 0 | 189 | 32083 | 188.46 | 868 | 844 | 165.8 |
| B | 12 | 111 | 20809 | 120.45 | 868 | 844 | 165.8 |
| C | 7 | 247 | 213711 | 1095.06 | 832 | 835 | 194.4 |
| C | 14 | 238 | 131322 | 671.24 | 832 | 835 | 194.4 |
| C | 10 | 9 | 18936 | 93.11 | 832 | 835 | 194.4 |
| D | 8 | 195 | 975967 | 4751.64 | 841 | 816 | 205.2 |
| D | 1 | 52 | 166746 | 808.53 | 841 | 816 | 205.2 |
| D | 2 | 234 | 30409 | 144.2 | 841 | 816 | 205.2 |
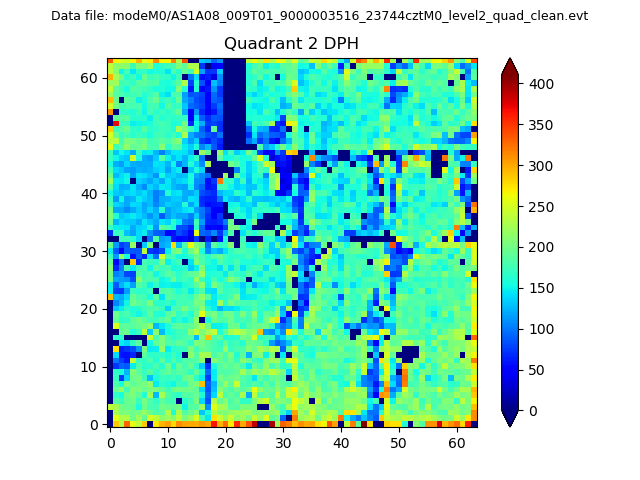
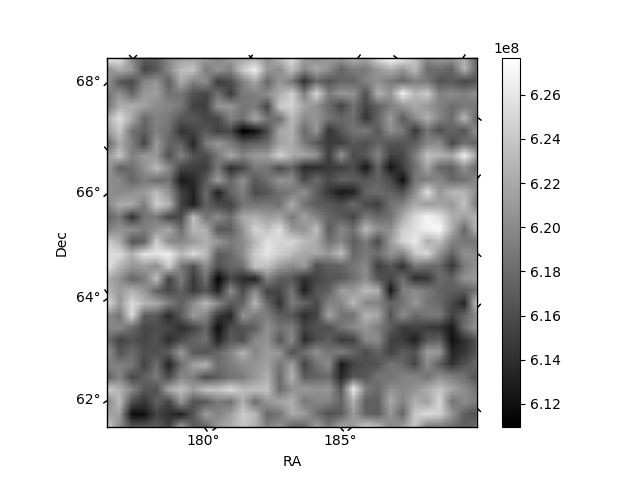
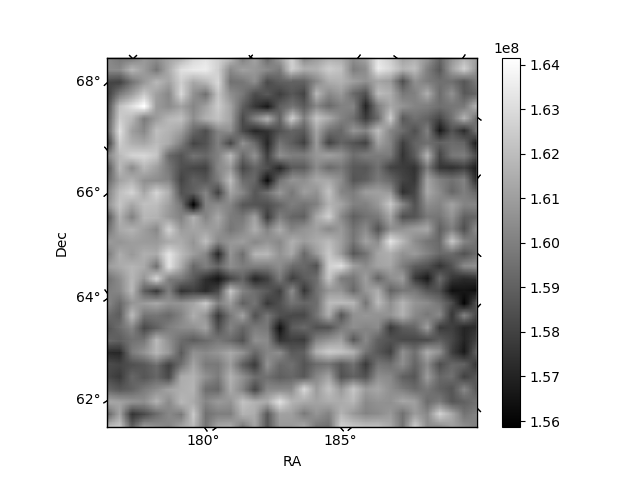
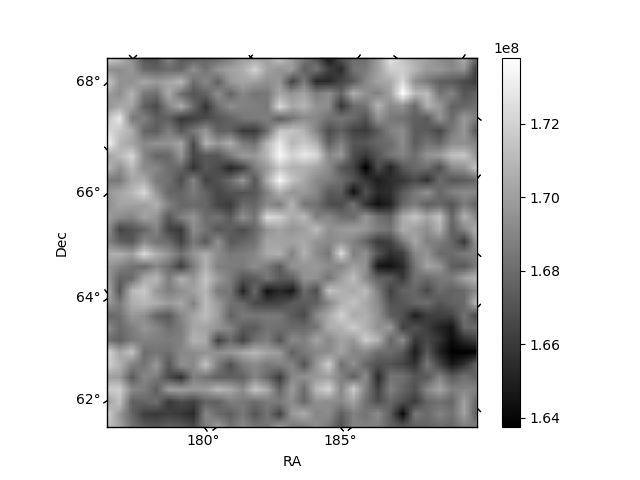
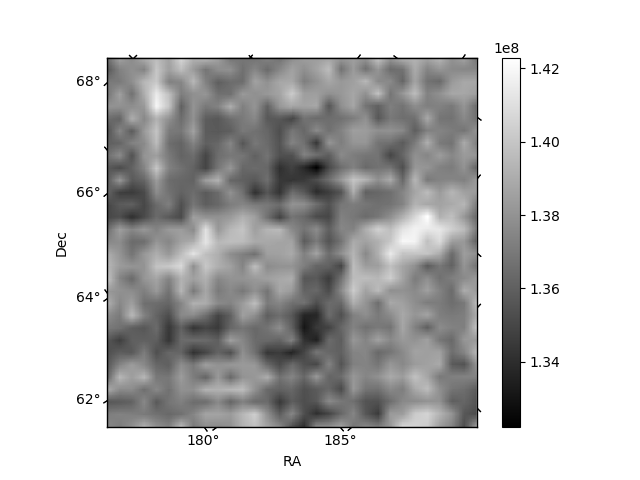
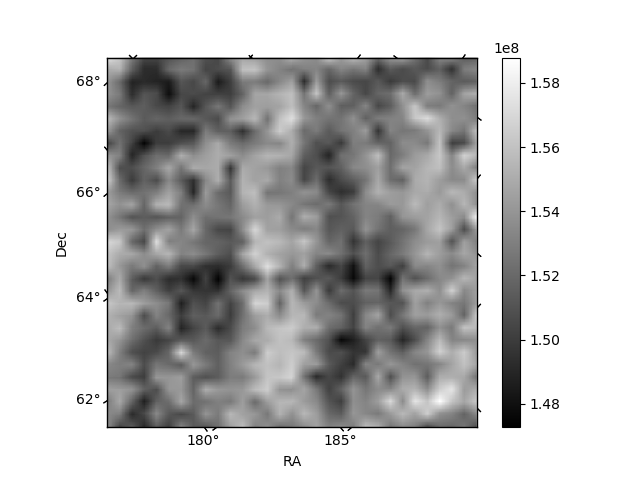
Histogram calculated using DETX and DETY for each event in the final _common_clean file
| Quadrant A | 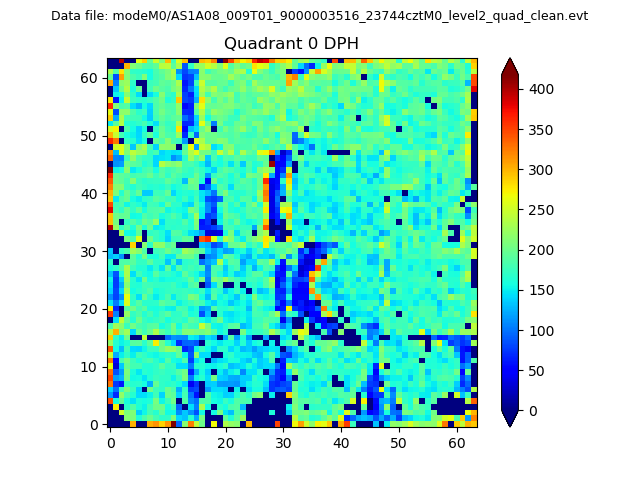 |
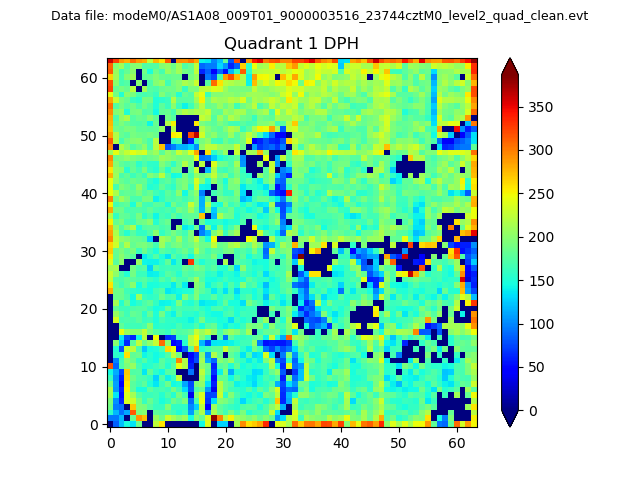 |
Quadrant B |
|---|---|---|---|
| Quadrant D | 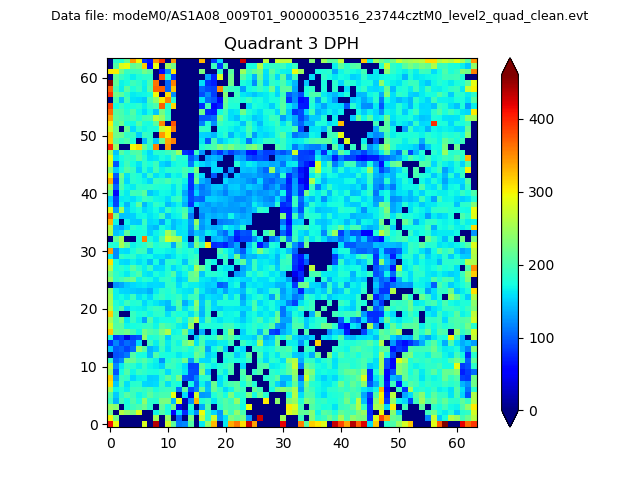 |
 |
Quadrant C |
| Plot type | Count rate plots | Images |
|---|---|---|
| Comparison with Poisson distribution Blue bars denote a histogram of data divided into 1 sec bins. Red curve is a Poisson curve with rate = median count rate of data. |
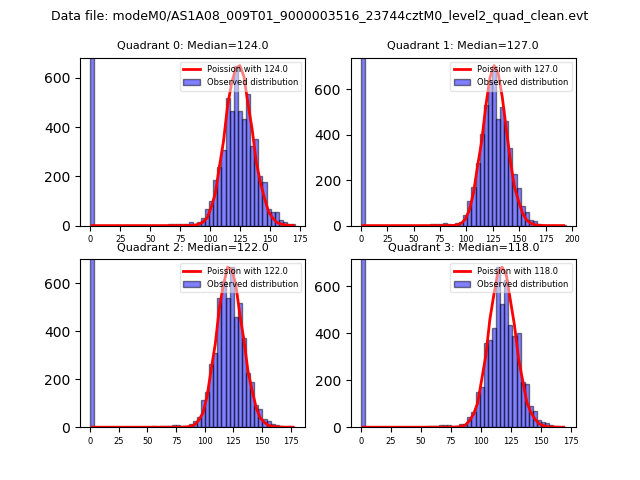 |
 |
| Quadrant-wise count rates Data is divided into 100 sec bins |
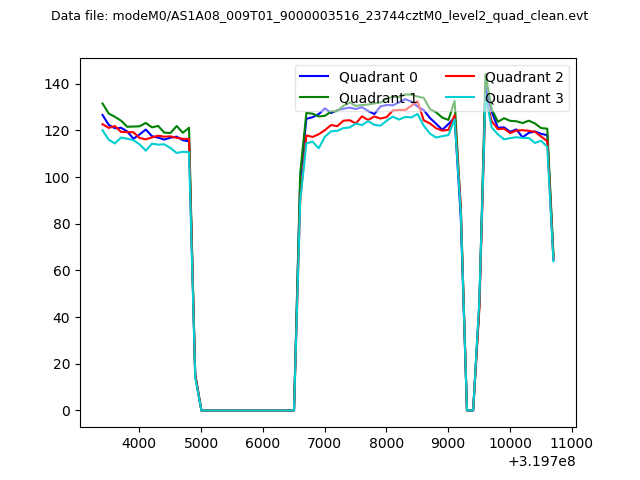 |
|
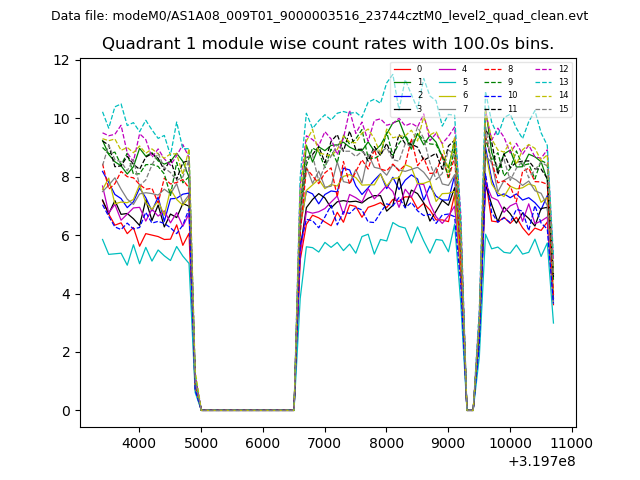
| Module-wise count rates for Quadrant A Data is divided into 100 sec bins |
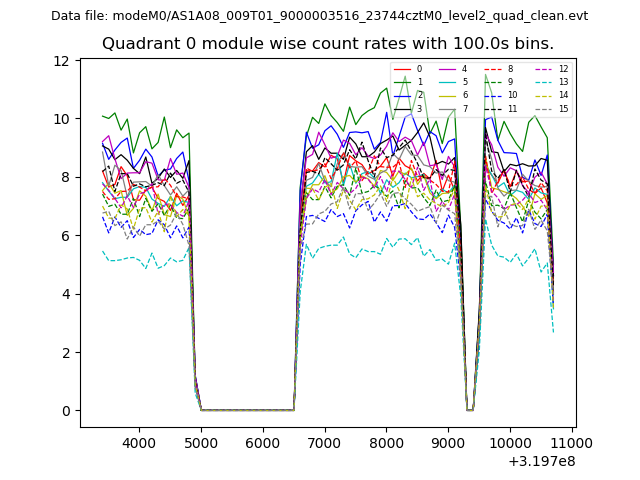 |
 |
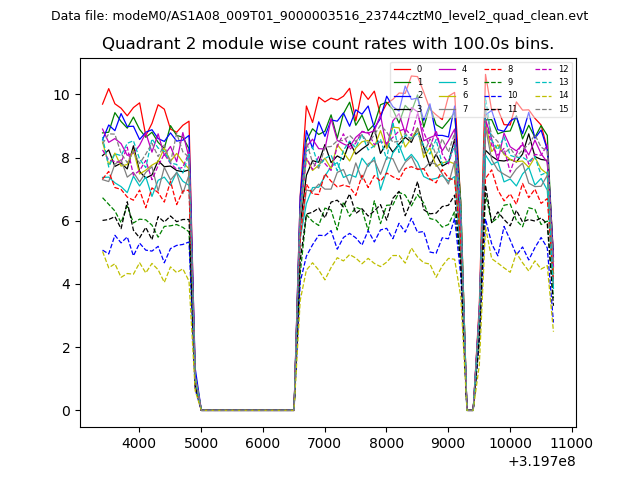
| Module-wise count rates for Quadrant B Data is divided into 100 sec bins |
 |
 |
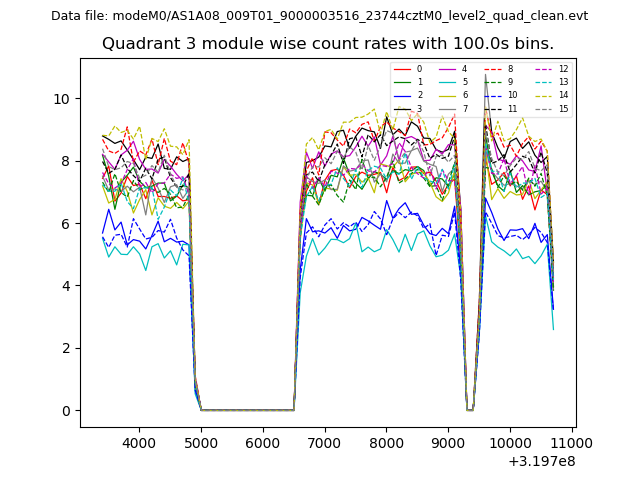
| Module-wise count rates for Quadrant C Data is divided into 100 sec bins |
 |
 |
| Module-wise count rates for Quadrant D Data is divided into 100 sec bins |
 |
 |
| Parameter | Plot |
|---|---|
| CZT HV Monitor | 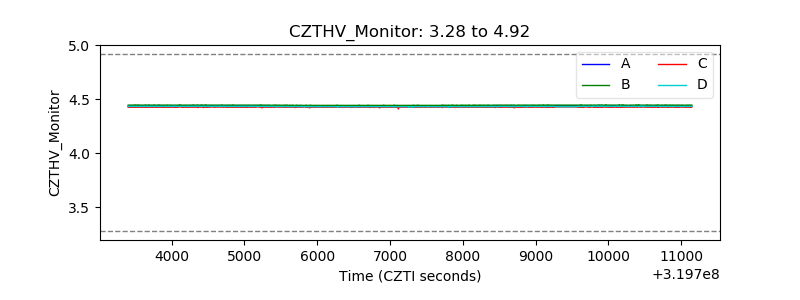 |
| D_VDD | 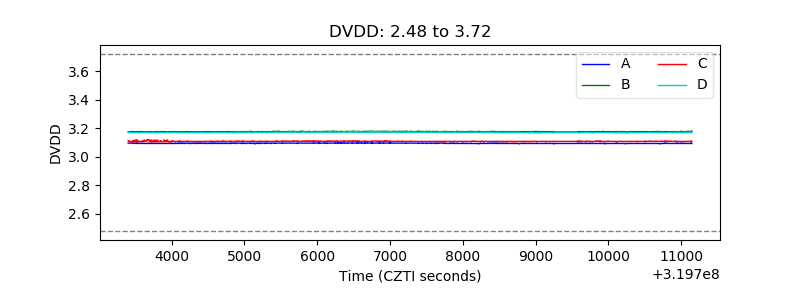 |
| Temperature 1 | 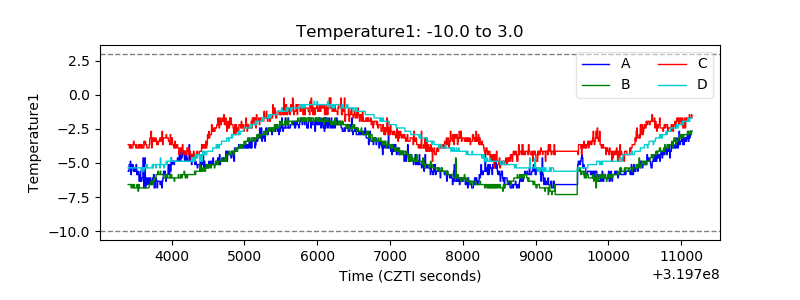 |
| Veto HV Monitor | 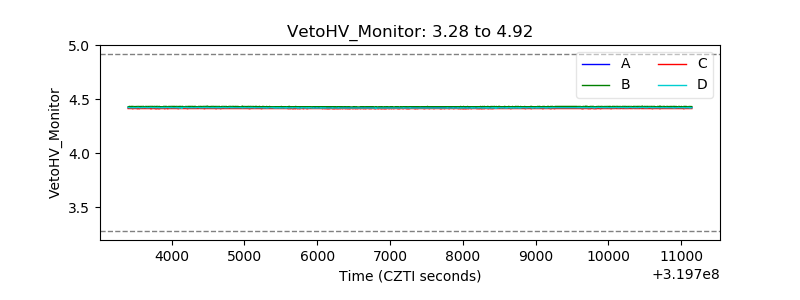 |
| Veto LLD | 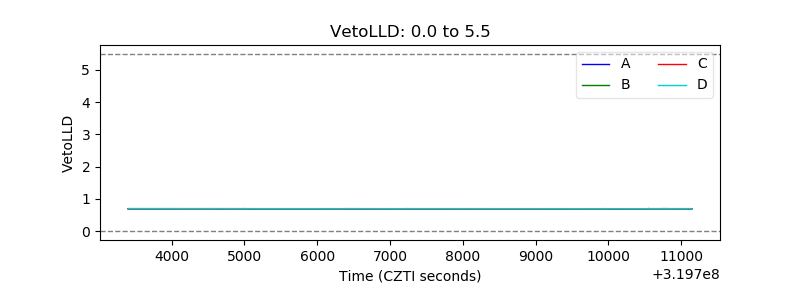 |
| Alpha Counter | 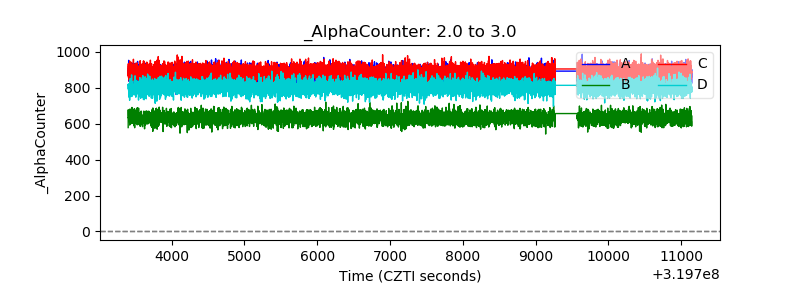 |
| _CPM_Rate | 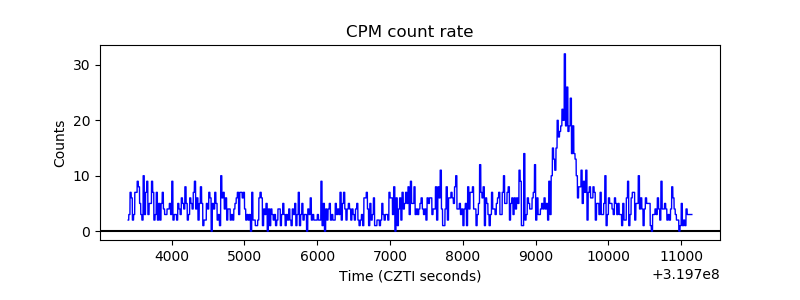 |
| CZT Counter | 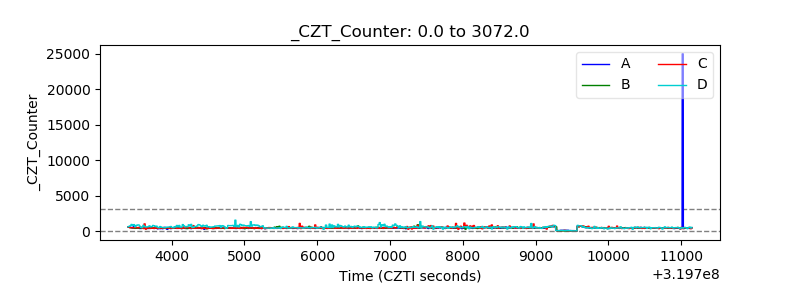 |
| +2.5 Volts monitor |  |
| +5 Volts monitor |  |
| _ROLL_ROT | 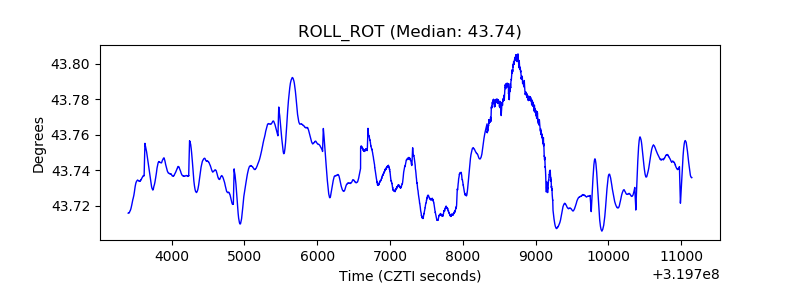 |
| _Roll_DEC |  |
| _Roll_RA | 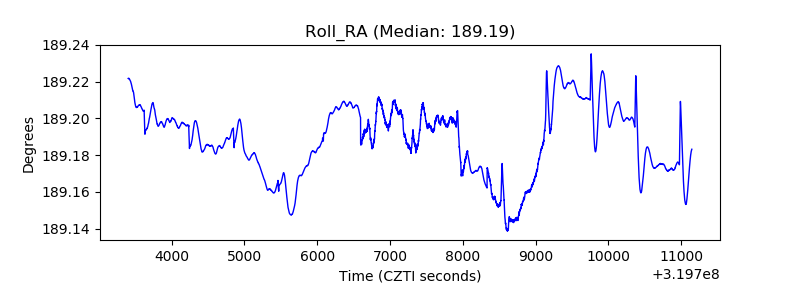 |
| Veto Counter | 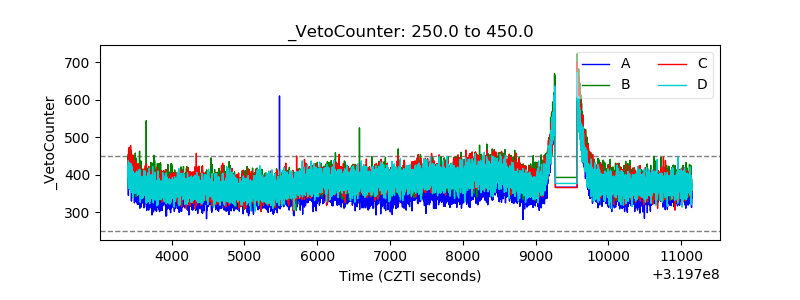 |