| Param | Original file | Final file |
|---|---|---|
| Filename | modeM0/AS1A08_009T01_9000003516_23746cztM0_level2.evt | modeM0/AS1A08_009T01_9000003516_23746cztM0_level2_quad_clean.evt |
| Size (bytes) | 60,194,880 | 17,208,000 |
| Size | 57.4 MB | 16.4 MB |
| Events in quadrant A | 429,171 | 112,185 |
| Events in quadrant B | 443,046 | 115,789 |
| Events in quadrant C | 443,629 | 111,355 |
| Events in quadrant D | 441,266 | 109,816 |
| Mode SS | |||
|---|---|---|---|
| Quadrant | BADHDUFLAG | Total packets | Discarded packets |
| A | 0 | 20 | 0 |
| B | 0 | 20 | 0 |
| C | 0 | 20 | 0 |
| D | 0 | 20 | 0 |
| Mode M0 | |||
|---|---|---|---|
| Quadrant | BADHDUFLAG | Total packets | Discarded packets |
| A | 0 | 1914 | 2 |
| B | 0 | 1926 | 1 |
| C | 0 | 1941 | 1 |
| D | 0 | 1927 | 1 |
| Quadrant | Total seconds | Saturated seconds | Saturation percentage |
|---|---|---|---|
| A | 912 | 49 | 5.372807% |
| B | 913 | 53 | 5.805038% |
| C | 913 | 53 | 5.805038% |
| D | 913 | 19 | 2.081051% |
Noise dominated data is calculated using 1-second bins in cleaned event files. If a bin has >2000 counts, and if more than 50% of those come from <1% of pixels, then it is considered to be noise-dominated and hence unusable.
| Quadrant | # 1 sec bins | Bins with >0 counts | Bins with >2000 counts | High rate bins dominated by noise | Noise dominated (total time) | Noise dominated (detector-on time) | Marked lightcurve |
|---|---|---|---|---|---|---|---|
| A | 912 | 912 | 0 | 0 | 0.00% | 0.00% | 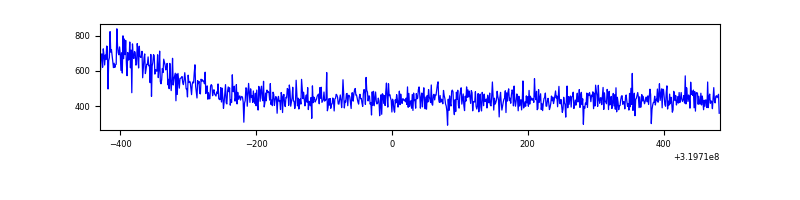 |
| B | 913 | 913 | 0 | 0 | 0.00% | 0.00% | 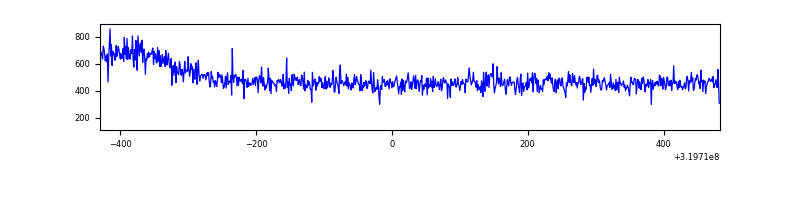 |
| C | 913 | 913 | 0 | 0 | 0.00% | 0.00% | 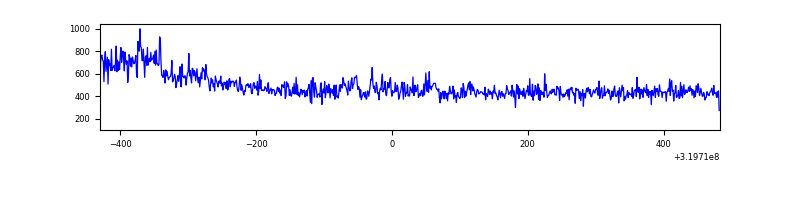 |
| D | 913 | 913 | 0 | 0 | 0.00% | 0.00% | 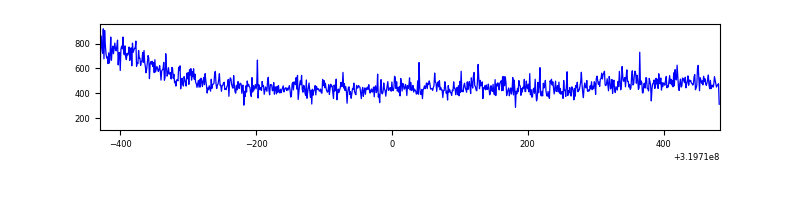 |
Top three noisy pixels from each quadrant. If the there are fewer than three noisy pixels in the level2.evt file, extra rows are filled as -1
| Pixel properties | Quadrant properties | ||||||
|---|---|---|---|---|---|---|---|
| Quadrant | DetID | PixID | Counts | Sigma | Mean | Median | Sigma |
| A | 13 | 254 | 1496 | 56.37 | 111 | 108 | 24.6 |
| A | 3 | 137 | 1057 | 38.54 | 111 | 108 | 24.6 |
| A | 0 | 226 | 965 | 34.8 | 111 | 108 | 24.6 |
| B | 0 | 229 | 9106 | 382.56 | 110 | 107 | 23.5 |
| B | 12 | 111 | 2795 | 114.27 | 110 | 107 | 23.5 |
| B | 11 | 111 | 2376 | 96.46 | 110 | 107 | 23.5 |
| C | 14 | 238 | 16265 | 612.65 | 104 | 104 | 26.4 |
| C | 7 | 247 | 15776 | 594.11 | 104 | 104 | 26.4 |
| C | 10 | 91 | 3228 | 118.43 | 104 | 104 | 26.4 |
| D | 8 | 195 | 36542 | 1330.17 | 106 | 102 | 27.4 |
| D | 2 | 234 | 2800 | 98.49 | 106 | 102 | 27.4 |
| D | 13 | 174 | 2481 | 86.84 | 106 | 102 | 27.4 |
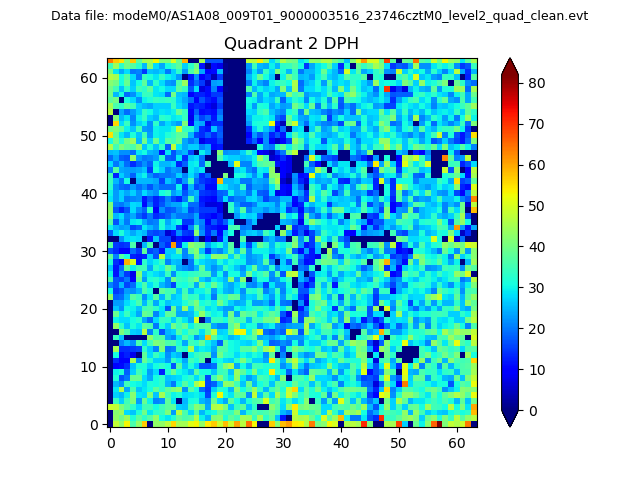
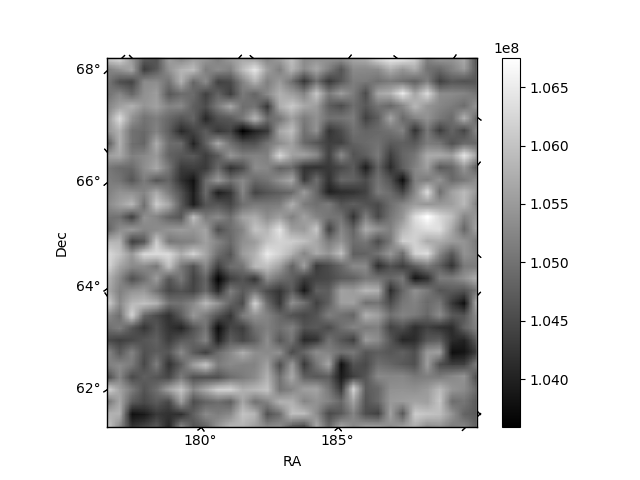
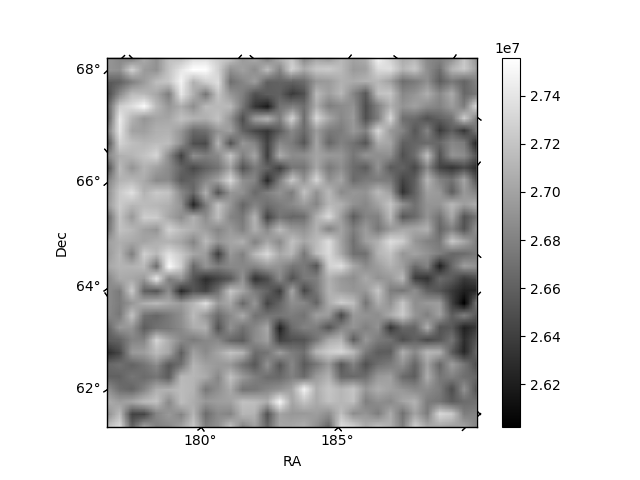
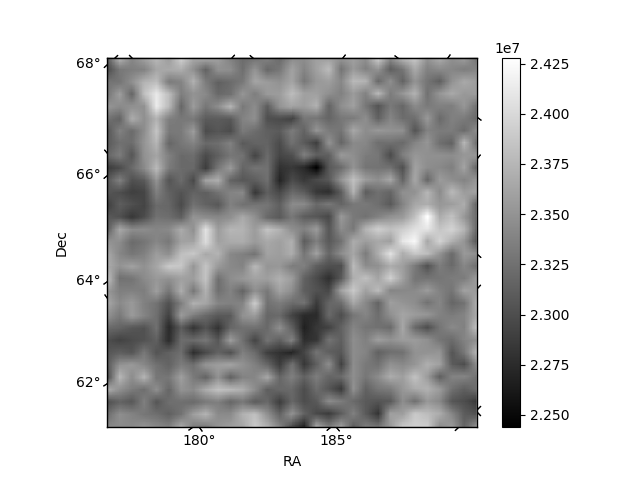
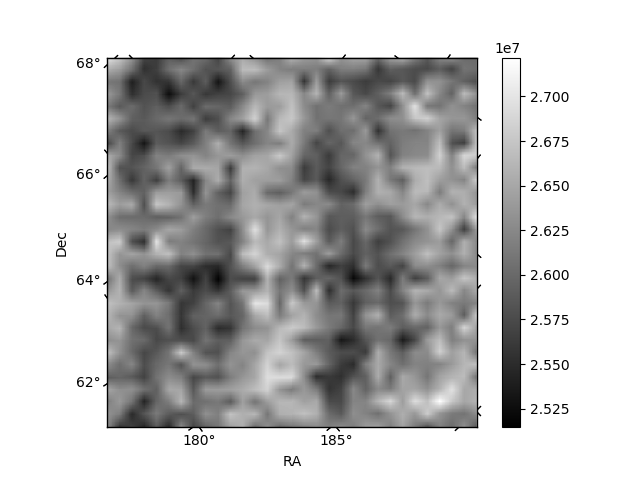
Histogram calculated using DETX and DETY for each event in the final _common_clean file
| Quadrant A | 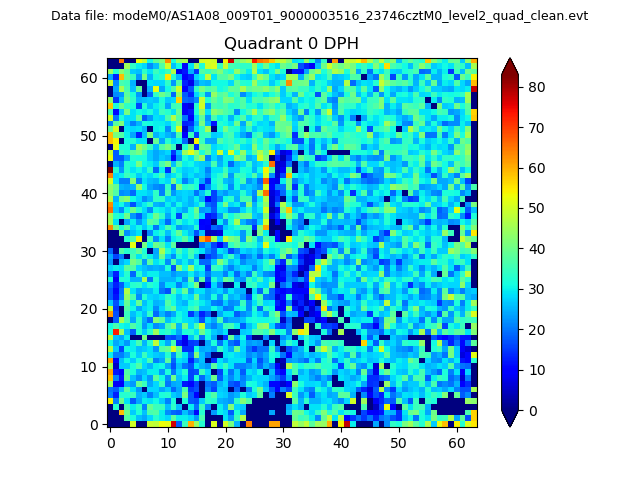 |
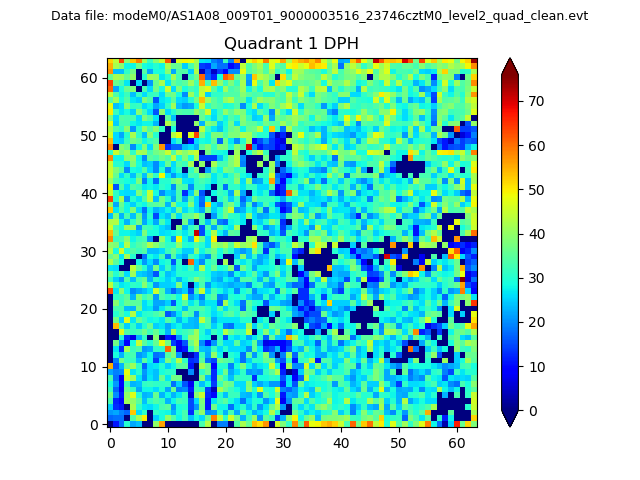 |
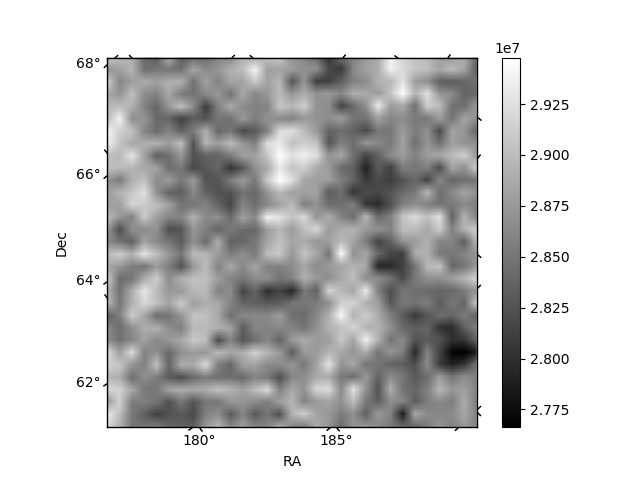
Quadrant B |
|---|---|---|---|
| Quadrant D | 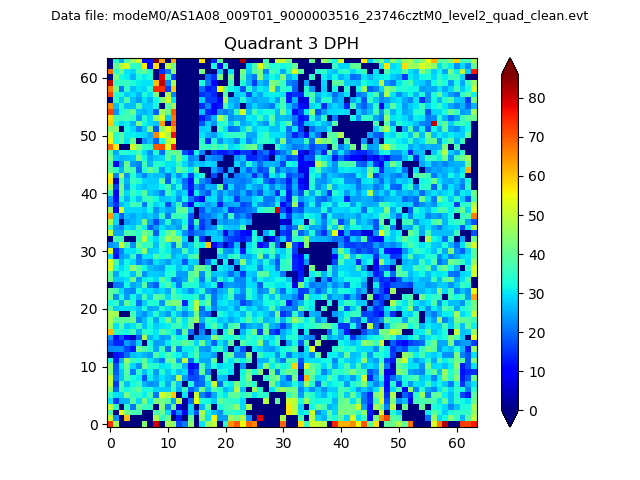 |
 |
Quadrant C |
| Plot type | Count rate plots | Images |
|---|---|---|
| Comparison with Poisson distribution Blue bars denote a histogram of data divided into 1 sec bins. Red curve is a Poisson curve with rate = median count rate of data. |
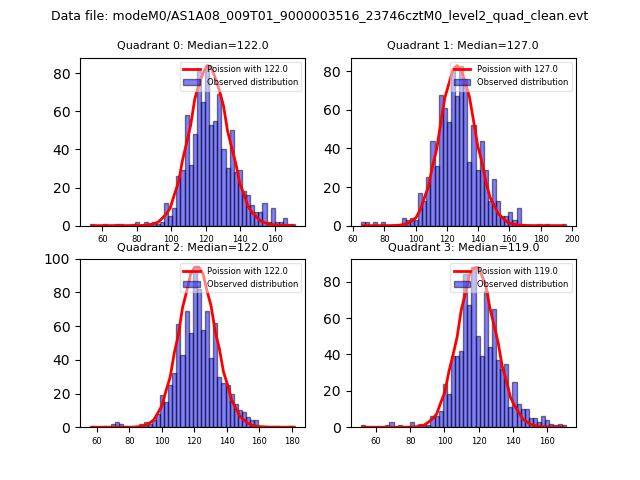 |
 |
| Quadrant-wise count rates Data is divided into 100 sec bins |
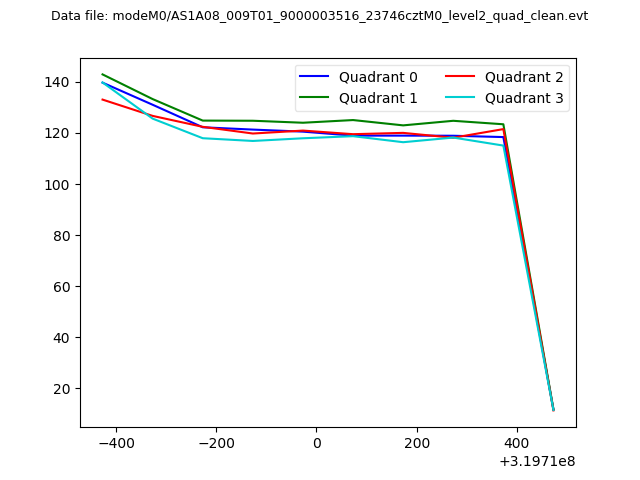 |
|
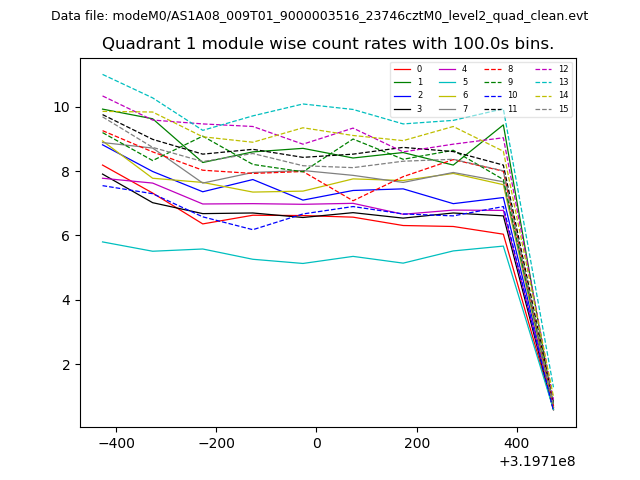
| Module-wise count rates for Quadrant A Data is divided into 100 sec bins |
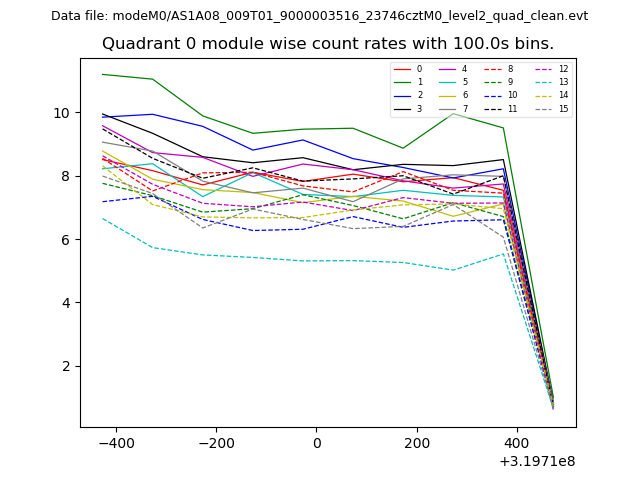 |
 |
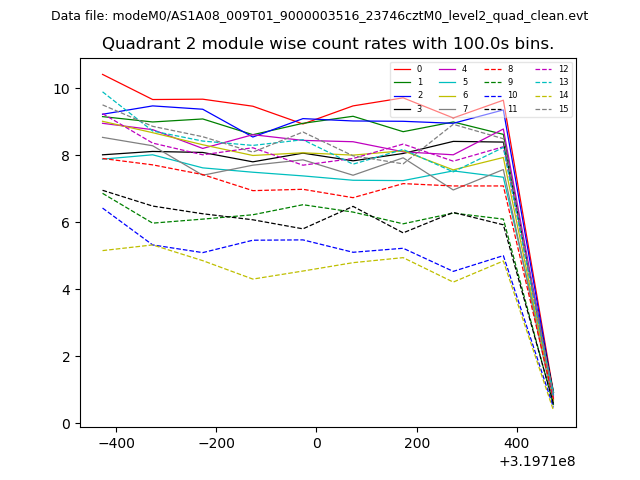
| Module-wise count rates for Quadrant B Data is divided into 100 sec bins |
 |
 |
| Module-wise count rates for Quadrant C Data is divided into 100 sec bins |
 |
 |
| Module-wise count rates for Quadrant D Data is divided into 100 sec bins |
 |
 |
| Parameter | Plot |
|---|---|
| CZT HV Monitor | 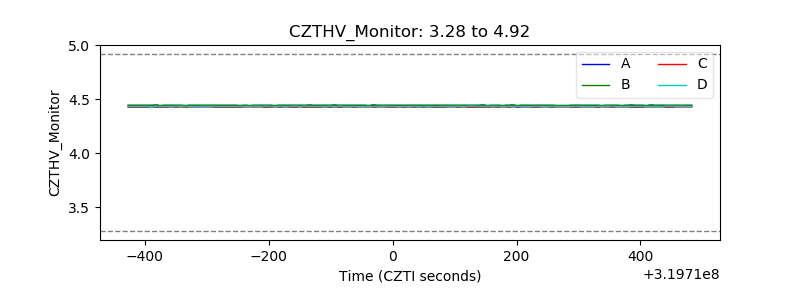 |
| D_VDD | 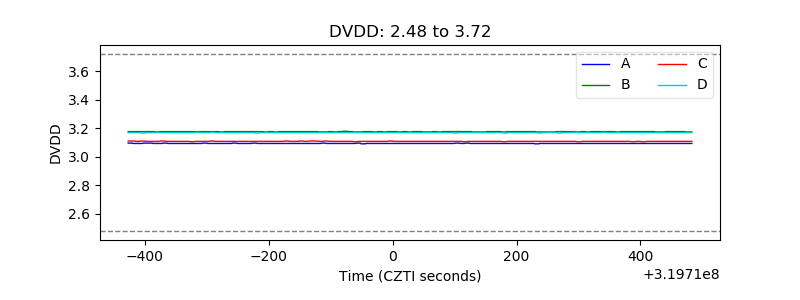 |
| Temperature 1 |  |
| Veto HV Monitor | 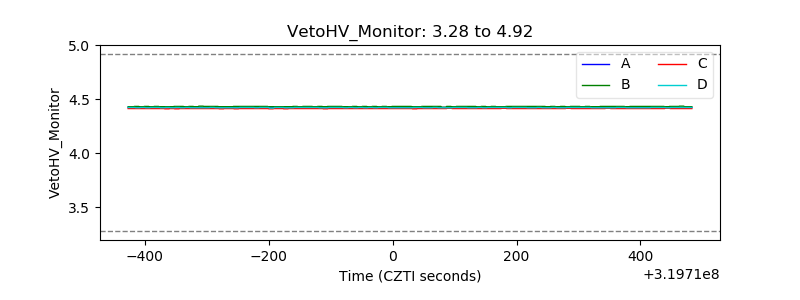 |
| Veto LLD | 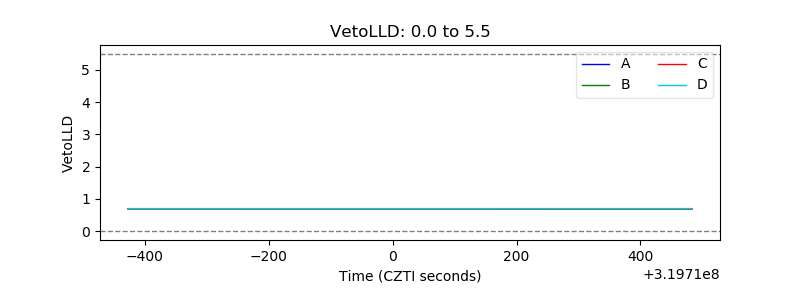 |
| Alpha Counter | 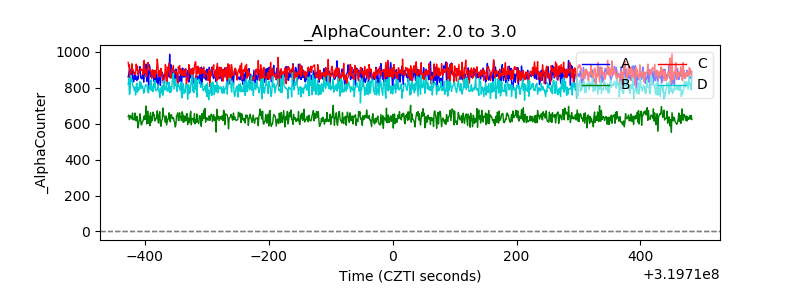 |
| _CPM_Rate | 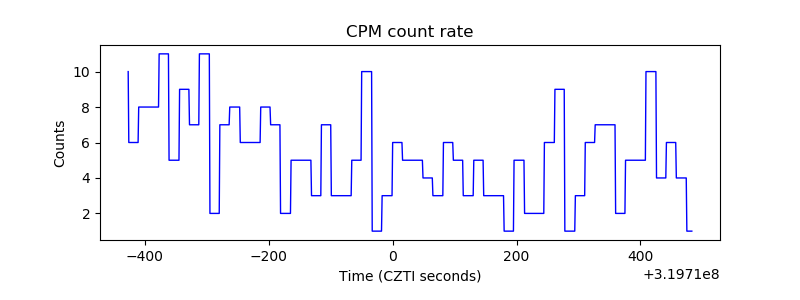 |
| CZT Counter | 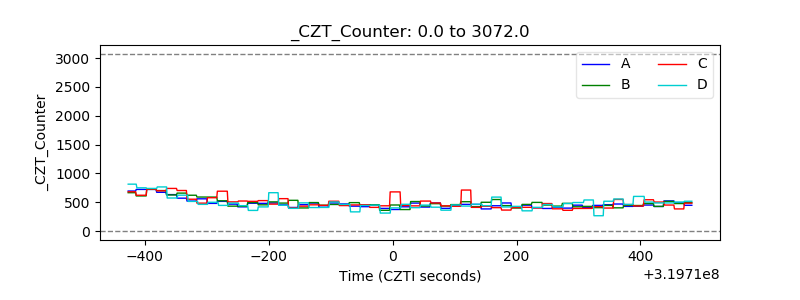 |
| +2.5 Volts monitor |  |
| +5 Volts monitor |  |
| _ROLL_ROT | 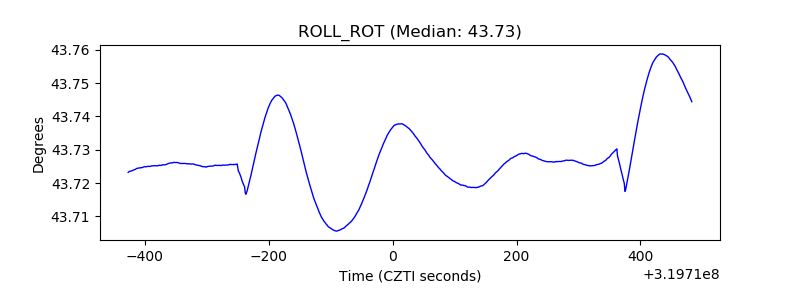 |
| _Roll_DEC |  |
| _Roll_RA | 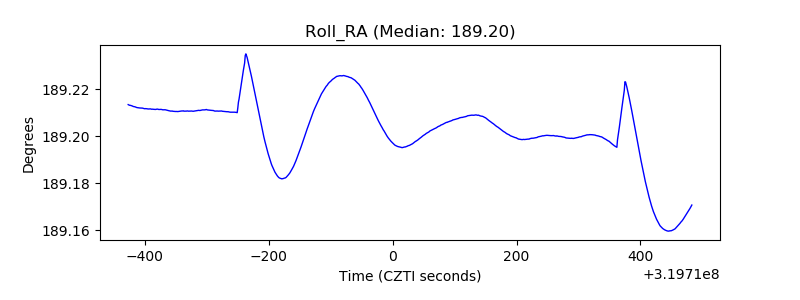 |
| Veto Counter | 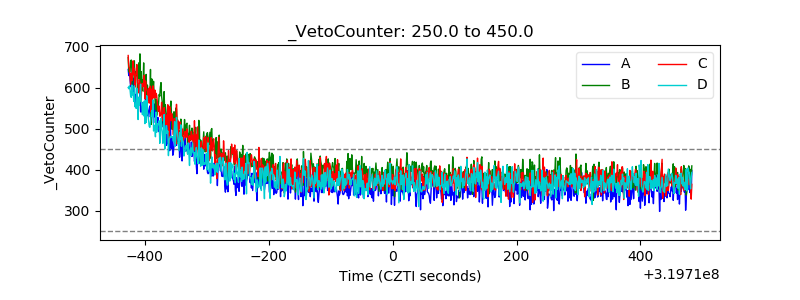 |