| Param | Original file | Final file |
|---|---|---|
| Filename | modeM0/AS1A08_009T01_9000003516_23747cztM0_level2.evt | modeM0/AS1A08_009T01_9000003516_23747cztM0_level2_quad_clean.evt |
| Size (bytes) | 1,210,536,000 | 219,479,040 |
| Size | 1.1 GB | 209.3 MB |
| Events in quadrant A | 8,147,559 | 1,377,641 |
| Events in quadrant B | 8,816,029 | 1,396,544 |
| Events in quadrant C | 8,381,050 | 1,341,181 |
| Events in quadrant D | 10,120,620 | 1,312,927 |
| Mode M9 | |||
|---|---|---|---|
| Quadrant | BADHDUFLAG | Total packets | Discarded packets |
| A | 0 | 20 | 0 |
| B | 0 | 20 | 0 |
| C | 0 | 20 | 0 |
| D | 0 | 20 | 0 |
| Mode SS | |||
|---|---|---|---|
| Quadrant | BADHDUFLAG | Total packets | Discarded packets |
| A | 0 | 360 | 0 |
| B | 0 | 360 | 0 |
| C | 0 | 360 | 0 |
| D | 0 | 360 | 0 |
| Mode M0 | |||
|---|---|---|---|
| Quadrant | BADHDUFLAG | Total packets | Discarded packets |
| A | 0 | 35905 | 3 |
| B | 0 | 37255 | 3 |
| C | 0 | 36137 | 3 |
| D | 0 | 40866 | 3 |
| Quadrant | Total seconds | Saturated seconds | Saturation percentage |
|---|---|---|---|
| A | 17684 | 180 | 1.017869% |
| B | 17685 | 238 | 1.345773% |
| C | 17685 | 260 | 1.470172% |
| D | 17685 | 237 | 1.340119% |
Noise dominated data is calculated using 1-second bins in cleaned event files. If a bin has >2000 counts, and if more than 50% of those come from <1% of pixels, then it is considered to be noise-dominated and hence unusable.
| Quadrant | # 1 sec bins | Bins with >0 counts | Bins with >2000 counts | High rate bins dominated by noise | Noise dominated (total time) | Noise dominated (detector-on time) | Marked lightcurve |
|---|---|---|---|---|---|---|---|
| A | 19694 | 17685 | 0 | 0 | 0.00% | 0.00% | 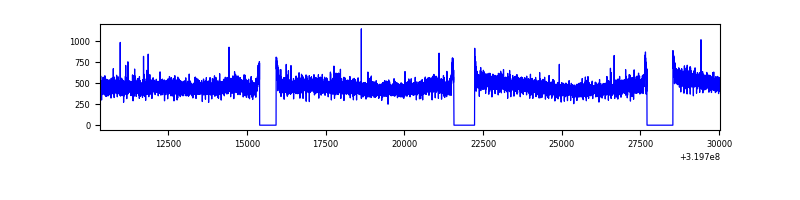 |
| B | 19695 | 17686 | 22 | 22 | 0.11% | 0.12% | 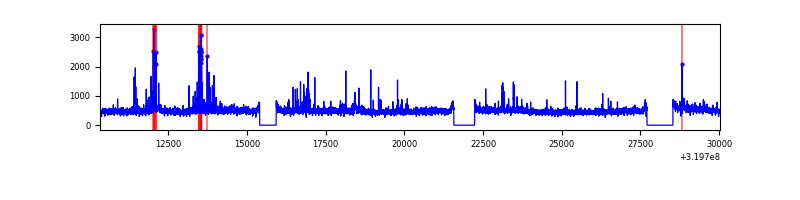 |
| C | 19695 | 17686 | 2 | 2 | 0.01% | 0.01% | 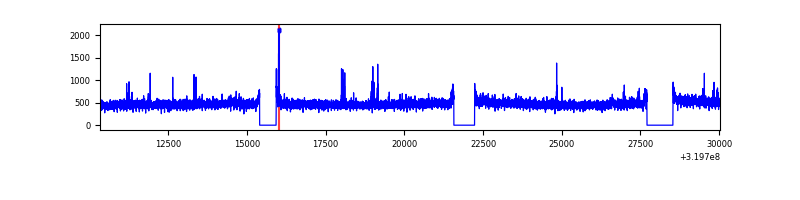 |
| D | 19695 | 17686 | 86 | 86 | 0.44% | 0.49% | 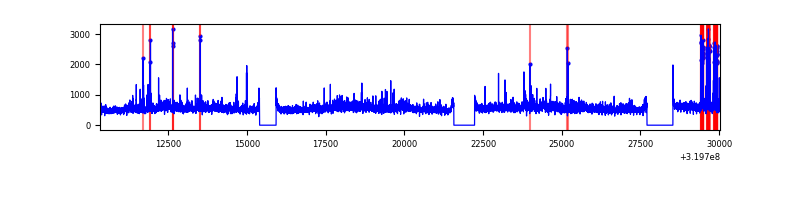 |
Top three noisy pixels from each quadrant. If the there are fewer than three noisy pixels in the level2.evt file, extra rows are filled as -1
| Pixel properties | Quadrant properties | ||||||
|---|---|---|---|---|---|---|---|
| Quadrant | DetID | PixID | Counts | Sigma | Mean | Median | Sigma |
| A | 13 | 254 | 31312 | 69.25 | 2111 | 2062 | 422.4 |
| A | 3 | 137 | 19080 | 40.29 | 2111 | 2062 | 422.4 |
| A | 0 | 226 | 18105 | 37.98 | 2111 | 2062 | 422.4 |
| B | 3 | 64 | 223473 | 554.47 | 2101 | 2047 | 399.3 |
| B | 0 | 229 | 124612 | 306.91 | 2101 | 2047 | 399.3 |
| B | 0 | 189 | 122314 | 301.16 | 2101 | 2047 | 399.3 |
| C | 14 | 238 | 319973 | 674.52 | 2023 | 2030 | 471.4 |
| C | 7 | 247 | 155299 | 325.16 | 2023 | 2030 | 471.4 |
| C | 13 | 61 | 14089 | 25.58 | 2023 | 2030 | 471.4 |
| D | 8 | 195 | 1915072 | 3887.95 | 2042 | 1983 | 492.1 |
| D | 1 | 52 | 275860 | 556.6 | 2042 | 1983 | 492.1 |
| D | 13 | 174 | 90197 | 179.28 | 2042 | 1983 | 492.1 |
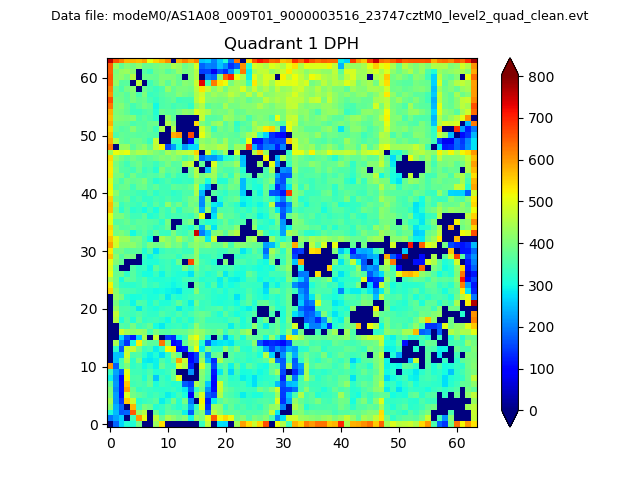
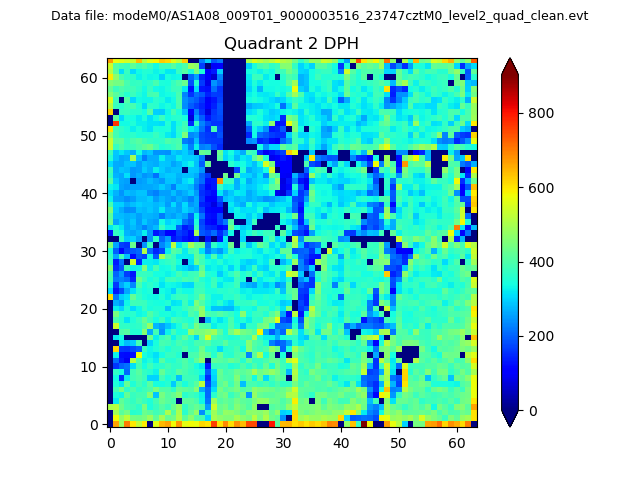
Histogram calculated using DETX and DETY for each event in the final _common_clean file
| Quadrant A |  |
 |
Quadrant B |
|---|---|---|---|
| Quadrant D | 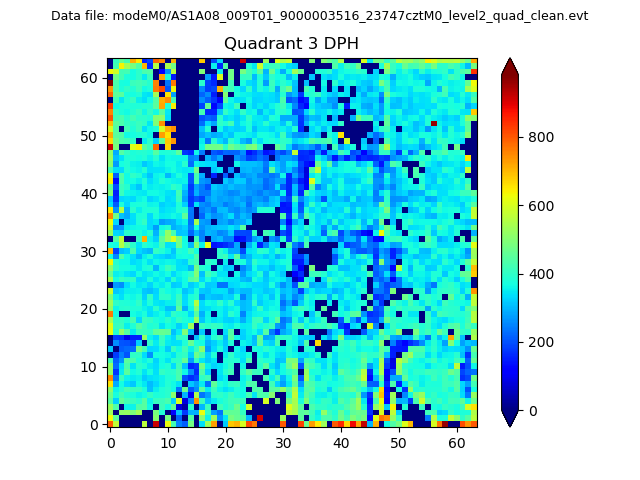 |
 |
Quadrant C |
| Plot type | Count rate plots | Images |
|---|---|---|
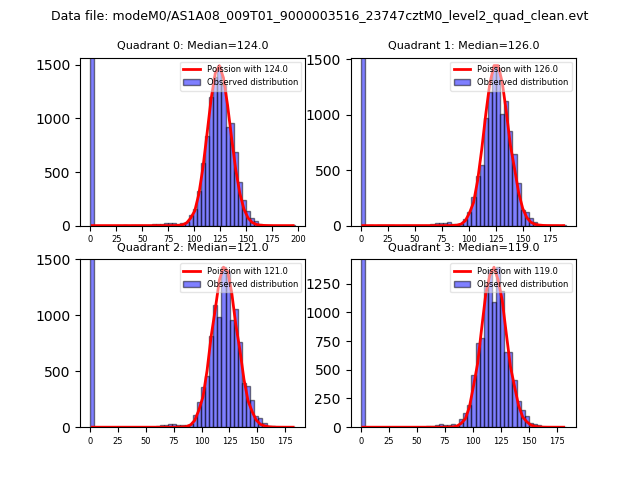
| Comparison with Poisson distribution Blue bars denote a histogram of data divided into 1 sec bins. Red curve is a Poisson curve with rate = median count rate of data. |
 |
 |
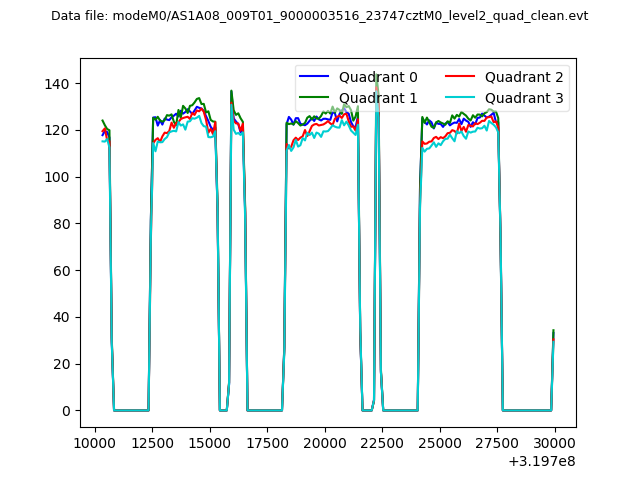
| Quadrant-wise count rates Data is divided into 100 sec bins |
 |
|
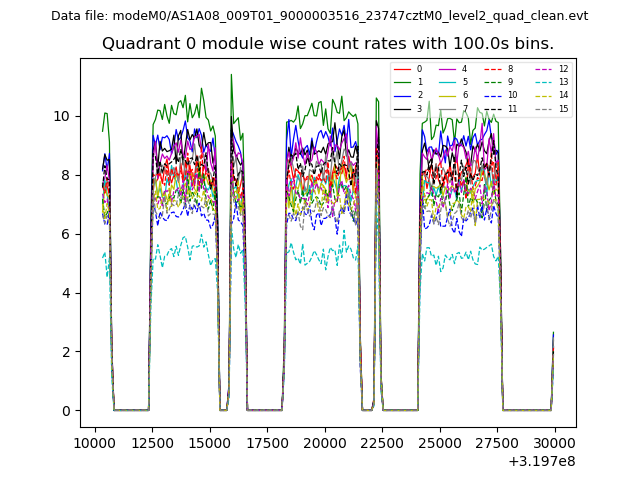
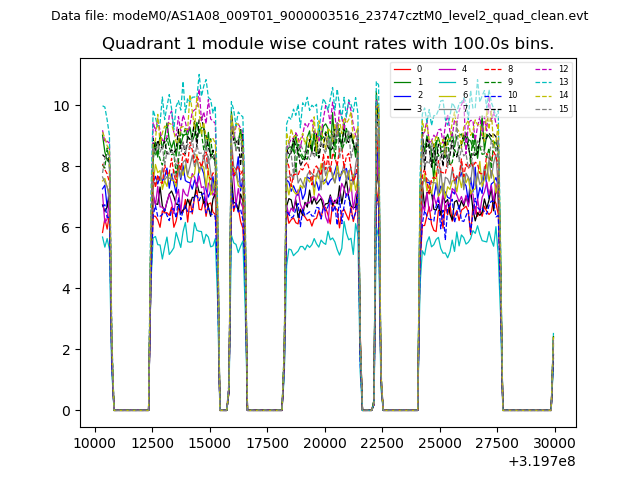
| Module-wise count rates for Quadrant A Data is divided into 100 sec bins |
 |
 |
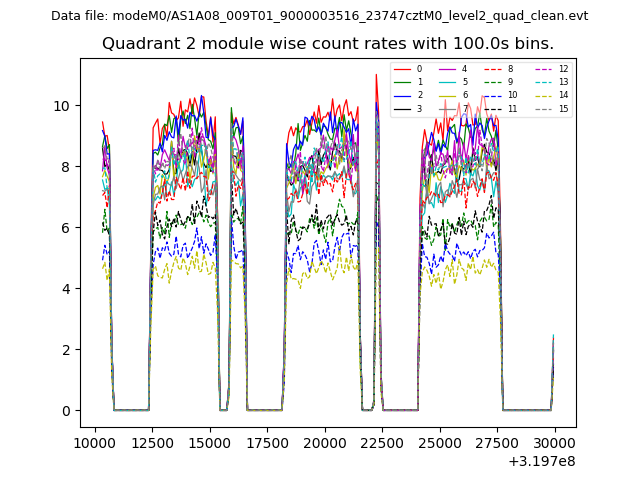
| Module-wise count rates for Quadrant B Data is divided into 100 sec bins |
 |
 |
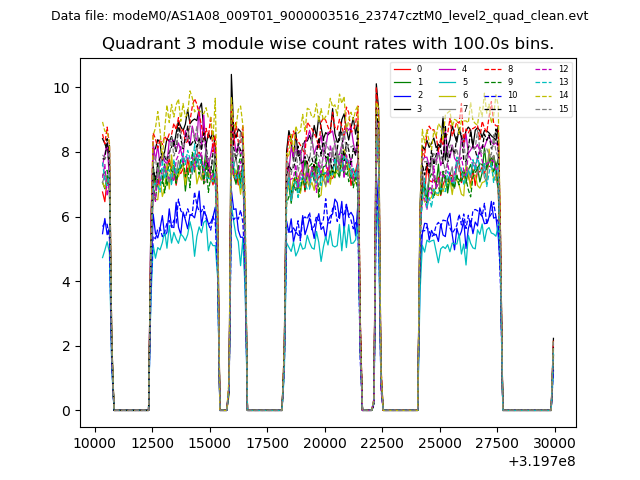
| Module-wise count rates for Quadrant C Data is divided into 100 sec bins |
 |
 |
| Module-wise count rates for Quadrant D Data is divided into 100 sec bins |
 |
 |
| Parameter | Plot |
|---|---|
| CZT HV Monitor | 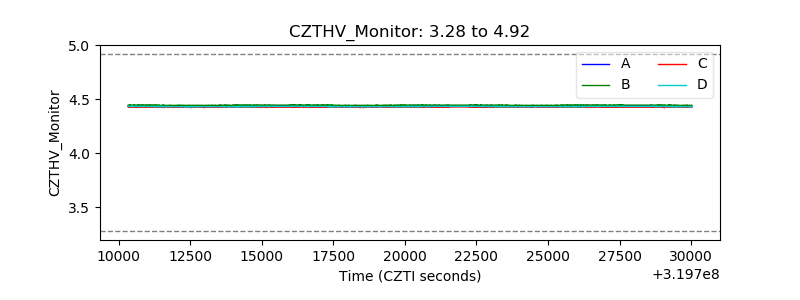 |
| D_VDD | 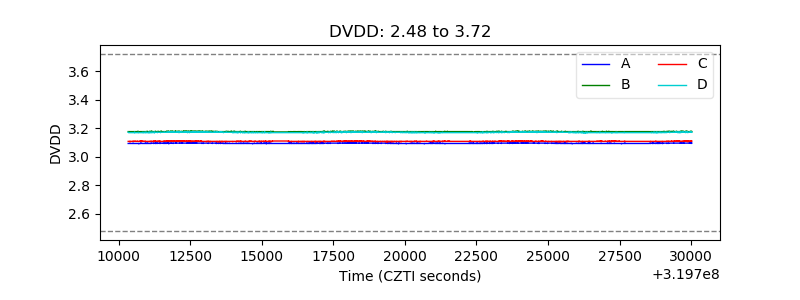 |
| Temperature 1 | 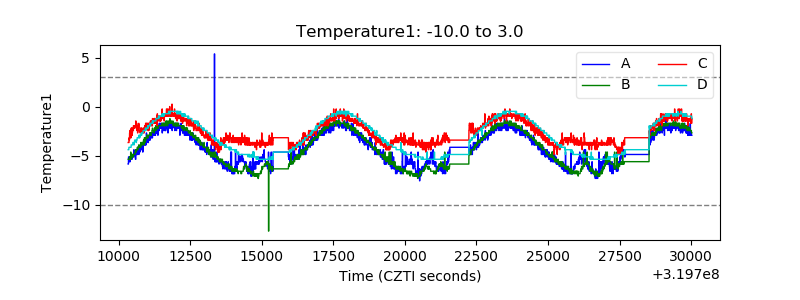 |
| Veto HV Monitor | 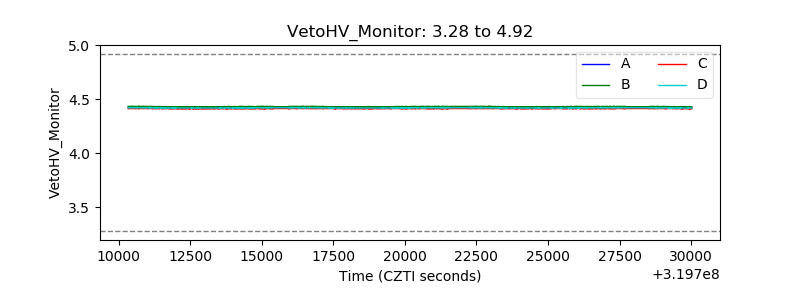 |
| Veto LLD | 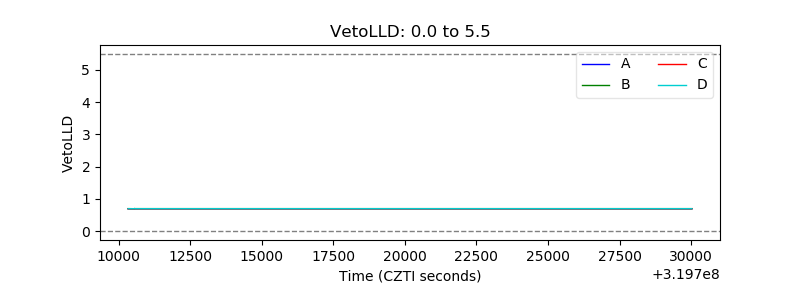 |
| Alpha Counter | 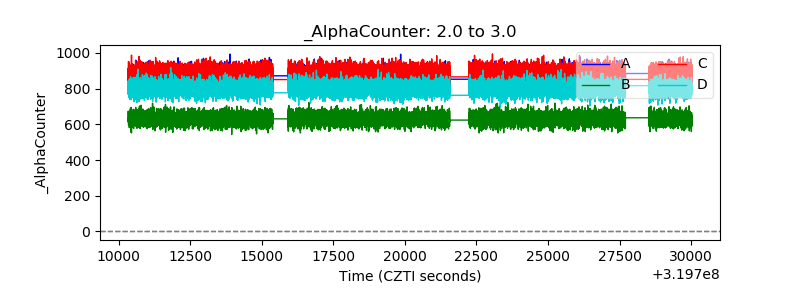 |
| _CPM_Rate | 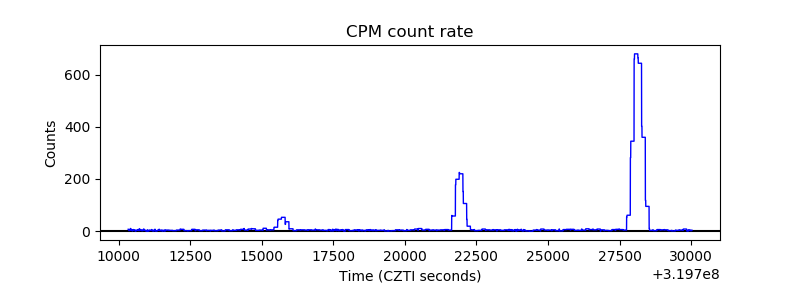 |
| CZT Counter | 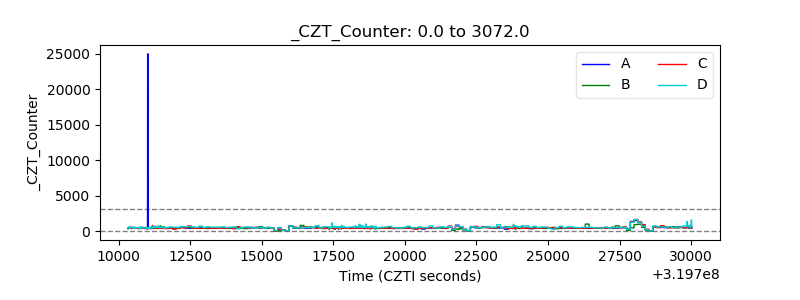 |
| +2.5 Volts monitor |  |
| +5 Volts monitor |  |
| _ROLL_ROT | 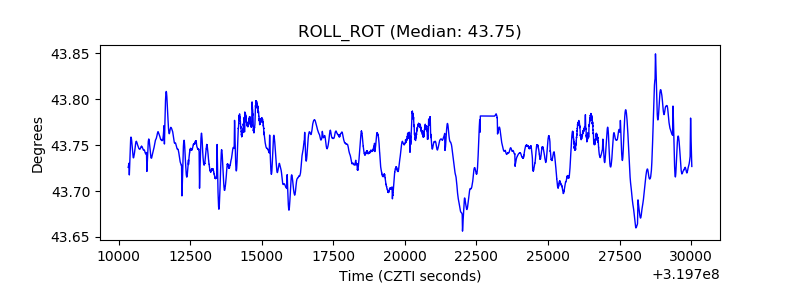 |
| _Roll_DEC | 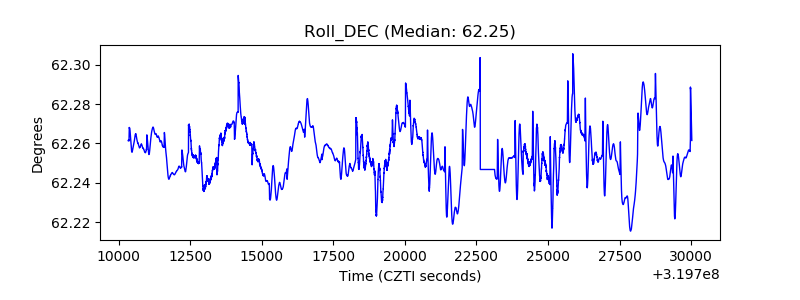 |
| _Roll_RA | 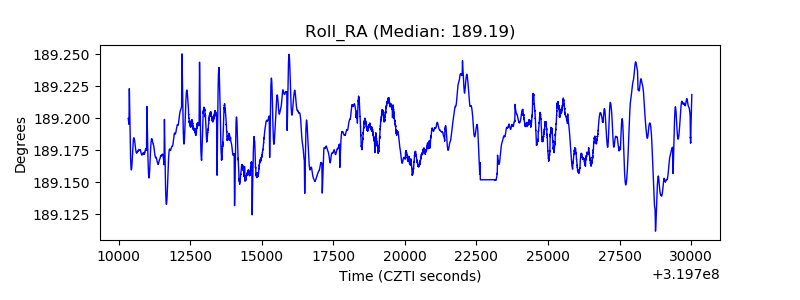 |
| Veto Counter | 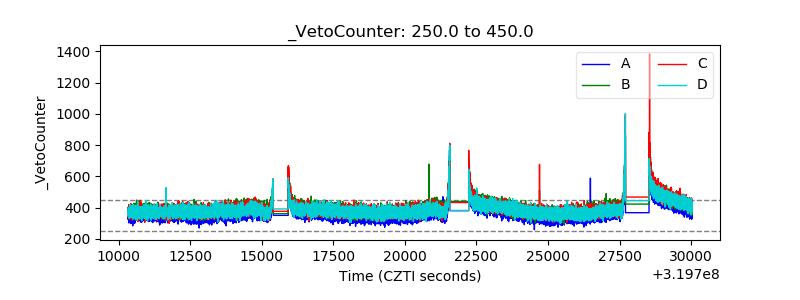 |