| Param | Original file | Final file |
|---|---|---|
| Filename | modeM0/AS1A08_009T01_9000003516_23750cztM0_level2.evt | modeM0/AS1A08_009T01_9000003516_23750cztM0_level2_quad_clean.evt |
| Size (bytes) | 549,380,160 | 99,420,480 |
| Size | 523.9 MB | 94.8 MB |
| Events in quadrant A | 3,185,122 | 655,269 |
| Events in quadrant B | 4,929,130 | 645,721 |
| Events in quadrant C | 3,373,782 | 643,976 |
| Events in quadrant D | 4,714,058 | 617,043 |
| Mode M9 | |||
|---|---|---|---|
| Quadrant | BADHDUFLAG | Total packets | Discarded packets |
| A | 0 | 18 | 0 |
| B | 0 | 19 | 0 |
| C | 0 | 19 | 0 |
| D | 0 | 19 | 0 |
| Mode SS | |||
|---|---|---|---|
| Quadrant | BADHDUFLAG | Total packets | Discarded packets |
| A | 0 | 130 | 0 |
| B | 0 | 130 | 0 |
| C | 0 | 130 | 0 |
| D | 0 | 130 | 0 |
| Mode M0 | |||
|---|---|---|---|
| Quadrant | BADHDUFLAG | Total packets | Discarded packets |
| A | 0 | 13933 | 2 |
| B | 0 | 19140 | 2 |
| C | 0 | 14422 | 2 |
| D | 0 | 18381 | 2 |
| Quadrant | Total seconds | Saturated seconds | Saturation percentage |
|---|---|---|---|
| A | 6435 | 52 | 0.808081% |
| B | 6435 | 451 | 7.008547% |
| C | 6435 | 114 | 1.771562% |
| D | 6434 | 332 | 5.160087% |
Noise dominated data is calculated using 1-second bins in cleaned event files. If a bin has >2000 counts, and if more than 50% of those come from <1% of pixels, then it is considered to be noise-dominated and hence unusable.
| Quadrant | # 1 sec bins | Bins with >0 counts | Bins with >2000 counts | High rate bins dominated by noise | Noise dominated (total time) | Noise dominated (detector-on time) | Marked lightcurve |
|---|---|---|---|---|---|---|---|
| A | 7600 | 6435 | 0 | 0 | 0.00% | 0.00% | 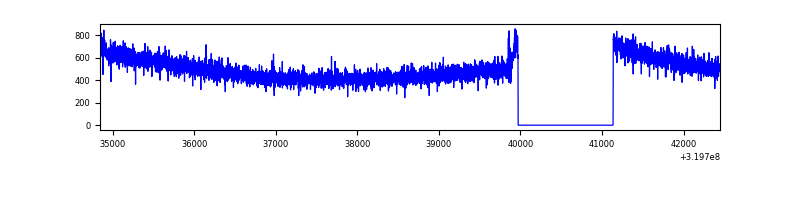 |
| B | 7599 | 6434 | 229 | 229 | 3.01% | 3.56% | 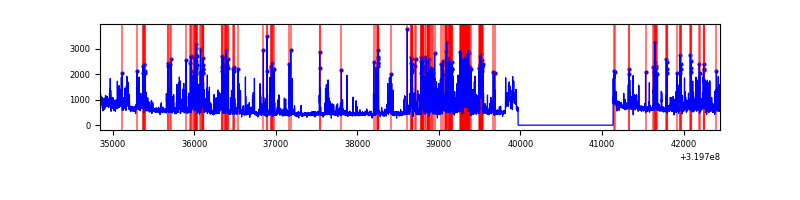 |
| C | 7600 | 6435 | 1 | 1 | 0.01% | 0.02% | 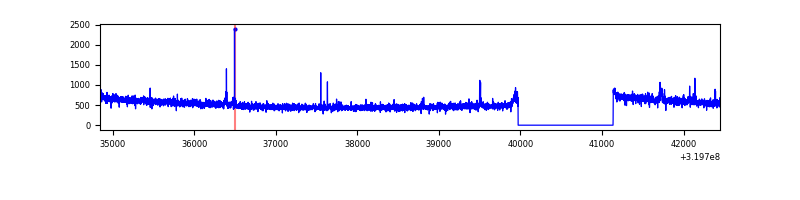 |
| D | 7599 | 6434 | 281 | 281 | 3.70% | 4.37% | 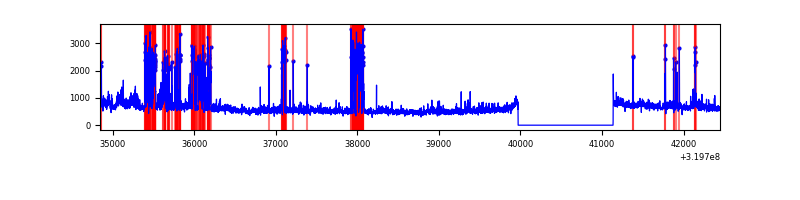 |
Top three noisy pixels from each quadrant. If the there are fewer than three noisy pixels in the level2.evt file, extra rows are filled as -1
| Pixel properties | Quadrant properties | ||||||
|---|---|---|---|---|---|---|---|
| Quadrant | DetID | PixID | Counts | Sigma | Mean | Median | Sigma |
| A | 13 | 254 | 11239 | 62.98 | 826 | 807 | 165.6 |
| A | 0 | 226 | 7223 | 38.73 | 826 | 807 | 165.6 |
| A | 3 | 137 | 6946 | 37.06 | 826 | 807 | 165.6 |
| B | 3 | 64 | 1609559 | 10596.21 | 810 | 789 | 151.8 |
| B | 0 | 189 | 87351 | 570.14 | 810 | 789 | 151.8 |
| B | 0 | 229 | 52429 | 340.13 | 810 | 789 | 151.8 |
| C | 14 | 238 | 129598 | 690.38 | 805 | 810 | 186.5 |
| C | 7 | 247 | 82828 | 439.66 | 805 | 810 | 186.5 |
| C | 5 | 4 | 11918 | 59.55 | 805 | 810 | 186.5 |
| D | 1 | 52 | 926290 | 4806.16 | 798 | 774 | 192.6 |
| D | 8 | 195 | 708732 | 3676.39 | 798 | 774 | 192.6 |
| D | 2 | 234 | 27233 | 137.4 | 798 | 774 | 192.6 |
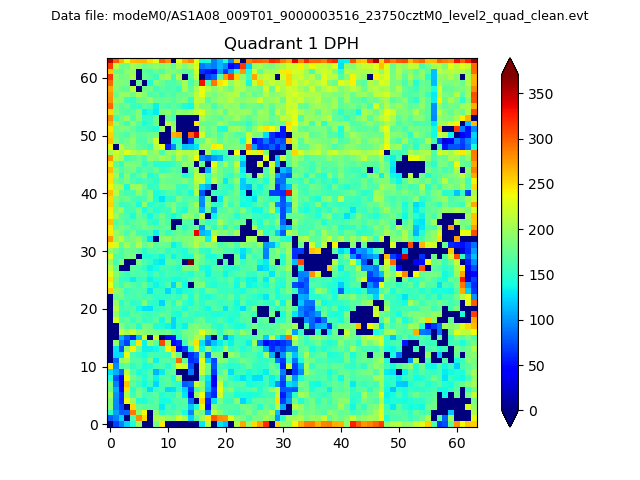
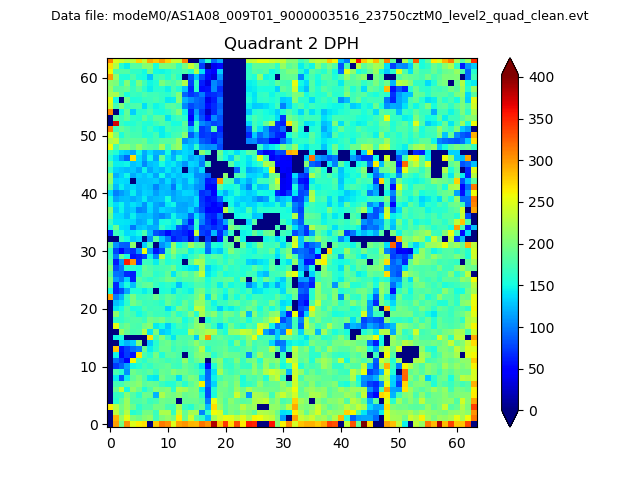
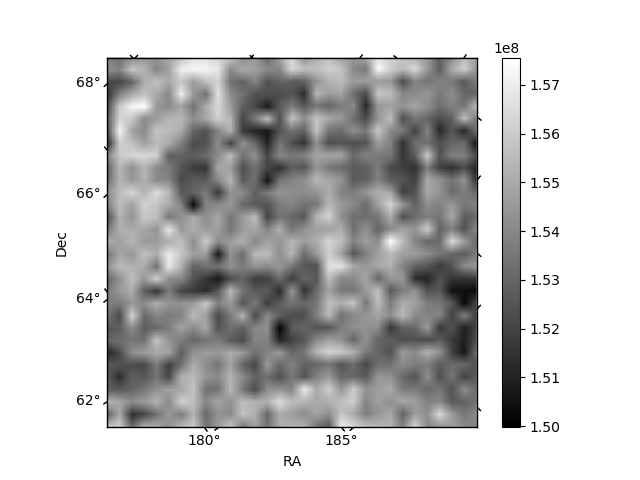
Histogram calculated using DETX and DETY for each event in the final _common_clean file
| Quadrant A |  |
 |
Quadrant B |
|---|---|---|---|
| Quadrant D | 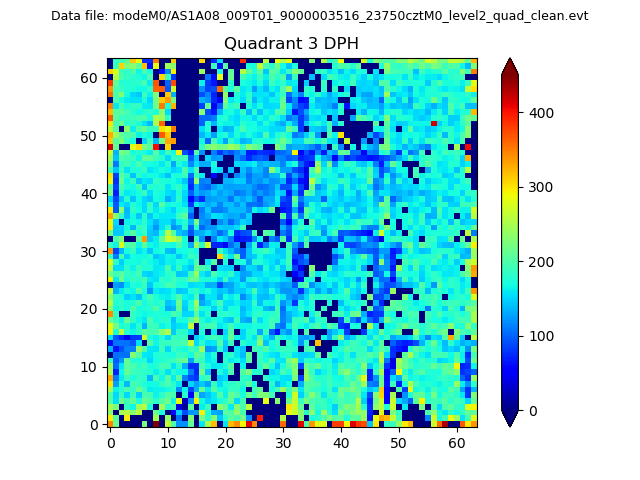 |
 |
Quadrant C |
| Plot type | Count rate plots | Images |
|---|---|---|
| Comparison with Poisson distribution Blue bars denote a histogram of data divided into 1 sec bins. Red curve is a Poisson curve with rate = median count rate of data. |
 |
 |
| Quadrant-wise count rates Data is divided into 100 sec bins |
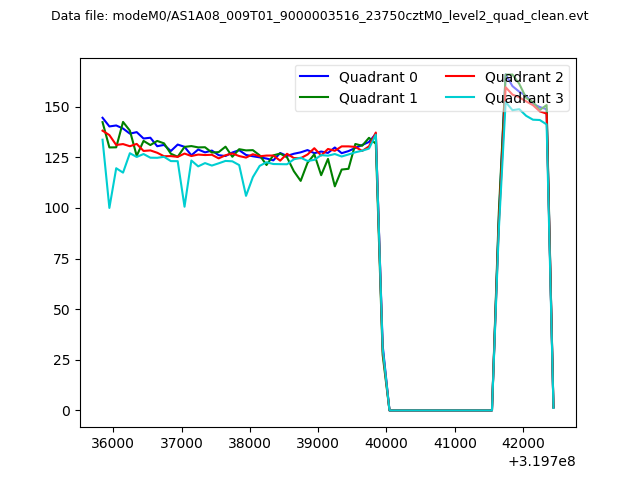 |
|
| Module-wise count rates for Quadrant A Data is divided into 100 sec bins |
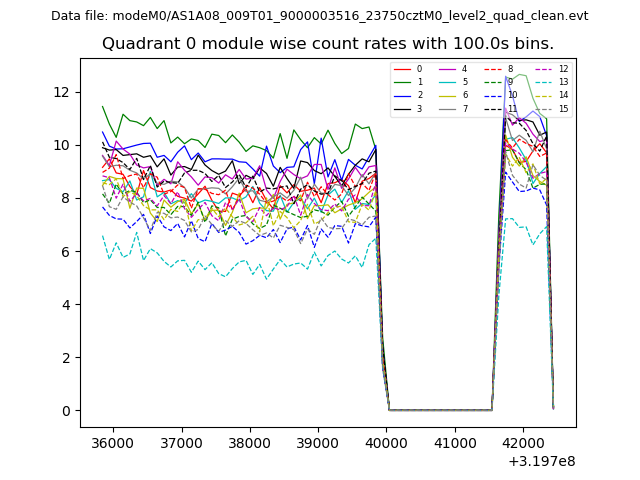 |
 |
| Module-wise count rates for Quadrant B Data is divided into 100 sec bins |
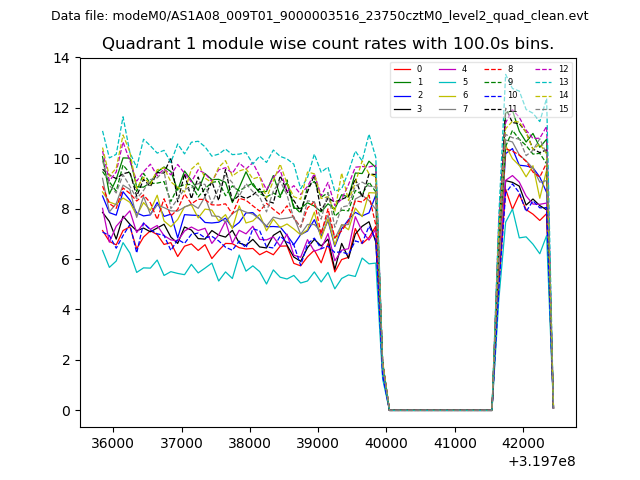 |
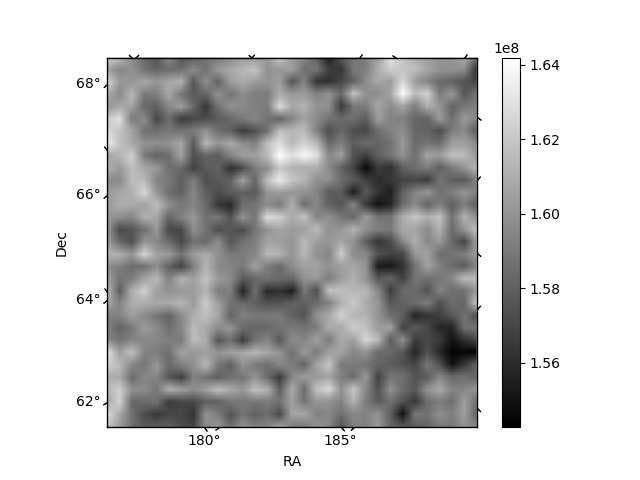 |
| Module-wise count rates for Quadrant C Data is divided into 100 sec bins |
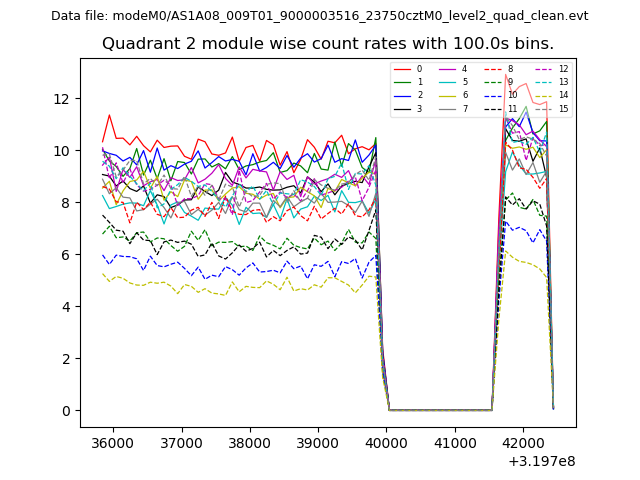 |
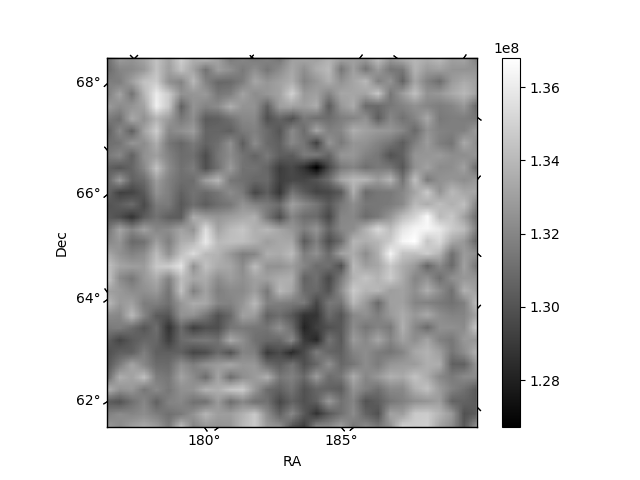 |
| Module-wise count rates for Quadrant D Data is divided into 100 sec bins |
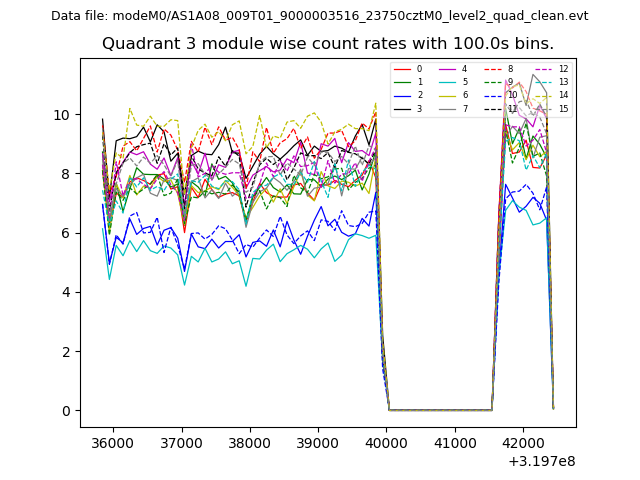 |
 |
| Parameter | Plot |
|---|---|
| CZT HV Monitor | 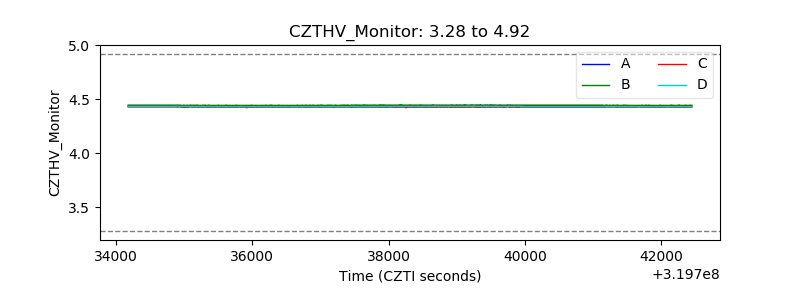 |
| D_VDD | 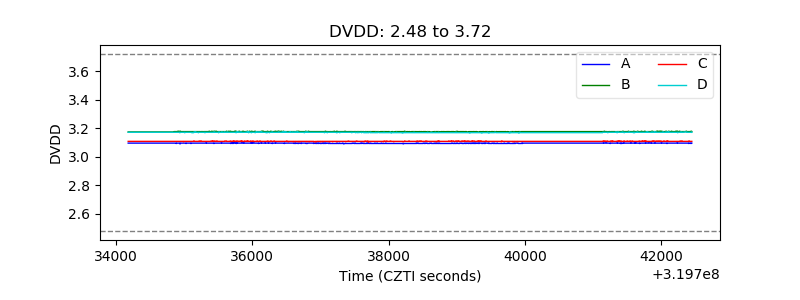 |
| Temperature 1 | 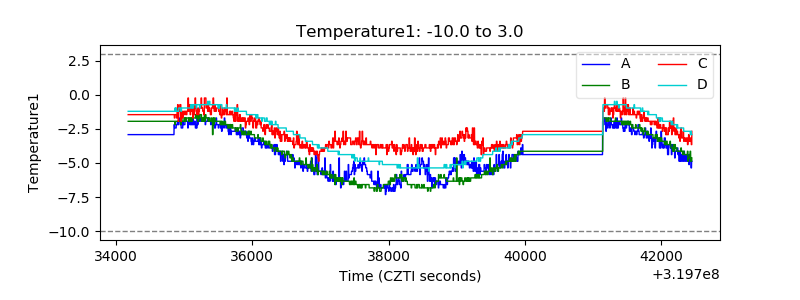 |
| Veto HV Monitor | 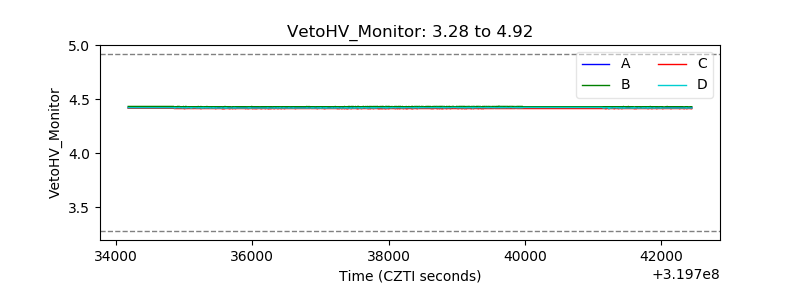 |
| Veto LLD | 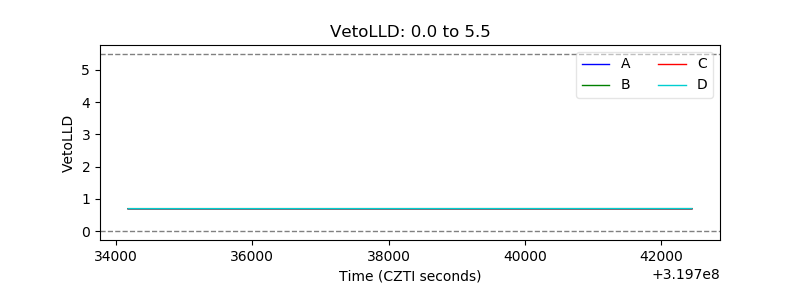 |
| Alpha Counter | 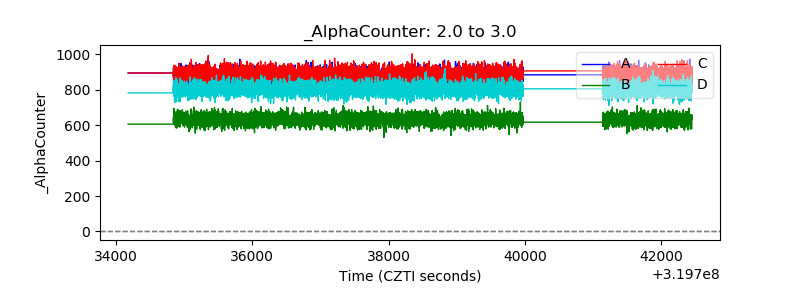 |
| _CPM_Rate | 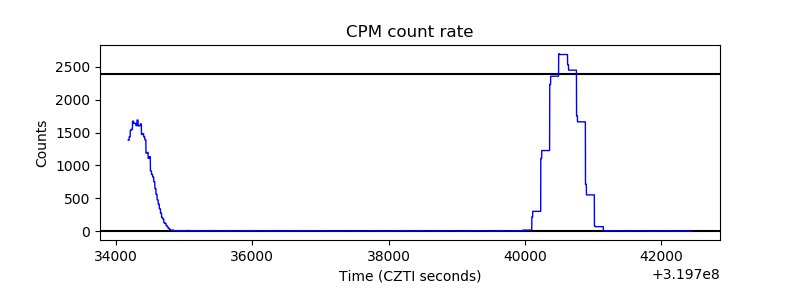 |
| CZT Counter | 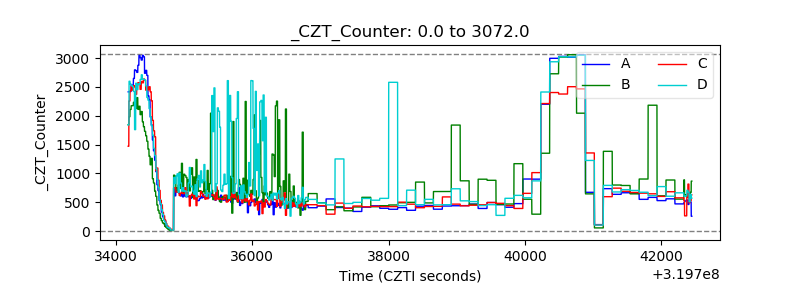 |
| +2.5 Volts monitor |  |
| +5 Volts monitor |  |
| _ROLL_ROT | 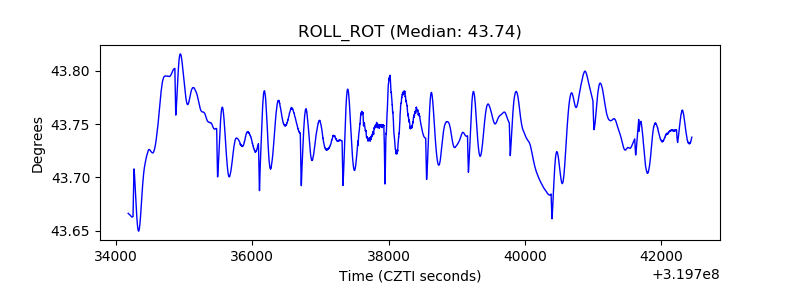 |
| _Roll_DEC | 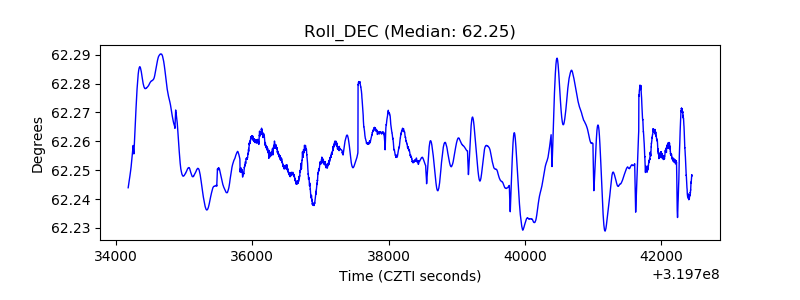 |
| _Roll_RA | 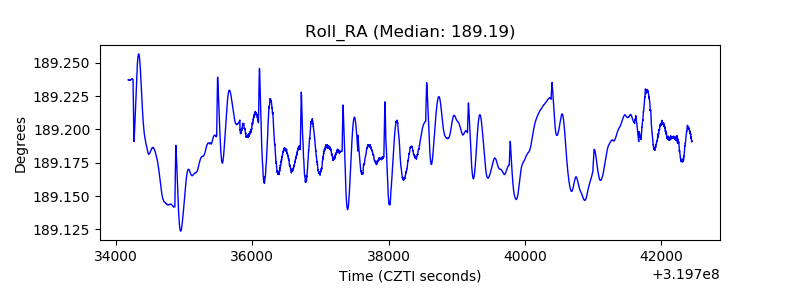 |
| Veto Counter | 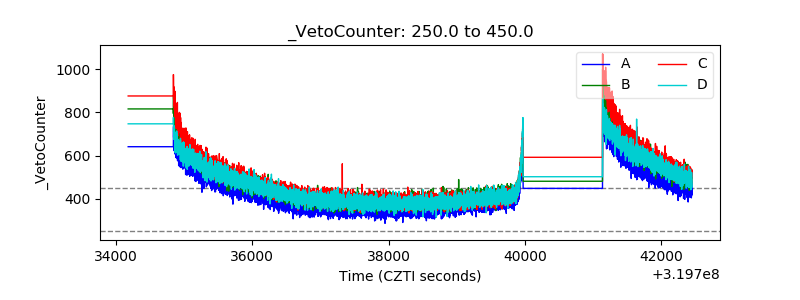 |