| Param | Original file | Final file |
|---|---|---|
| Filename | modeM0/AS1A08_009T01_9000003516_23751cztM0_level2.evt | modeM0/AS1A08_009T01_9000003516_23751cztM0_level2_quad_clean.evt |
| Size (bytes) | 495,792,000 | 115,329,600 |
| Size | 472.8 MB | 110.0 MB |
| Events in quadrant A | 3,180,733 | 768,507 |
| Events in quadrant B | 3,980,044 | 784,573 |
| Events in quadrant C | 3,381,476 | 766,690 |
| Events in quadrant D | 4,046,383 | 734,735 |
| Mode M9 | |||
|---|---|---|---|
| Quadrant | BADHDUFLAG | Total packets | Discarded packets |
| A | 0 | 17 | 0 |
| B | 0 | 18 | 0 |
| C | 0 | 18 | 0 |
| D | 0 | 18 | 0 |
| Mode SS | |||
|---|---|---|---|
| Quadrant | BADHDUFLAG | Total packets | Discarded packets |
| A | 0 | 128 | 0 |
| B | 0 | 128 | 0 |
| C | 0 | 128 | 0 |
| D | 0 | 128 | 0 |
| Mode M0 | |||
|---|---|---|---|
| Quadrant | BADHDUFLAG | Total packets | Discarded packets |
| A | 0 | 13731 | 2 |
| B | 0 | 16063 | 2 |
| C | 0 | 14342 | 2 |
| D | 0 | 16334 | 2 |
| Quadrant | Total seconds | Saturated seconds | Saturation percentage |
|---|---|---|---|
| A | 6285 | 41 | 0.652347% |
| B | 6285 | 167 | 2.657120% |
| C | 6285 | 113 | 1.797932% |
| D | 6285 | 126 | 2.004773% |
Noise dominated data is calculated using 1-second bins in cleaned event files. If a bin has >2000 counts, and if more than 50% of those come from <1% of pixels, then it is considered to be noise-dominated and hence unusable.
| Quadrant | # 1 sec bins | Bins with >0 counts | Bins with >2000 counts | High rate bins dominated by noise | Noise dominated (total time) | Noise dominated (detector-on time) | Marked lightcurve |
|---|---|---|---|---|---|---|---|
| A | 7555 | 6285 | 0 | 0 | 0.00% | 0.00% | 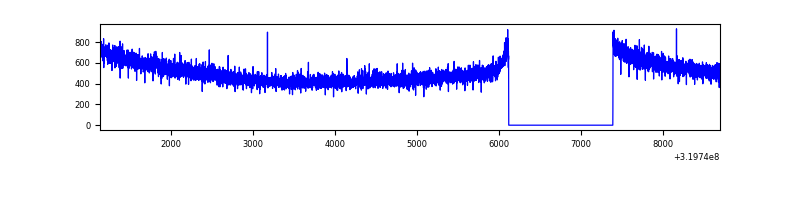 |
| B | 7555 | 6285 | 62 | 62 | 0.82% | 0.99% | 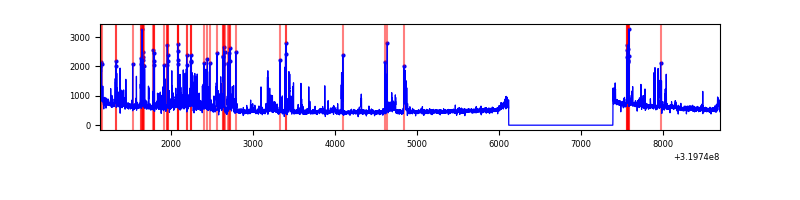 |
| C | 7555 | 6285 | 1 | 1 | 0.01% | 0.02% | 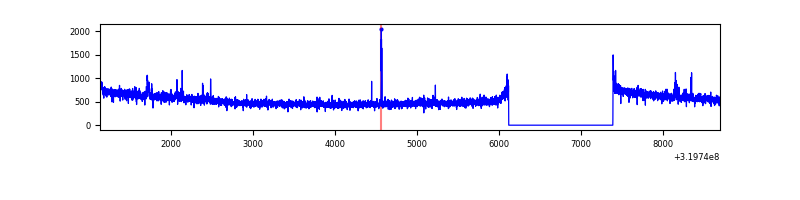 |
| D | 7555 | 6285 | 60 | 60 | 0.79% | 0.95% | 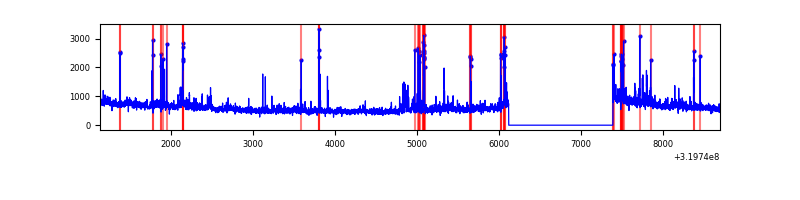 |
Top three noisy pixels from each quadrant. If the there are fewer than three noisy pixels in the level2.evt file, extra rows are filled as -1
| Pixel properties | Quadrant properties | ||||||
|---|---|---|---|---|---|---|---|
| Quadrant | DetID | PixID | Counts | Sigma | Mean | Median | Sigma |
| A | 13 | 254 | 11686 | 65.47 | 825 | 807 | 166.2 |
| A | 0 | 226 | 7014 | 37.35 | 825 | 807 | 166.2 |
| A | 3 | 137 | 6863 | 36.44 | 825 | 807 | 166.2 |
| B | 3 | 64 | 609382 | 3970.69 | 826 | 808 | 153.3 |
| B | 0 | 229 | 106595 | 690.22 | 826 | 808 | 153.3 |
| B | 0 | 189 | 24689 | 155.81 | 826 | 808 | 153.3 |
| C | 14 | 238 | 130009 | 691.63 | 814 | 821 | 186.8 |
| C | 7 | 247 | 51776 | 272.79 | 814 | 821 | 186.8 |
| C | 5 | 4 | 17995 | 91.94 | 814 | 821 | 186.8 |
| D | 8 | 195 | 597247 | 3063.29 | 812 | 790 | 194.7 |
| D | 1 | 52 | 235084 | 1203.29 | 812 | 790 | 194.7 |
| D | 12 | 233 | 79661 | 405.07 | 812 | 790 | 194.7 |
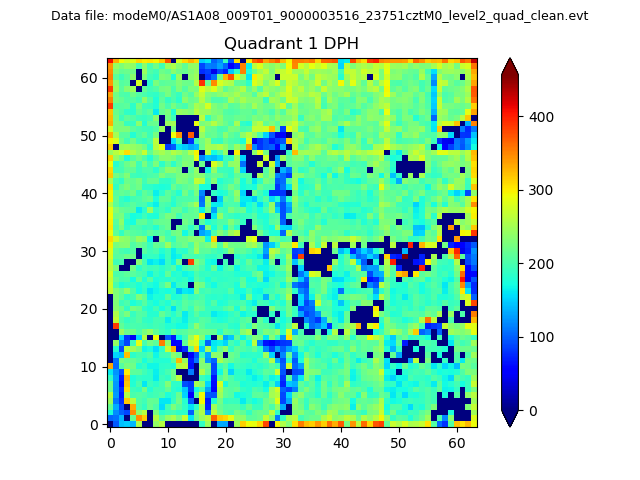
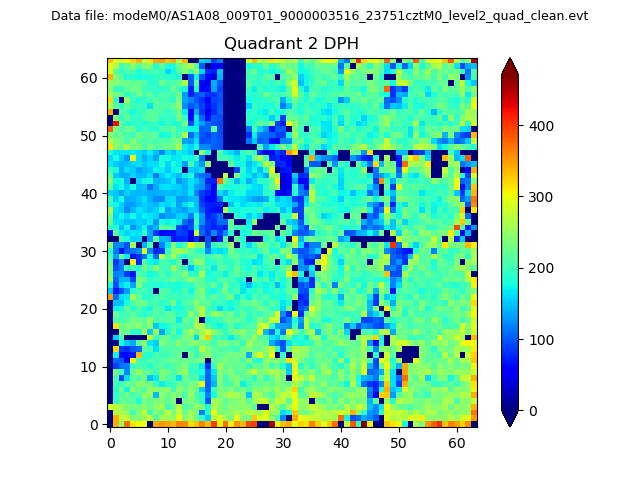
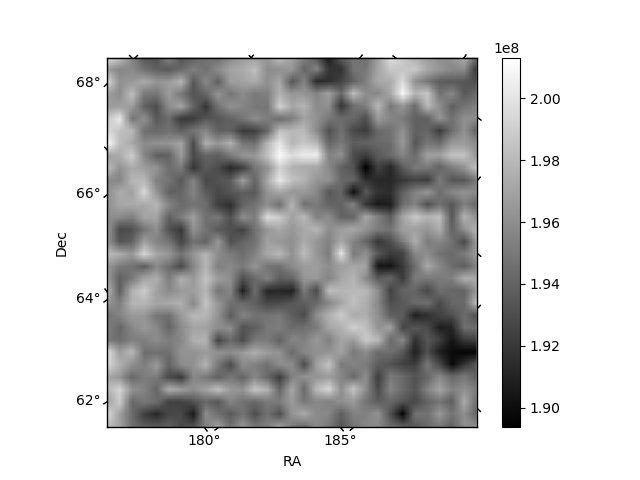
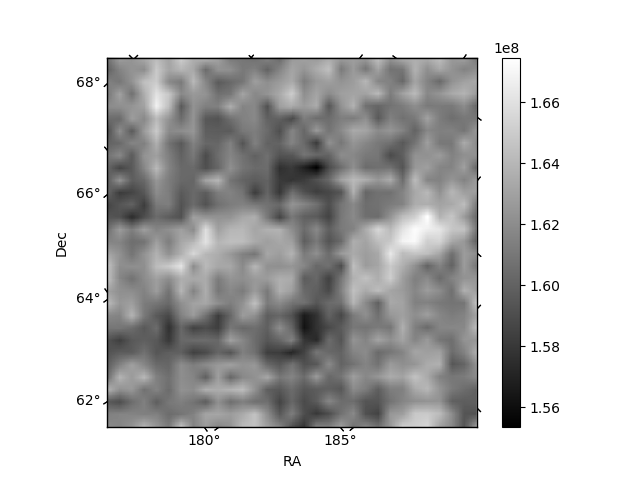
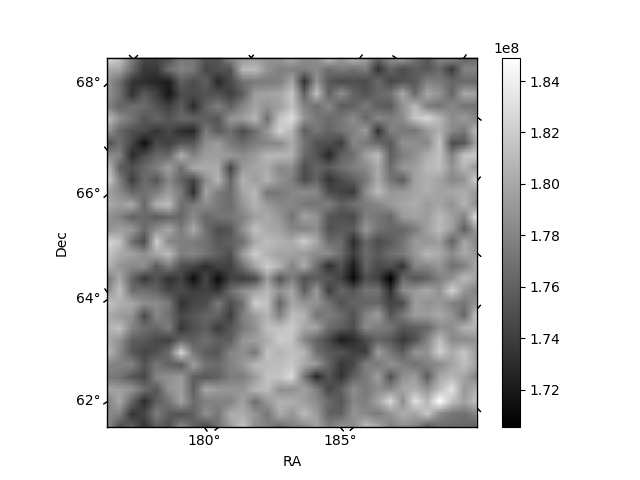
Histogram calculated using DETX and DETY for each event in the final _common_clean file
| Quadrant A |  |
 |
Quadrant B |
|---|---|---|---|
| Quadrant D | 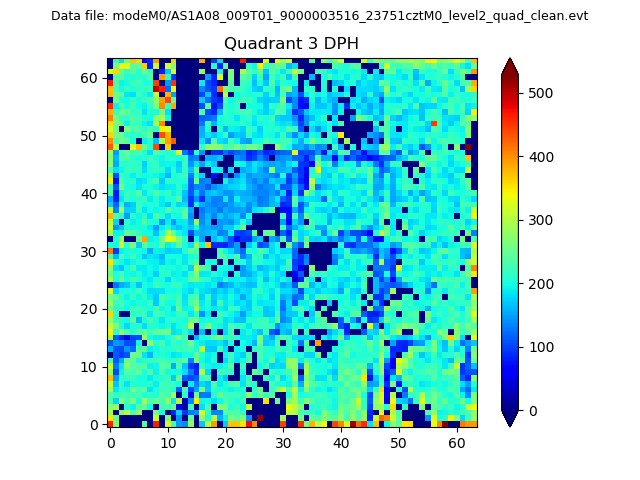 |
 |
Quadrant C |
| Plot type | Count rate plots | Images |
|---|---|---|
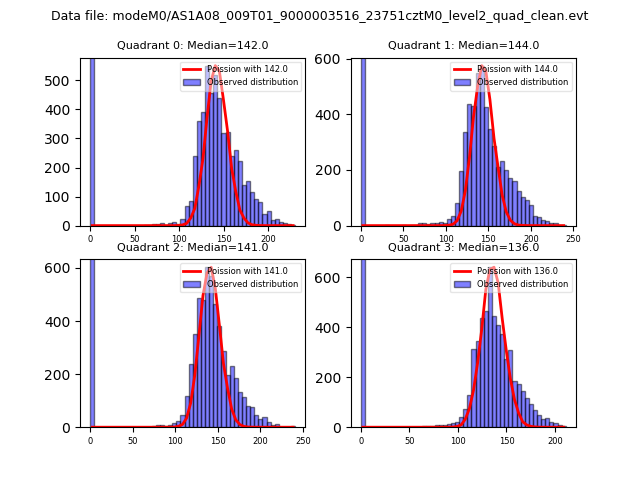
| Comparison with Poisson distribution Blue bars denote a histogram of data divided into 1 sec bins. Red curve is a Poisson curve with rate = median count rate of data. |
 |
 |
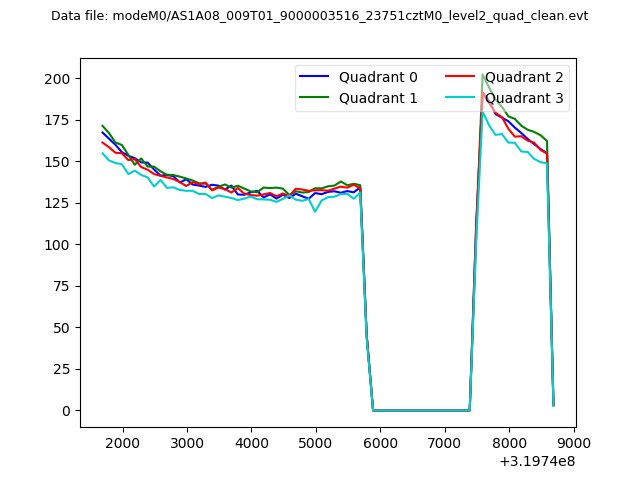
| Quadrant-wise count rates Data is divided into 100 sec bins |
 |
|
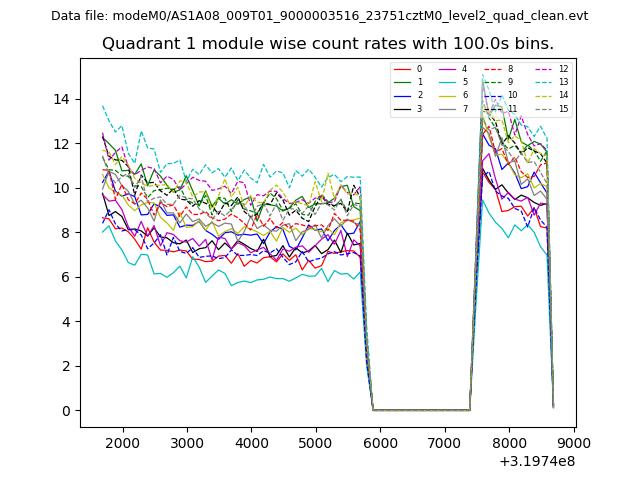
| Module-wise count rates for Quadrant A Data is divided into 100 sec bins |
 |
 |
| Module-wise count rates for Quadrant B Data is divided into 100 sec bins |
 |
 |
| Module-wise count rates for Quadrant C Data is divided into 100 sec bins |
 |
 |
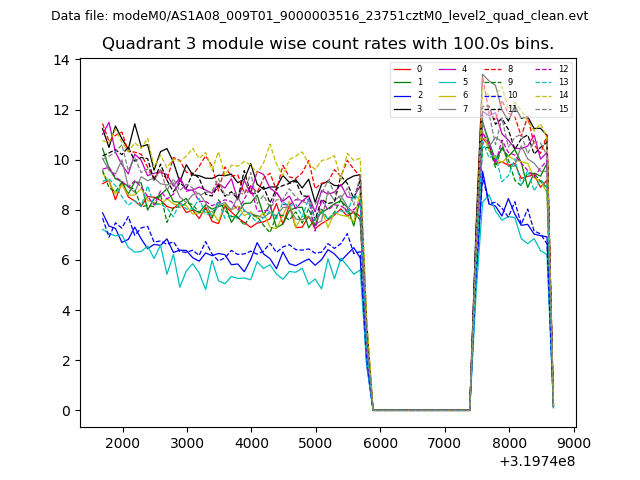
| Module-wise count rates for Quadrant D Data is divided into 100 sec bins |
 |
 |
| Parameter | Plot |
|---|---|
| CZT HV Monitor | 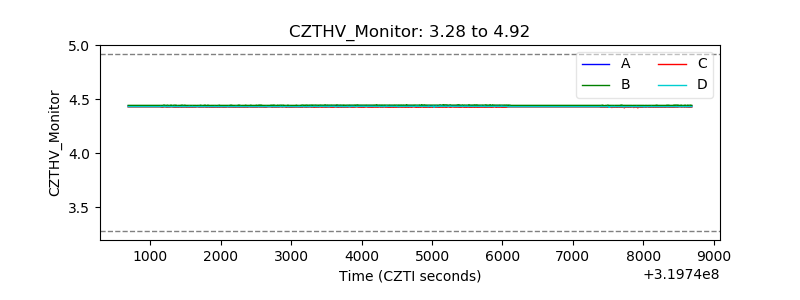 |
| D_VDD | 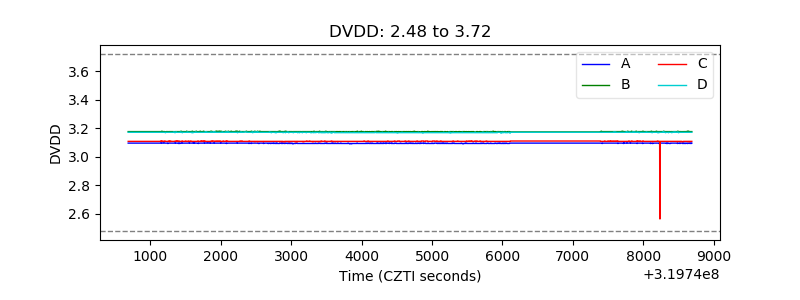 |
| Temperature 1 | 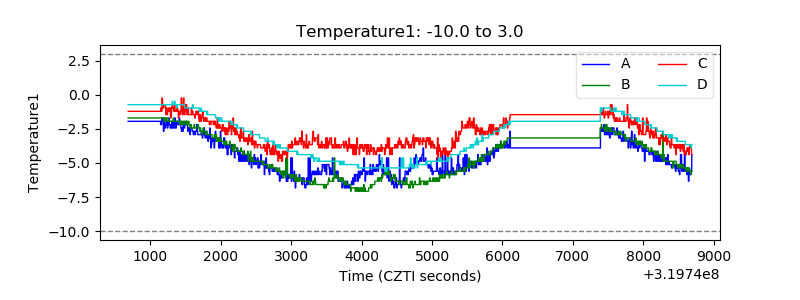 |
| Veto HV Monitor | 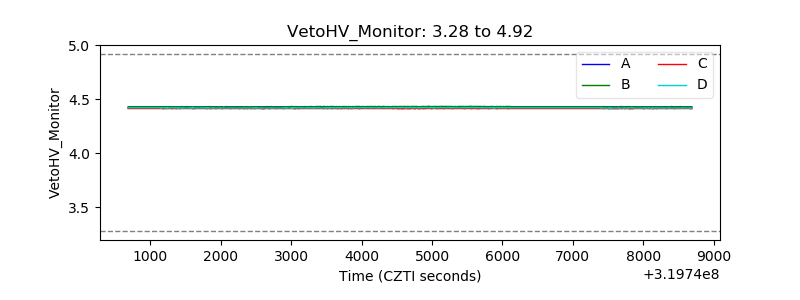 |
| Veto LLD | 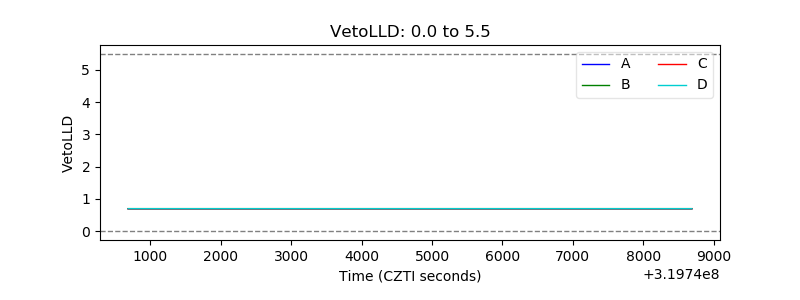 |
| Alpha Counter | 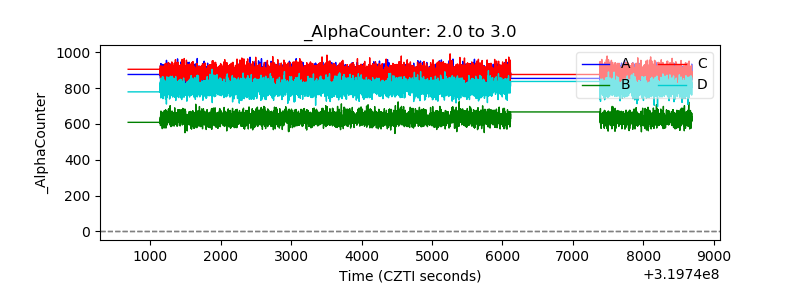 |
| _CPM_Rate | 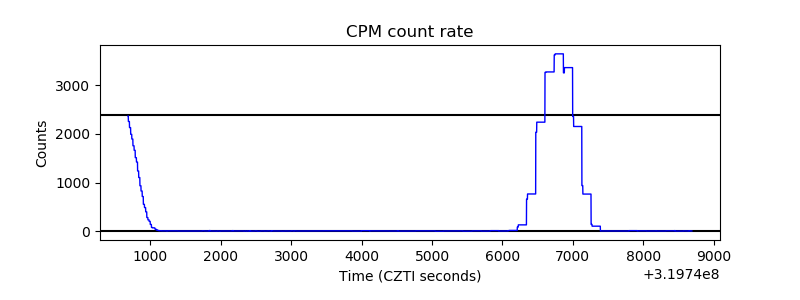 |
| CZT Counter | 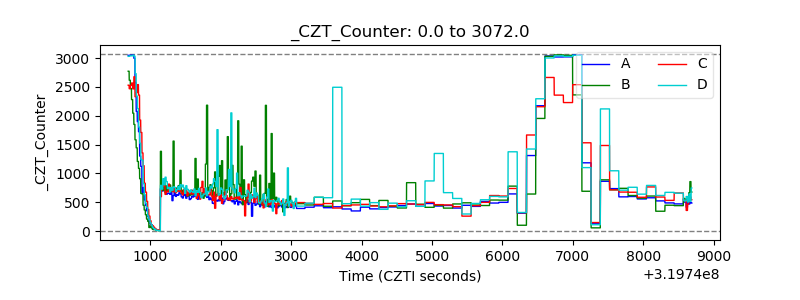 |
| +2.5 Volts monitor |  |
| +5 Volts monitor |  |
| _ROLL_ROT | 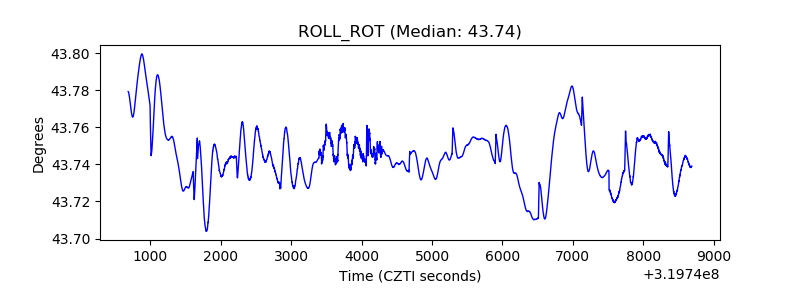 |
| _Roll_DEC | 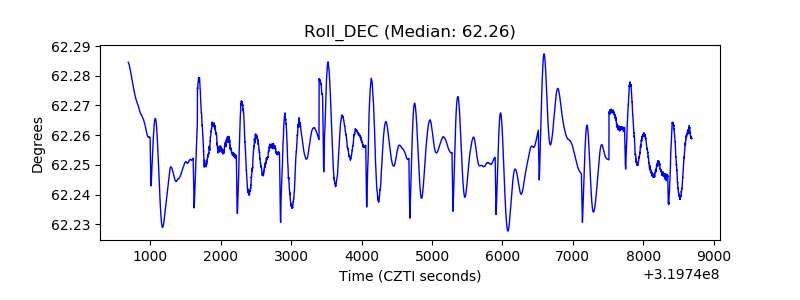 |
| _Roll_RA | 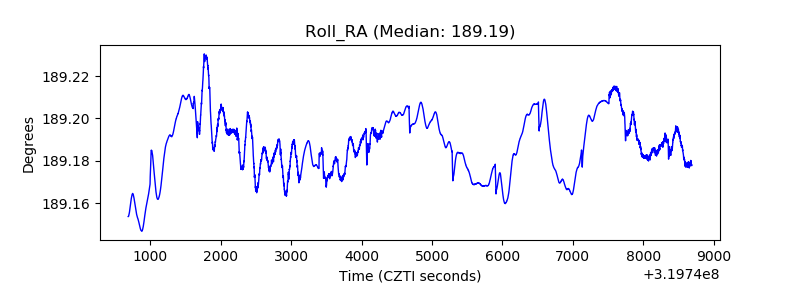 |
| Veto Counter | 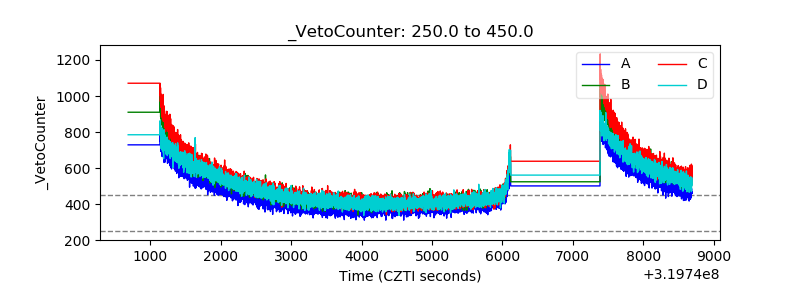 |