| Param | Original file | Final file |
|---|---|---|
| Filename | modeM0/AS1A08_009T01_9000003516_23752cztM0_level2.evt | modeM0/AS1A08_009T01_9000003516_23752cztM0_level2_quad_clean.evt |
| Size (bytes) | 461,306,880 | 124,761,600 |
| Size | 439.9 MB | 119.0 MB |
| Events in quadrant A | 3,145,184 | 834,391 |
| Events in quadrant B | 3,510,876 | 866,191 |
| Events in quadrant C | 3,338,027 | 842,679 |
| Events in quadrant D | 3,557,214 | 804,436 |
| Mode M9 | |||
|---|---|---|---|
| Quadrant | BADHDUFLAG | Total packets | Discarded packets |
| A | 0 | 13 | 0 |
| B | 0 | 13 | 0 |
| C | 0 | 13 | 0 |
| D | 0 | 13 | 0 |
| Mode SS | |||
|---|---|---|---|
| Quadrant | BADHDUFLAG | Total packets | Discarded packets |
| A | 0 | 126 | 0 |
| B | 0 | 126 | 0 |
| C | 0 | 126 | 0 |
| D | 0 | 126 | 0 |
| Mode M0 | |||
|---|---|---|---|
| Quadrant | BADHDUFLAG | Total packets | Discarded packets |
| A | 0 | 13417 | 2 |
| B | 0 | 14476 | 2 |
| C | 0 | 13990 | 2 |
| D | 0 | 14678 | 2 |
| Quadrant | Total seconds | Saturated seconds | Saturation percentage |
|---|---|---|---|
| A | 6175 | 58 | 0.939271% |
| B | 6176 | 126 | 2.040155% |
| C | 6176 | 117 | 1.894430% |
| D | 6176 | 83 | 1.343912% |
Noise dominated data is calculated using 1-second bins in cleaned event files. If a bin has >2000 counts, and if more than 50% of those come from <1% of pixels, then it is considered to be noise-dominated and hence unusable.
| Quadrant | # 1 sec bins | Bins with >0 counts | Bins with >2000 counts | High rate bins dominated by noise | Noise dominated (total time) | Noise dominated (detector-on time) | Marked lightcurve |
|---|---|---|---|---|---|---|---|
| A | 7475 | 6175 | 0 | 0 | 0.00% | 0.00% | 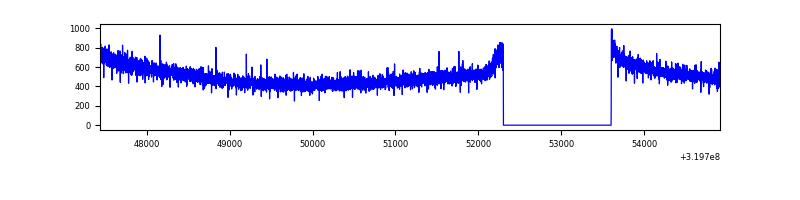 |
| B | 7476 | 6176 | 26 | 26 | 0.35% | 0.42% | 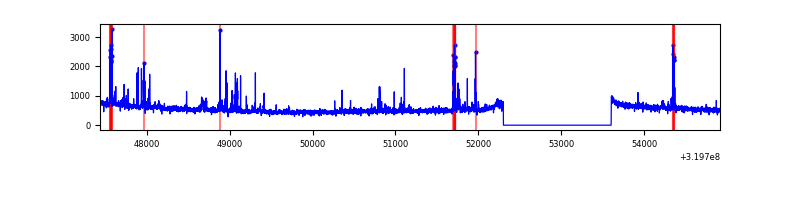 |
| C | 7476 | 6176 | 1 | 1 | 0.01% | 0.02% | 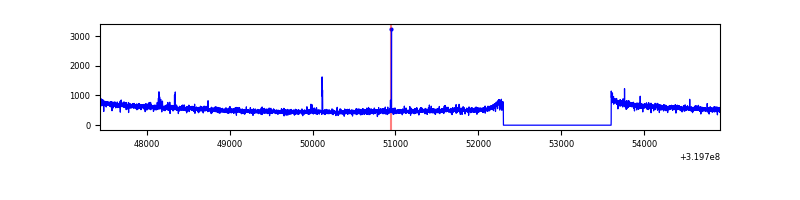 |
| D | 7476 | 6176 | 17 | 17 | 0.23% | 0.28% | 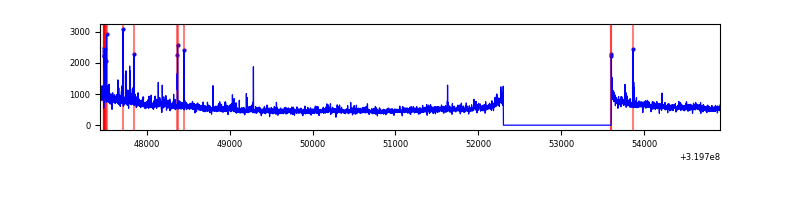 |
Top three noisy pixels from each quadrant. If the there are fewer than three noisy pixels in the level2.evt file, extra rows are filled as -1
| Pixel properties | Quadrant properties | ||||||
|---|---|---|---|---|---|---|---|
| Quadrant | DetID | PixID | Counts | Sigma | Mean | Median | Sigma |
| A | 13 | 254 | 11220 | 64.16 | 815 | 800 | 162.4 |
| A | 0 | 226 | 6979 | 38.04 | 815 | 800 | 162.4 |
| A | 3 | 137 | 6713 | 36.41 | 815 | 800 | 162.4 |
| B | 3 | 64 | 136900 | 890.19 | 825 | 805 | 152.9 |
| B | 0 | 229 | 71809 | 464.43 | 825 | 805 | 152.9 |
| B | 0 | 189 | 52456 | 337.85 | 825 | 805 | 152.9 |
| C | 14 | 238 | 129962 | 694.24 | 810 | 816 | 186.0 |
| C | 7 | 247 | 40783 | 214.85 | 810 | 816 | 186.0 |
| C | 9 | 244 | 6841 | 32.39 | 810 | 816 | 186.0 |
| D | 8 | 195 | 365520 | 1893.91 | 807 | 788 | 192.6 |
| D | 12 | 233 | 71866 | 369.08 | 807 | 788 | 192.6 |
| D | 1 | 52 | 45796 | 233.71 | 807 | 788 | 192.6 |
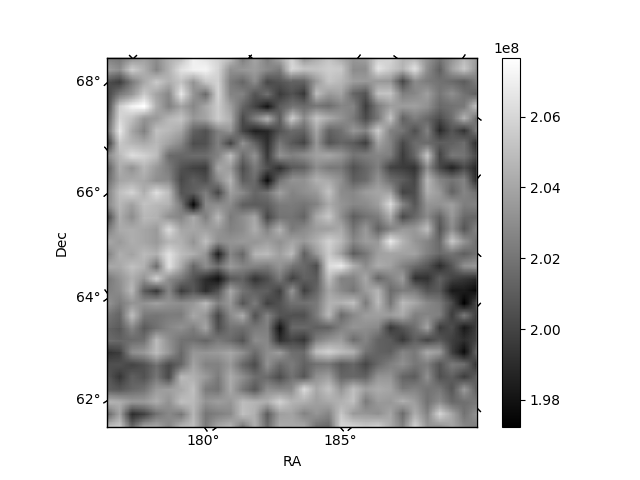
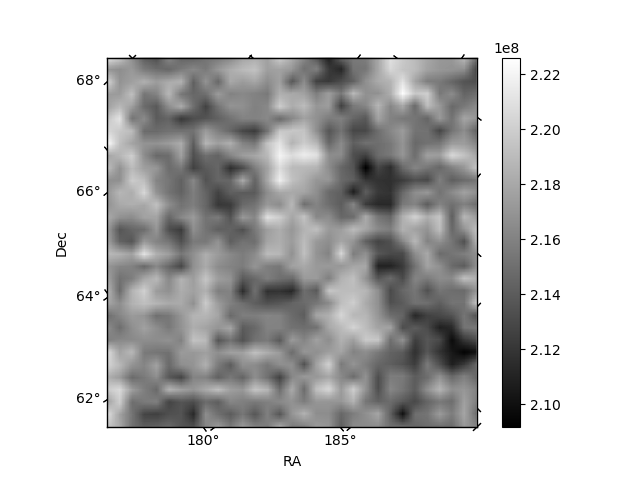
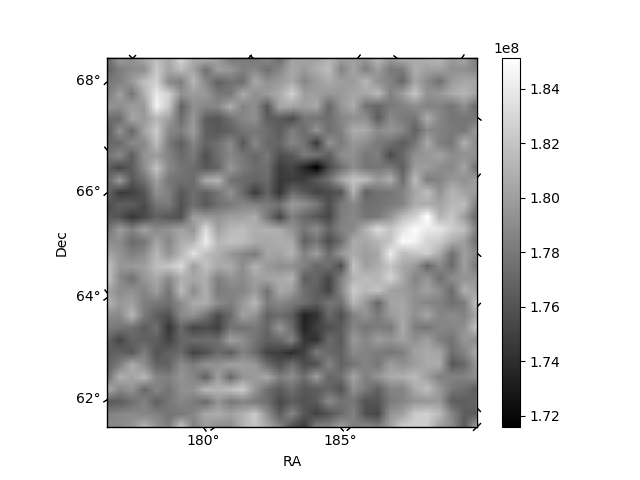
Histogram calculated using DETX and DETY for each event in the final _common_clean file
| Quadrant A |  |
 |
Quadrant B |
|---|---|---|---|
| Quadrant D | 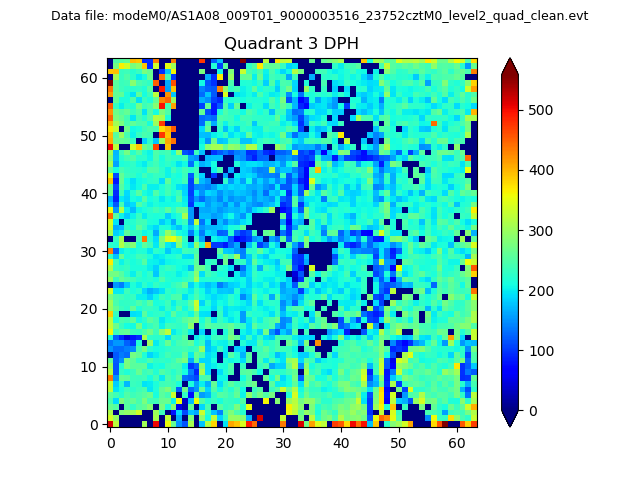 |
 |
Quadrant C |
| Plot type | Count rate plots | Images |
|---|---|---|
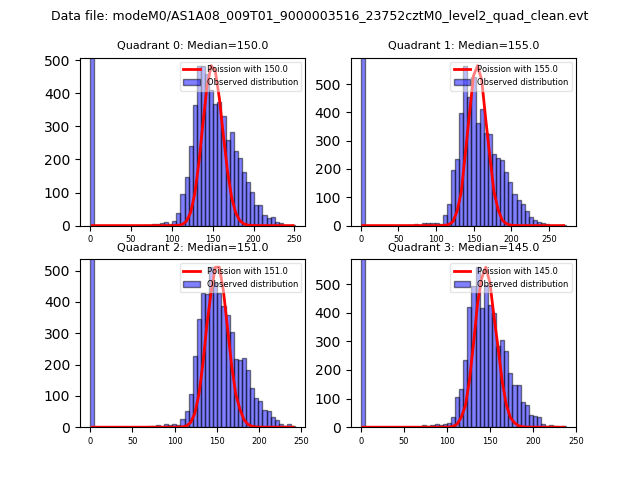
| Comparison with Poisson distribution Blue bars denote a histogram of data divided into 1 sec bins. Red curve is a Poisson curve with rate = median count rate of data. |
 |
 |
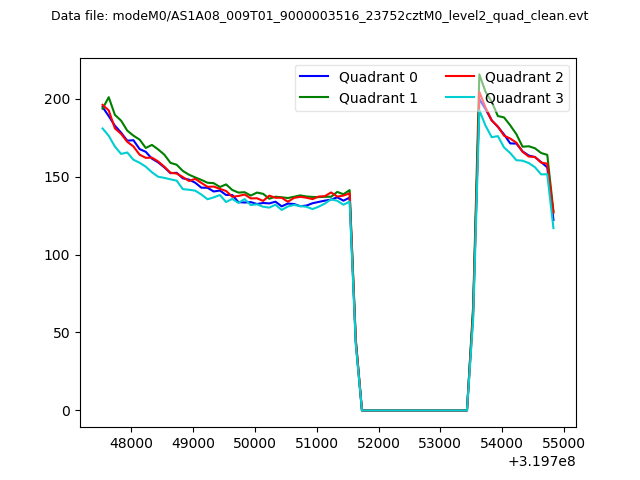
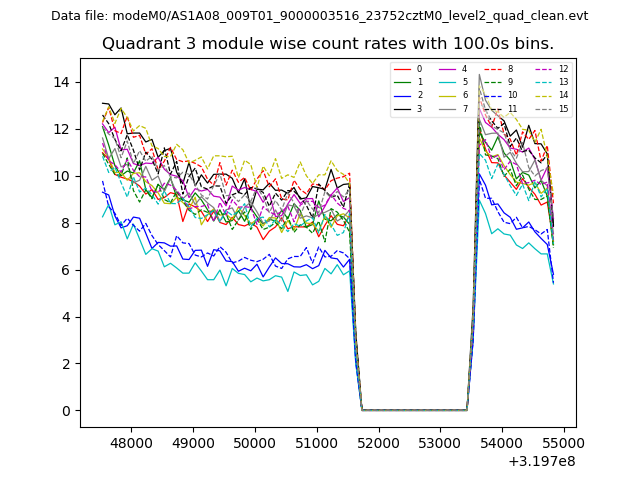
| Quadrant-wise count rates Data is divided into 100 sec bins |
 |
|
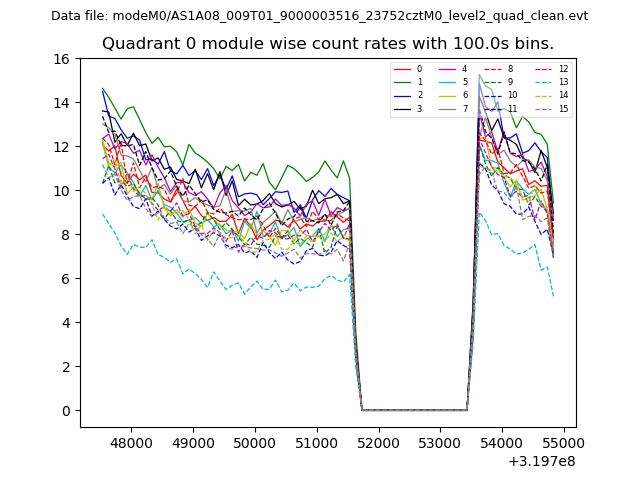
| Module-wise count rates for Quadrant A Data is divided into 100 sec bins |
 |
 |
| Module-wise count rates for Quadrant B Data is divided into 100 sec bins |
 |
 |
| Module-wise count rates for Quadrant C Data is divided into 100 sec bins |
 |
 |
| Module-wise count rates for Quadrant D Data is divided into 100 sec bins |
 |
 |
| Parameter | Plot |
|---|---|
| CZT HV Monitor |  |
| D_VDD | 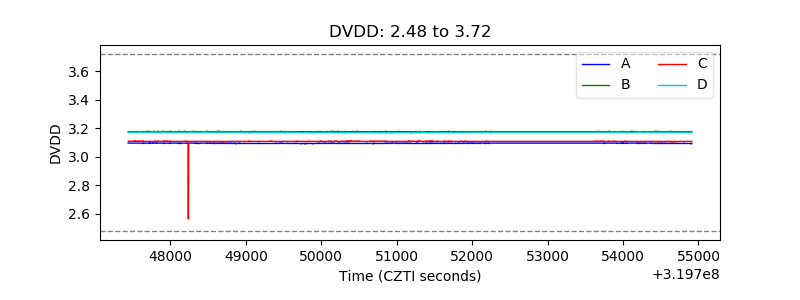 |
| Temperature 1 | 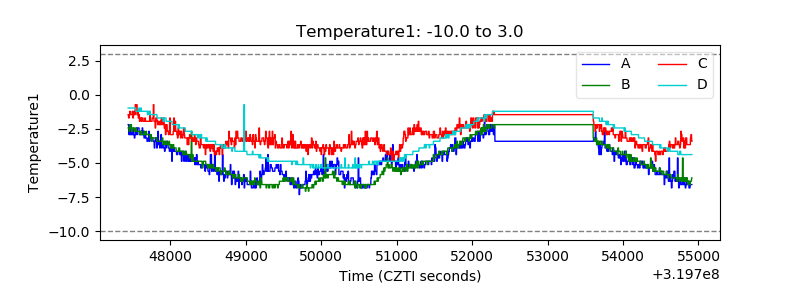 |
| Veto HV Monitor | 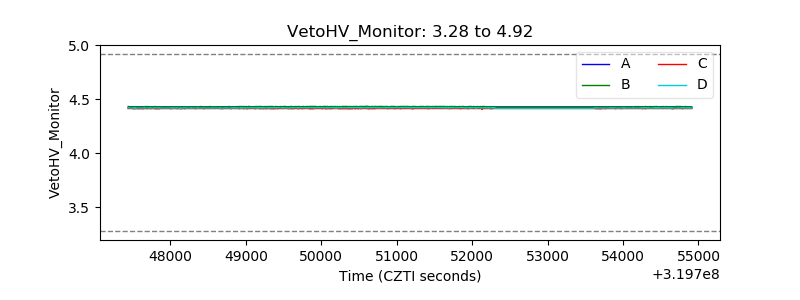 |
| Veto LLD | 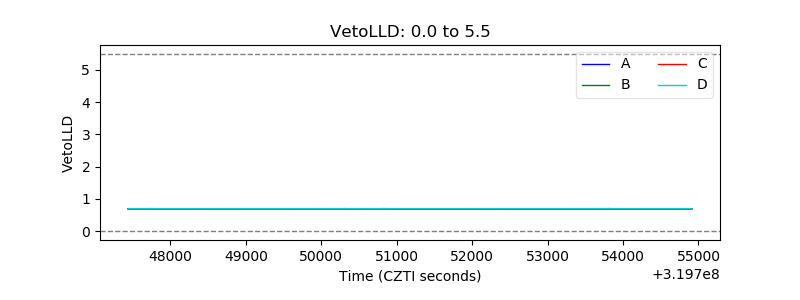 |
| Alpha Counter | 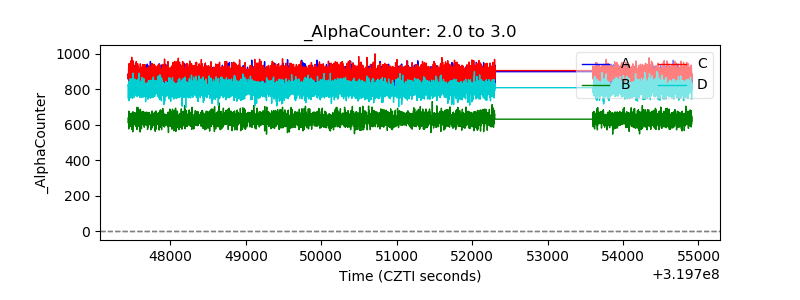 |
| _CPM_Rate | 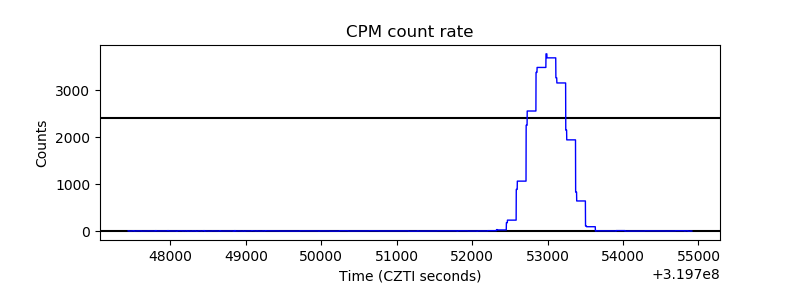 |
| CZT Counter | 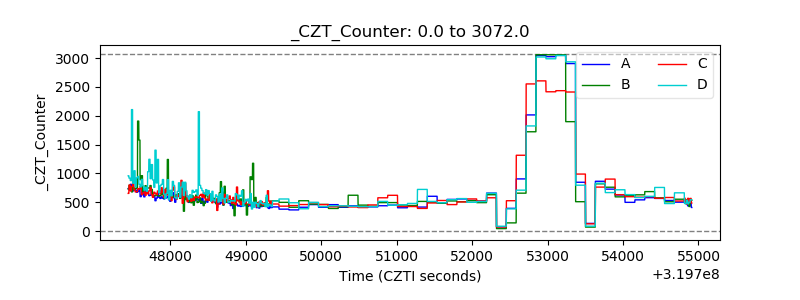 |
| +2.5 Volts monitor |  |
| +5 Volts monitor | 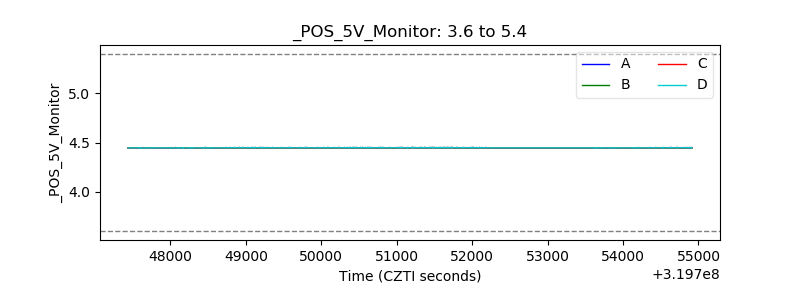 |
| _ROLL_ROT | 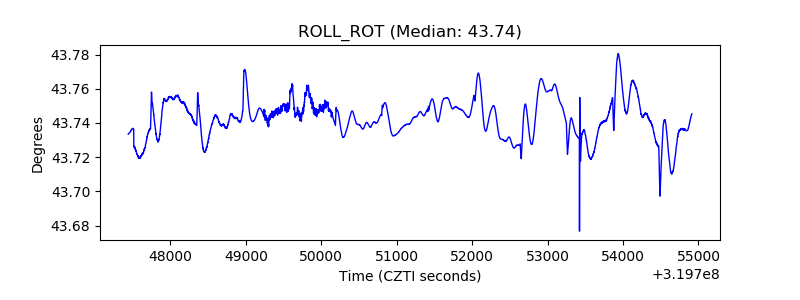 |
| _Roll_DEC | 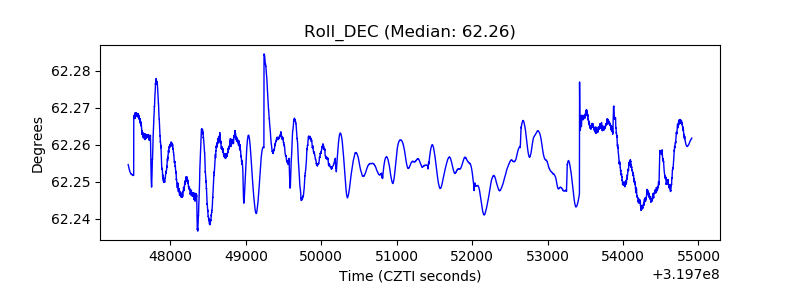 |
| _Roll_RA | 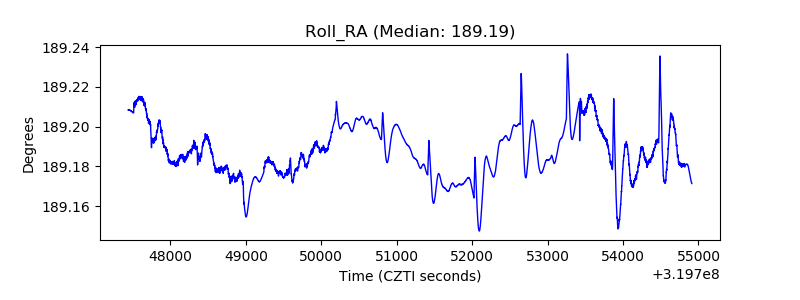 |
| Veto Counter | 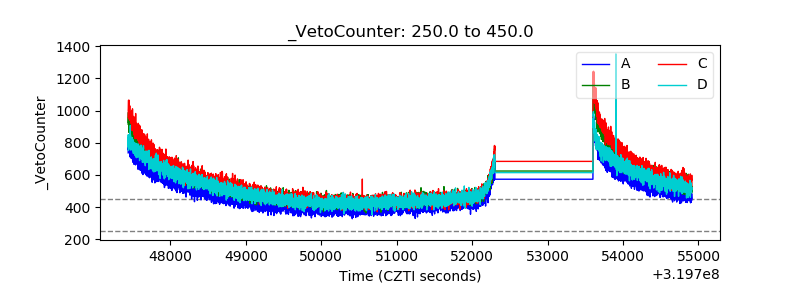 |